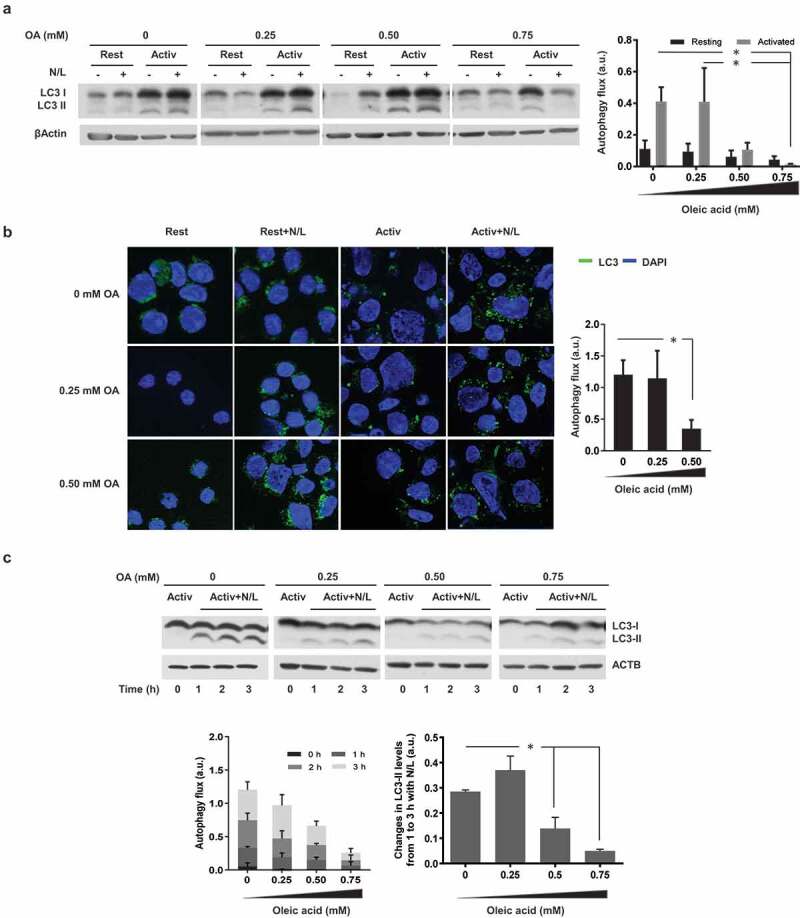
Figure 2.

OA-challenge inhibits activation-induced macroautophagy activation. Mouse TH1 cells were incubated in the presence of different concentrations of OA for 48 h. Cells were then either left resting (Rest) or stimulated (Activ) with plate bound anti-CD3 and anti-CD28 antibodies for 24 h. NH4Cl and leupeptin (N/L) were added for the last 3 h of the 24-h stimulation to assess autophagy flux measured by (a) immunoblot (LC3-II degradation) or (b) immunofluorescence (LC3+ vesicle turnover). ACTB was used as loading control for normalization of values. Bar graphs represent mean+SEM of autophagy flux, measured as the difference between the intensity of the LC3-II band in cells activated in the presence or absence of N/L from 5 independent experiments or as the difference between the number of LC3+ puncta in cells cultured in the presence or absence of N/L from 10 fields per sample containing 30 cells per field (*P < 0.05. ANOVA). (c) Murine TH1 cells were incubated for 48 h in the presence or absence of different concentrations of OA and then activated with plate-bound anti-CD3 and anti-CD28 antibodies for 24 h. N/L were added for the last 1, 2 or 3 h of the 24-h activation period. Bar graphs represent mean+SEM of autophagy flux from 3 independent experiments, measured as the difference between the intensity of the LC3-II band in cells cultured in the presence or absence of N/L for different periods of time or the difference between LC3-II levels in cells incubated for 1 or 3 h with N/L (*P < 0.05; ANOVA).
