

ABSTRACT
A switch from autophagy to apoptosis is implicated in chondrocytes during the osteoarthritis (OA) progression with currently unknown mechanism(s). In this study we utilized a flow fluid shear stress (FFSS) model in cultured chondrocytes and a unilateral anterior crossbite (UAC) animal model. We found that both FFSS and UAC actively induced endoplasmic reticulum stress (ERS) in the temporomandibular joints (TMJ) chondrocytes, as demonstrated by dramatic increases in expression of HSPA5, p-EIF2AK3, p-ERN1 and ATF6. Interestingly, both FFSS and UAC activated not only pro-death p-EIF2AK3-mediated ERS-apoptosis programs but also pro-survival p-ERN1-mediated autophagic flux in chondrocytes. Data from FFSS demonstrated that MTORC1, a downstream of p-ERN1, suppressed autophagy but promoted p-EIF2AK3 mediated ERS-apoptosis. Data from UAC model demonstrated that at early stage both the p-ERN1 and p-EIF2AK3 were activated and MTORC1 was inhibited in TMJ chondrocytes. At late stage, MTORC1-p-EIF2AK3-mediated ERS apoptosis were predominant, while p-ERN1 and autophagic flux were inhibited. Inhibition of MTORC1 by TMJ local injection of rapamycin in rats or inducible ablation of MTORC1 expression selectively in chondrocytes in mice promoted chondrocyte autophagy and suppressed apoptosis, and reduced TMJ cartilage loss induced by UAC. In contrast, MTORC1 activation by TMJ local administration of MHY1485 or genetic deletion of Tsc1, an upstream MTORC1 suppressor, resulted in opposite effects. Collectively, our results establish that aberrant mechanical loading causes cartilage degeneration by activating, at least in part, the MTORC1 signaling which modulates the autophagy and apoptosis programs in TMJ chondrocytes. Thus, inhibition of MTORC1 provides a novel therapeutic strategy for prevention and treatment of OA.
Abbreviations : ACTB: actin beta; ATF6: activating transcription factor 6; BECN1: beclin 1; BFL: bafilomycin A1; CASP12: caspase 12; CASP3: caspase 3; DAPI: 4ʹ,6-diamidino-2-phenylindole; DDIT3: DNA-damage inducible transcript 3; EIF2AK3/PERK: eukaryotic translation initiation factor 2 alpha kinase 3; ER: endoplasmic reticulum; ERS: endoplasmic reticulum stress; ERN1/IRE1: endoplasmic reticulum to nucleus signaling 1; FFSS: flow fluid shear stress; HSPA5/GRP78/BiP: heat shock protein 5; LAMP2: lysosome-associated membrane protein 2; MAP1LC3B/LC3B: microtubule associated protein 1 light chain 3 beta; MTOR: mechanistic target of rapamycin kinase; MTORC1: mechanistic target of rapamycin complex 1; OA: osteoarthritis; PRKAA1/2/AMPK1/2: protein kinase, AMP-activated, alpha 1/2 catalytic subunit; RPS6: ribosomal protein S6; Rapa: rapamycin; SQSTM1/p62: sequestosome 1; TEM: transmission electron microscopy; TG: thapsigargin; TMJ: temporomandibular joints; TSC1/2: tuberous sclerosis complex 1/2; UAC: unilateral anterior crossbite; UPR: unfolded protein response; XBP1: x-box binding protein 1.
KEYWORDS: Autophagy, chondrocyte, endoplasmic reticulum stress, endoplasmic reticulum to nucleus signaling 1, eukaryotic translation initiation factor 2 alpha kinase 3, mechanistic target of rapamycin complex 1, osteoarthritis
Introduction
Osteoarthritis (OA) is a chronic degenerative joint disorder that destroys articular cartilage with a high socioeconomic cost [1]. Biomechanical factors play important roles in the pathogenesis of OA [2,3]. Temporomandibular joint (TMJ), which relates biomechanically to dental occlusion, is a site frequently insulted by OA [4]. We recently reported that fluid flow shear stress (FFSS) induced TMJ chondrocyte death in vitro [5–7]. We also developed an in vivo abnormal dental occlusion termed unilateral anterior cross (UAC) model and demonstrated that it induced chondrocyte death and OA-like lesions in TMJ cartilage in rats and mice [7–11]. These in vitro and in vivo models are useful tools to facilitate the investigation of molecular mechanisms through which abnormal biomechanical forces induce chondrocyte death and the onset of TMJ OA.
The folding of secretory proteins in endoplasmic reticulum (ER) is highly dependent upon the presence of a proper ER luminal calcium concentration which is altered by abnormal biomechanical forces [12]. Exposure of cells to extensive loading causes calcium overload and accumulation of misfolded proteins in ER lumen, termed ER stress (ERS) [13]. This ERS is sensed by three ER transmembrane proteins, including the EIF2AK3 (eukaryotic translation initiation factor 2 alpha kinase 3), ERN1/IRE1 (endoplasmic reticulum to nucleus signaling 1) and ATF6 (activating transcription factor 6), which is accompanied by upregulation of several chaperones that bind preferentially to the unfolded proteins [14,15]. Residing within the ER as a Ca2+-dependent molecular chaperone, HSPA5/GRP78 (heat shock protein 5) plays a crucial role and considered as a marker of ERS [16]. Under severe ERS conditions, apoptosis is initiated which is a form of programmed cell death that represents the degradative turnover of cells within organisms [17,18]. The apoptosis induced by emerging chronic or unresolved perturbations in ERS is termed as ERS pathway-apoptosis (ERS-apoptosis) [19]. ERS-apoptosis effectors determine cell death or survival and are directly regulated by the phosphorylated EIF2AK3 (p-EIF2AK3), which enhances the expression of DDIT3 (DNA-damage inducible transcript 3) and CASP12 (caspase 12), and eventually activation of cleaved CASP3 (caspase 3) [20,21]. Whether or not UAC can induce ERS-apoptosis in TMJ OA cartilage remains unknown.
Autophagy, a cellular self-digestion process, is evolutionally observed among species and is intimately connected with ERS [22,23]. It determines the turnover of organelles and proteins within cells, and is perceived as an important mechanism for cell survival in OA [24]. Autophagy is generally completed by a three-step process of autophagic flux, which is controlled by autophagy genes, such as Atg. The three steps are: (i) the formation of a double membrane known as an autophagosome (cytosolic double-membrane vesicles) that seclude portions of the cytoplasm, (ii) autophagosomes fused with lysosomes and become what are called ‘autolysosomes’, and (iii) degrade the materials contained within them [25–28]. BECN1 (beclin 1) and LC3B (microtubule associated protein 1 light chain 3 beta) are two major regulators of autophagy. BECN1 allows the nucleation of the autophagosome and the conversion of LC3B-I to LC3B-II through lipidation by an ubiquitin-like system to form the autophagosome. The increased expression of BECN1 and LC3B-II is a sign for increased autophagosome formation [26–28] and the colocalization of LC3B-II with LAMP2 (lysosomal associated membrane protein 2), a lysosomal receptor, indicates fusion of autophagosome with lysosomes [29]. SQSMT1/p62 (sequestosome 1) has a receptor function to recognize ubiquitinated proteins that need to be removed from the cytoplasm during autophagy; its amount is generally considered to inversely correlate with autophagic activity [30]. MTOR (mechanistic target of rapamycin kinase) is a highly conserved protein kinase that forms two distinct functional complexes, i.e., MTOR complex 1 (MTORC1) and MTORC2. MTORC1 is a sensitive target of rapamycin and is suppressed by the TSC1/2 (tuberous sclerosis complex 1/2), which is a negative regulator of autophagy and functions as an upstream suppresser of MTORC1 to reduce the severity of experimental OA in mice [31,32]. It has reported that activation of autophagy by rapamycin prevented human chondrocytes from OA-like lesions [33] and delayed articular cartilage degradation in OA mouse model [34]. Previous studies showed that failure to initiate autophagy program leading to cell death [35,36]. Suppression of autophagy genes leads to cell death in cartilage, implying a protective and survival-promoting function of autophagy [37–41]. Stress pathways often sequentially elicit autophagy and apoptosis within the same cell. Autophagy inhibits the extension and blocks the induction of apoptosis by removing excessive cellular components, while apoptosis-associated caspase activation shuts off the autophagy-lysosome process [42]. Therefore, it is interesting to determine whether MTORC1 switches the protective autophagic program to the ERS-apoptosis process in the biomechanically induced OA progression.
In our UAC dental biomechanically induced TMJ OA cartilage there seems a predominant of apoptosis because cartilage lost with time. Whether there is autophagy and how does the autophagy is suppressed and the ERS-apoptosis become predominant is of interesting yet remains unclarified. In this study, using our previously established in vivo and in vitro models as well as two genetic mouse models, we investigated whether autophagy and ERS-apoptosis are both involved in the progression of biomechanically induced TMJ OA lesions. We further investigated whether MTORC1 plays a role in switching the ERN1-mediated autophagic flux to the EIF2AK3-mediated ERS-apoptosis program in chondrocytes in TMJ OA progression.
Results
UAC inhibits MTORC1 and activates autophagy in chondrocytes at early OA stage, but induces ERS-apoptosis during the entire OA process in rat TMJ cartilage
The condylar cartilage contains four layers, i.e., the superficial fibrous, proliferative, pre-hypertrophic and hypertrophic zones. Consistent with our previous results [6], UAC treatment induced OA-like lesions in the TMJ condylar cartilage in rats, such as reduced matrix production and marked cartilage loss in pre-hypertrophic and hypertrophic zones (Figure 1(a), Figure S1(a)). Apoptosis was enhanced as demonstrated by increased numbers of cleaved CASP3-, CASP12-, DDIT3-, and TUNEL-positive chondrocytes during the entire UAC experimental time, i.e., from 2 to 20 wk (Figure 1(b-g), Figure S1(b-e)). Results from western blotting and immunohistochemical (IHC) staining revealed accumulation of BECN1 and LC3B-II proteins in 2 and 4 wk UAC groups, but not in 8 wk UAC group (Figure 1(f-i), Figure S2(a-b)). In line with that, the expression level of SQSTM1 was decreased in 2 and 4 wk UAC group, but was increased from 8 wk (Figure 1(f,g)). The number of cells with co-localization of LC3B-II and LAMP2, revealed by immunofluorescence (IF) staining, was increased in 2 and 4 wk UAC group, but was markedly reduced in 8 to 20 wk UAC group (Figure 1(j) and Figure S2(c)).
Figure 1.
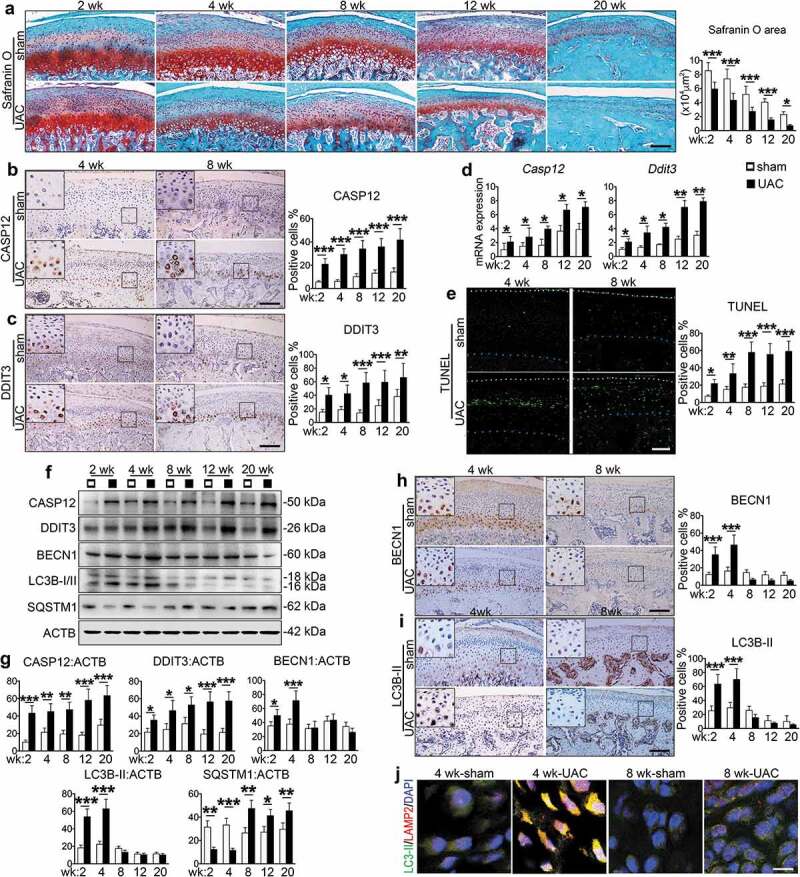
Effects of UAC on ERS-apoptosis signaling and autophagic flux in chondrocytes in rat TMJ cartilage. (a) Safranin O staining of condylar cartilage. Sagittal central section of TMJ in sham and UAC group from 2 to 20 wk. Scale bar: 200 μm. Quantitative data of cartilage area (right panel). (b and c) Immunohistochemistry (IHC) staining using antibodies against CASP12 and DDIT3 at 4 and 8 wk. Quantitative data of CASP12- and DDIT3-positive cells in each group are shown (right panels). Scale bar: 200 μm. (d) Real-time RT-PCR (qPCR) analyses for the mRNA expression of Casp12 and Ddit3 from rat TMJ in sham and UAC group. (e) TUNEL staining. Quantitative data of percentage of TUNEL-positive cells in each group (right panel). White dots, superficial condylar cartilage; blue dots, the border between cartilage and subchondral bone. Scale bar: 100 μm. (f) Western blotting for the protein expression of CASP12, DDIT3, BECN1, LC3B-I/II and SQSTM1. (g) Quantitative data of (f). (h and i) IHC staining for BECN1 and LC3B-II. Quantitative data of positive cells (right panels). (j) Immunofluorescence (IF) staining for autophagosome and lysosome location. LC3B-II puncta, green; LAMP2 puncta, red; DAPI, blue. Scale bar, 10 μm. Results are expressed as mean ± standard deviation. Safranin O and IHC staining: N = 6. Western blotting and qPCR analysis: N = 3. * P < 0.05, ** P < 0.01 and *** P < 0.001 represent significant differences between the indicated groups.
ERS was induced in TMJ chondrocytes during the entire UAC experimental time course, as demonstrated by increased expression of Hspa5, Atf6, Eif2ak3 and p-EIF2AK3 at the mRNA and protein levels as measured by qPCR analysis, western blotting and IHC staining (Figure 2(a-e), Figure S2(d-e)). However, the increasing of p-ERN1 were noticed only at 2 and 4 wk. After 8 wk, both Ern1 mRNA level and p-ERN1 protein level were decreased to the basal level (Figure 2(c-f), Figure S2(f)). Interestingly, UAC reduced the levels of p-MTOR and its downstream target p-RPS6 (phosphorylated ribosomal protein S6, S235/236) in chondrocytes from 2 to 4 wk, but not from 8 to 20 wk (Figure 2(d,e,g), Figure S2(g)).
Figure 2.
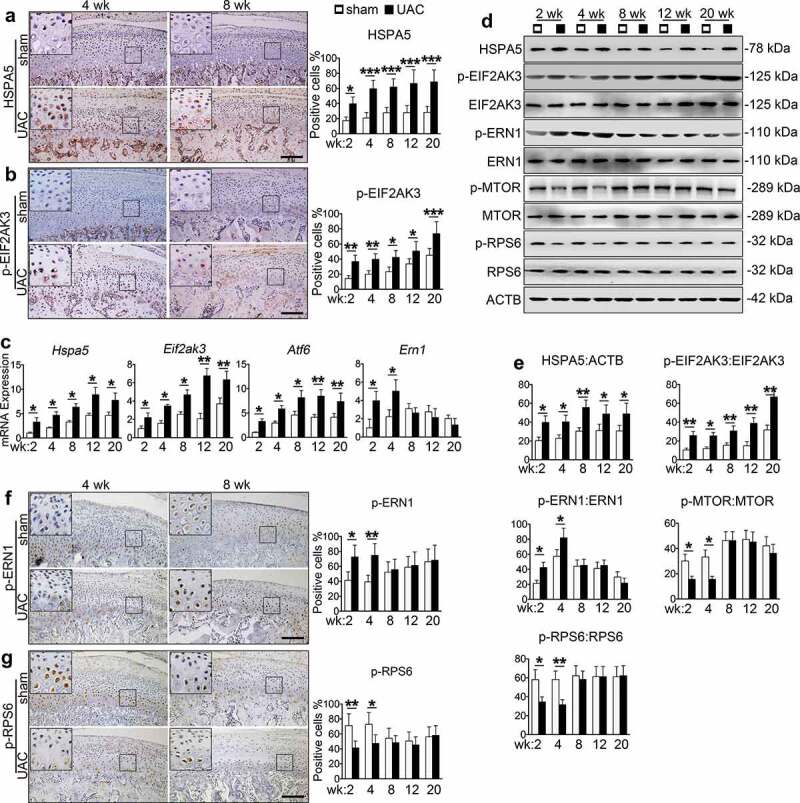
Effects of UAC on MTORC1 and ERS signaling in chondrocytes in rat TMJ cartilage. (a and b) IHC staining using antibodies against HSPA5 and p-EIF2AK3 at 4 and 8 wk. Quantitative data of HSPA5- and p-EIF2AK3-positive cells in each group are shown (right panels). Scale bar, 200 μm. (c) qPCR analyses for the mRNA expression of Hspa5, Eif2ak3, Atf6 and Ern1 from rat TMJ in sham and UAC group. (d) Western blotting for HSPA5, p-EIF2AK3, EIF2AK3, p-ERN1, ERN1, p-MTOR, MTOR, p-RPS6 and RPS6. (e) Quantitative data of (d). (f and g) IHC staining against p-ERN1 and p-RPS6 at 4 and 8 wk. Quantitative data of the positive cells in each group are shown (right panels). Scale bar: 200 μm. Results are expressed as mean ± standard deviation. IHC staining: N = 6. Western blotting and qPCR analysis: N = 3. * P < 0.05, ** P < 0.01 and *** P < 0.001 represent significant differences between the indicated groups.
Collectively, these results suggest that UAC induces ERS-apoptosis during the entire process of TMJ OA progression while it induces autophagy at early stage but suppresses it at late stage. MTORC1, a well-known inhibitor of autophagy, is suppressed at early stage but activated at the late stage, suggesting that it plays a role in switching autophagy to ERS-apoptosis in the progression of UAC induced TMJ OA cartilage lesions.
FFSS stimulates ERS-apoptosis during the entire experimental time course, activates autophagy but inactivates MTORC1 at early stage, and activates MTORC1 signaling but inactivates autophagy at late stage in cultured ATDC5 cells
Next, we utilized the in vitro flow fluid shear stress (FFSS) model system to determine the effects of mechanical forces on ERS-apoptosis and autophagy pathways in ATDC5 chondrocyte-like cells. We first investigated whether calcium influx and ERS were impacted by FFSS. Results from flow cytometry revealed that FFSS time-dependently enhanced calcium influx, which started at 10 min, peaked at 1 h, and lasted for 4 h (Figure 3(a)). The calcium overload was most significant in ER, as revealed by the triple fluorescence staining (Figure 3(b)). The expression levels of Hspa5, Eif2ak3, Ern1 and Atf6, all markers for ERS, were up-regulated by FFSS compared with those of FFSS-untreated control groups, as measured by qPCR analysis and western blotting (Figure 3(c-e)). The ER calcium overload induced by FFSS was abolished by the treatment of thapsigargin (TG), an ER calcium evacuator, or depletion of Ca2+ from culture medium (Figure 3(b)). TG treatment or removal of Ca2+ from the media blocked the FFSS-induced expression of Hspa5, Eif2ak3, Ern1 and Atf6 revealed at both mRNA and protein levels (Figure 3(c-e)). These results demonstrate that FFSS has an impact on calcium influx and ERS in chondrocytes.
Figure 3.
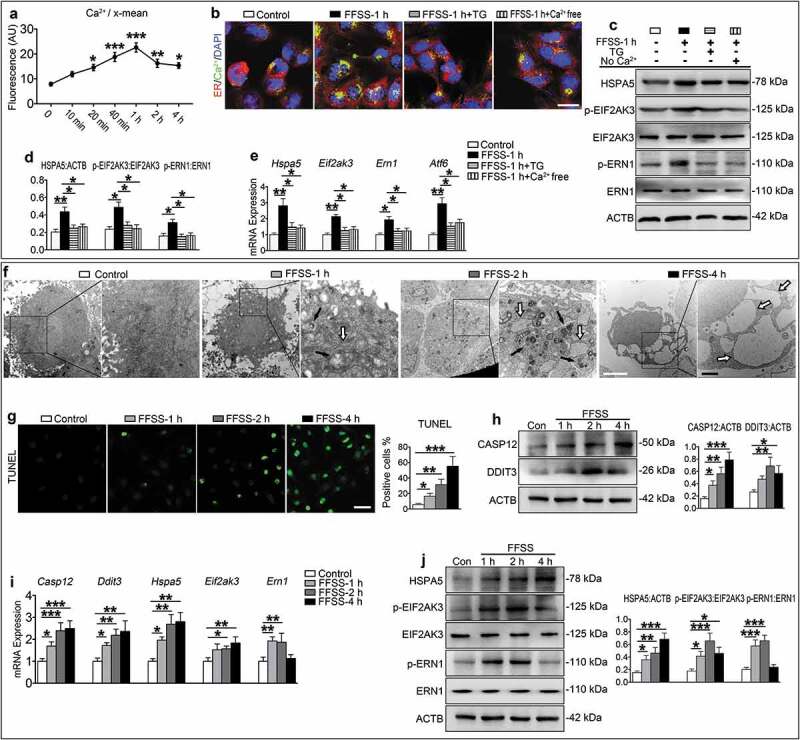
FFSS activates ERS-apoptosis in cultured ATDC5 cells through the Ca2+ overload. (a) ATDC5 cells were exposed to 24 dyne/cm2 FFSS for the indicated times and stained with a calcium fluorescence dye, followed by flow cytometry for measurement of Ca2+ content in the ER. (b) ATDC5 cells were exposed to 24 dyne/cm2 FFSS for 1 h and treated with 10 μM thapsigargin (TG) or medium without calcium (Ca2+ free). Representative images of each group are shown. Calcium, green; ER, red. Scale bar: 10 μm. (c) Western blotting for protein expression of HSPA5, p-EIF2AK3, EIF2AK3, p-ERN1 and ERN1. (d). Quantitative data of (c). (e) qPCR analyses for the mRNA expression of Hspa5, Eif2ak3, Ern1 and Atf6. (f) ATDC5 cells were subjected to 24 dyne/cm2 FFSS for 1, 2 and 4 h. TEM images of ATDC5 cells with 6000X (left panels) and 16500X (right panels) are shown. Black arrows, the incompletely digested organelle and lysosomal enzyme granules; white arrows, the expansion of ER. White bar: 2 μm. Black bar: 1 μm. (g) ATDC5 cells were treated as in (f) and subjected to TUNEL staining. Quantitative data of TUNEL-positive cells (right panel). Scale bar: 50 μm. (h-j) ATDC5 cells were treated as in (f), followed by western blotting or qPCR analyses for expression of the indicated genes. Quantitative data are presented in the respective right panels. Results are expressed as mean ± standard deviation. N = 3. * P < 0.05, ** P < 0.01 and *** P < 0.001 represent significant differences between the indicated groups.
We next investigated whether FFSS induced ERS-apoptosis and autophagy in ATDC5 cells. Cells were treated with FFSS (24 dyne/cm2) for 1, 2 and 4 h. Results from transmission electron microscopy (TEM) analysis revealed that ATDC5 cells without the FFSS treatment were polygonal with large and uncondensed nuclei and that their ER was continuous and compact with few vesicles in the cytoplasm. FFSS caused an expansion of ER in ATDC5 cells, which become worse overtime. The rough ER disappeared, the swollen mitochondria were clustered, the electron density was decreased and apoptosis was obvious which contained multiple rounded vacuoles. Autolysosomes that contained incompletely digested organelles and lysosomal enzyme granules were also observed especially in those treated for 1 and 2 h (Figure 3(f)). Consistent with this ultrastructural acceleration of apoptosis, the number of TUNEL-positive cells was increased, the expression levels of CASP12 and DDIT3 were upregulated in FFSS-treated cells as revealed by qPCR analysis and western blotting, and the expression levels of HSPA5 and p-EIF2AK3 were up-regulated from 1 to 4 h (Figure 3(g-j)). However, the expression levels of p-ERN1, BECN1 and LC3B-II were increased at 1 and 2 h, but not at 4 h. The expression levels of p-MTOR and p-RPS6 were decreased at 1 and 2 h, but not at 4 h (Figure 3(i-j), Figure 4(a,b)), while the level of SQSTM1 was decreased at 1 and 2 h, but was increased at 4 h. The expression level of LAMP2 was increased during the entire time course (Figure 4(c)). Results from IF staining revealed an increase in co-localization puncta of LC3B-II and LAMP2 at 1 and 2 h, but not 4 h (Figure 4(d)). Bafilomycin A1, which inhibits the fusion between autophagosome and lysosome, increased the expression level of LC3B-II at 2 h, but not 4 h, and did not impact on the expression of p-MTOR and p-RPS6 (Figure 4(e,f)).
Figure 4.
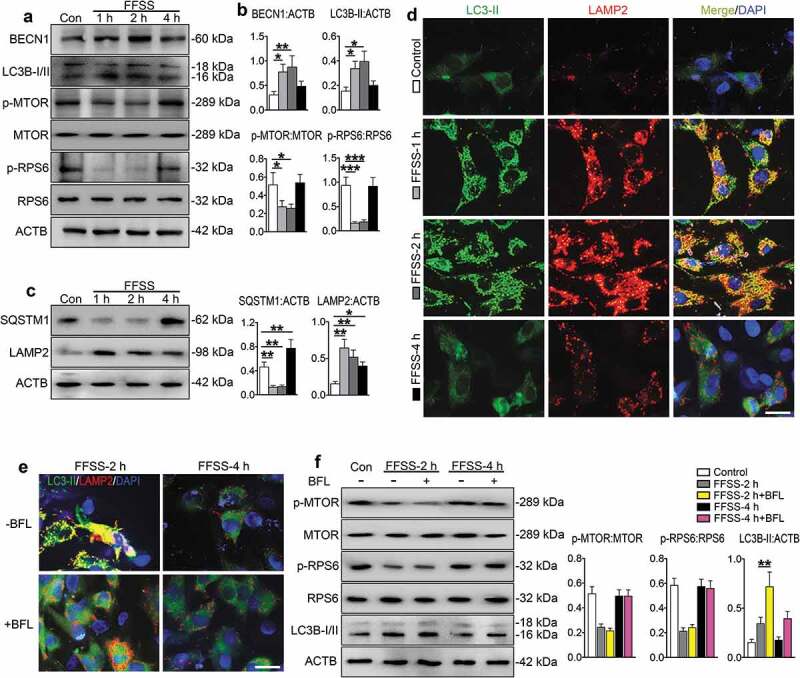
FFSS activates autophagic flux but inactivates MTORC1 pathways in cultured ATDC5 cells. (a) ATDC5 cells were exposed to 24 dyne/cm2 FFSS for the indicated times and western blot for measurement of indicated protein expression. (b) Quantitative data of (a). (c) Western blotting for protein expression of SQSTM1/p62 and LAMP2 for detecting autophagic flux. (d). ATDC5 cells were treated as in (a). IF staining for locating the autophagosome and lysosome stations. Representative images of each group are shown. LC3B-II, green; LAMP2, red; DAPI, blue. Scale bar: 10 μm. (e) IF staining from ATDC5 cell stimulated with 2 and 4 h FFSS treatment with bafilomycin A1 (BFL). LC3B-II, green; LAMP2, red; DAPI, blue. Scale bar: 10 μm. (f) Western blotting for protein expression in ATDC5 cells which were subjected to 24 dyne/cm2 FFSS for 2 and 4 h with or without bafilomycin A1 treatment. Quantitative data are presented in the respective right panels. Results are expressed as mean ± standard deviation. N = 3. * P < 0.05, ** P < 0.01 and *** P < 0.001 represent significant differences between the indicated groups.
These results suggest that FFSS activates the ERS-apoptosis during the entire experimental course and activates autophagic flux at early stage but inactivates it at late stage and that MTORC1 may be involved in regulation of this process.
MTORC1 promotes p-EIF2AK3-mediated ERS-apoptosis, but suppresses autophagic flux, in FFSS-treated chondrocytes
To investigate whether EIF2AK3, a MTORC1 downstream target, plays a role in FFSS-induced ERS-apoptosis and autophagy program in chondrocytes, we added GSK2606414, an inhibitor of p-EIF2AK3, in the culture medium for 2 and 4 h FFSS treatment experiments. The results showed that GSK2606414 reduced the FFSS-increased CASP12, DDIT3 and p-EIF2AK3 expression and TUNEL-positive cells, promoted colocalization of LC3B-II and LAMP2, and reduced SQSTM1 expression (Figure 5(a-d), Figure S3(a)). It did not impact the expression of p-MTOR, p-RPS6, HSPA5 and p-ERN1 (Figure S3(b-d)), and did not reverse the FFSS-increased expression of LC3B-II and BECN1 at 2 h although it suppressed the expression of LC3B-II at 4 h (Figure 5(a-b)). Bafilomycin A1 suppressed the promoting effect of GSK2606414 on the colocalization of LC3B-II and LAMP2 (Figure 5(e)). Bafilomycin A1 also increased the protein expression level of LC3B-II and SQSTM1 in ATDC5 cells treated with GSK2606414 and FFSS at 2 and 4 h (Figure 5(e-g)).
Figure 5.
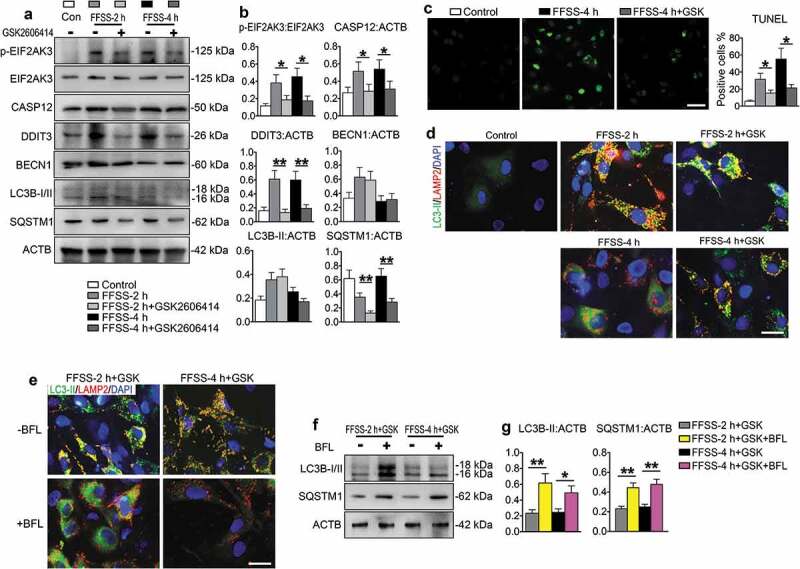
Effects of p-EIF2AK3 inhibition on ERS-apoptosis and autophagy in FFSS-treated chondrocytes. (a and b) ATDC5 cells were subjected to 24 dyne/cm2 FFSS for 2 or 4 h with or without 1 μM GSK2606414, followed by western blotting for expression of the indicated genes. (c) ATDC5 cells were first treated with GSK2606414 and, then, subjected to FFSS as in (a, b), followed by TUNEL staining. (d) ATDC5 cells were first treated with GSK2606414 and then subjected to FFSS as in (a, b), followed by IF staining for locating the autophagosome and lysosome stations. LC3B-II, green; LAMP2, red; DAPI, blue. Scale bar: 10 μm. (e) IF staining from ATDC5 cell stimulated with 2 and 4 h FFSS and treated with GSK2606414 and with or without bafilomycin A1 (BFL). LC3B-II, green; LAMP2, red; DAPI, blue. Scale bar: 10 μm. (f) Western blotting for protein expression of LC3B-I/II and SQSTM1/p62 in ATDC5 cells which were subjected to as in (e). (g) Quantitative data of (f). N = 3. * P < 0.05, ** P < 0.01 and *** P < 0.001 represent significant differences between the indicated groups.
We next investigated whether MTORC1 plays a role in FFSS-induced ERS-apoptosis and autophagy by adding rapamycin, an inhibitor of MTORC1, or MHY1485, an activator of MTORC1, in the ATDC5 cells culture medium before 2 and 4 h or 1 and 2 h FFSS stimulation, respectively. Results from dose-response experiments revealed that treatment of rapamycin at 100 nM concentration, and MHY1485 at 100 nM concentration could effectively regulate the MTORC1 expression without having marked influence on cell viability (Figure S4(a,b)). As expected, rapamycin treatment suppressed the expression levels of p-MTOR and p-RPS6 in FFSS-treated ATDC5 cells at 2 and 4 h, and reduced the FFSS-stimulated cell apoptosis and the expression of p-EIF2AK3, CASP12, and DDIT3 (Figure 6(a-d)). Rapamycin upregulated the expression levels of BECN1 and LC3B-II in FFSS-treated cells at 2 or 4 h (Figure 6(a,b)). Furthermore, rapamycin promoted the colocalization of LC3B-II and LAMP2 (Figure S4(c)) without affecting FFSS-induced upregulation of HSPA5 and p-ERN1 (Figure 6(a,b,d)). In contrast, the MTORC1 activator MHY1485 exhibited opposite effects. Specifically, MHY1485 treatment increased the 1 h and 2 h FFSS-induced suppression of p-MTOR and p-RPS6 expression, upregulated the 1 h and 2 h FFSS-stimulated expression of p-EIF2AK3, CASP12, and DDIT3, and increased the number of TUNEL-positive cells. MHY1485 reduced FFSS-stimulated expression of BECN1 and LC3B-II, without affecting the expression of HSPA5 and ERN1 (Figure S5(a-f)). MHY1485 increased p-EIF2AK3 expression and LC3B-II and LAMP2 puncta without affecting their colocalization (Figure S5(g)). All these MHY1485 effects on chondrocytes were reversed by addition of GSK2606414 into the culture media (Figure 6(e-f), Figure S5).
Figure 6.
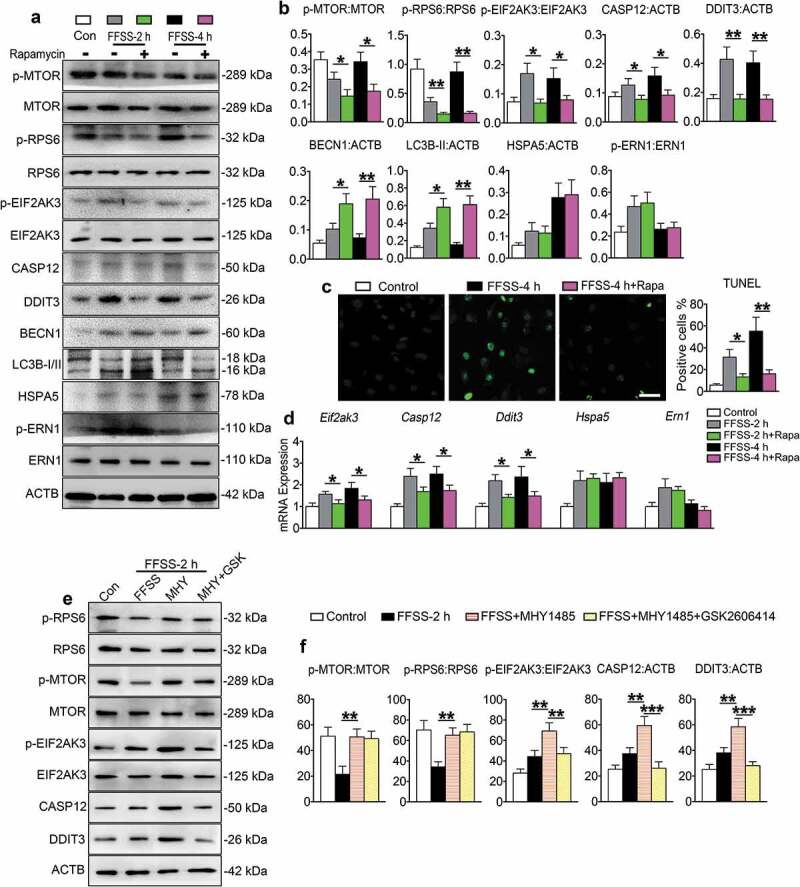
MTORC1 promotes p-EIF2AK3-mediated ERS-apoptosis, but suppresses autophagy, in chondrocytes in the presence of FFSS. (a-d) ATDC5 cells were treated with or without 100 nM rapamycin and then subjected to 24 dyne/cm2 FFSS for 2 or 4 h, followed by western blotting (a and b) or TUNEL staining (c) or qPCR analyses (d) for expression of the indicated genes. Scale bar: 50 μm. (e and f) Western blot analysis of p-RPS6, RPS6, p-MTOR, MTOR, p-EIF2AK3, EIF2AK3, CASP12 and DDIT3 expression in ATDC5 cells with 1 μM MHY1485 or 1 μM GSK2606414 treatment or both. N = 3. * P < 0.05, ** P < 0.01 and *** P < 0.001 represent significant differences between the indicated groups.
Collectively, these results suggest that MTORC1 suppresses the initiation of autophagosome formation and promotes ERS-apoptosis by upregulating p-EIF2AK3 which inhibits the autophagosome-lysosome fusion.
p-ERN1 inhibits MTORC1 to attenuate ERS-apoptosis in FFSS-treated chondrocytes
To investigate the role of ERN1 in FFSS-stimulated ERS-apoptosis mediated by MTORC1, ATDC5 cells were exposed to 4 h FFSS with or without 4μ8C, an inhibitor of p-ERN1, in the presence or absence of rapamycin. Results showed that 4μ8C inhibited the expression of p-ERN1, and suppressed expression of BECN1 and LC3B-II (Figure 7(a-c)). However, it increased the expression of p-MTOR, p-RPS6, p-EIF2AK3, CASP12 and DDIT3 and promoted chondrocyte apoptosis (Figure 7(c-f)). The suppressed autophagy and enhanced ERS-apoptosis by 4μ8C were reversed by rapamycin without affecting p-ERN1 expression, suggesting that MTORC1 functions downstream of ERN1. The FFSS-induced expression of HSPA5 was not altered by either 4μ8C or rapamycin (Figure 7(d-e)).
Figure 7.
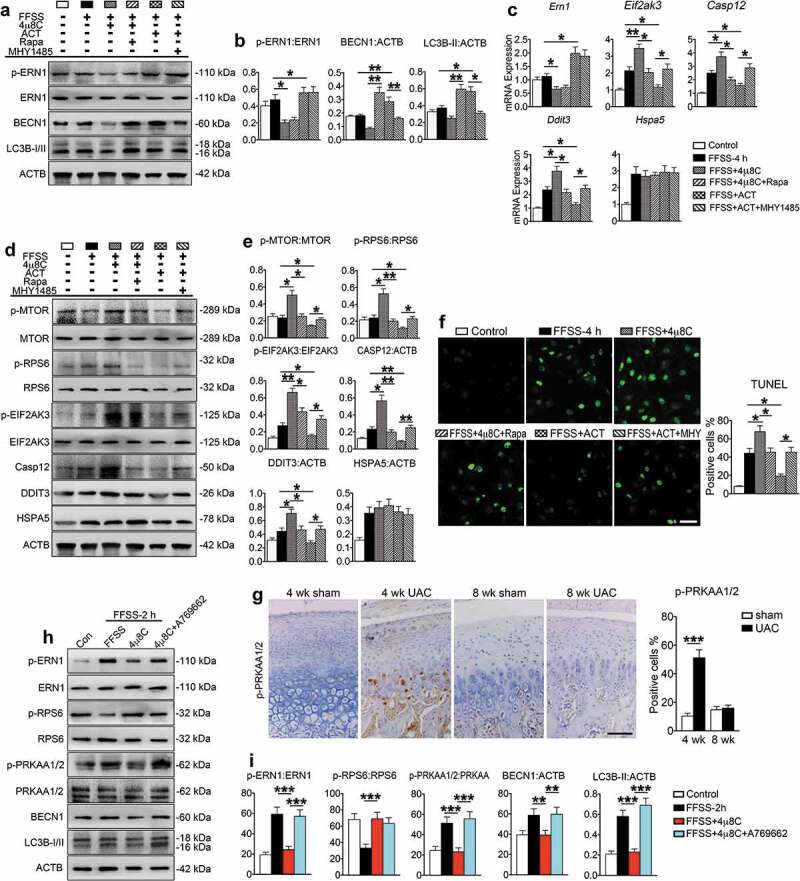
p-ERN1 inhibits MTORC1 to attenuate ERS-apoptosis in FFSS-treated chondrocytes. (a-f) The ATDC5 cells were treated with 4μ8C (1 μM), rapamycin (100 nM), 4μ8C (1 μM) + rapamycin (100 nM), infection of ERN1 lentivirus (ACT), or ACT + MHY1485 (100 nM). Two h later, cells were subjected with FFSS (dyne/cm2) for 4 h, followed by western blotting (a, b, d, and e) and qPCR analysis (c) for expression of the indicated genes, or TUNEL staining for cell apoptosis (f). Scale bar, 50 μm. (g) IHC staining using antibody against p-PRKAA1/2 at 4 and 8 wk. Quantitative data of the positive cells in each group are shown (right panels). Scale bar: 100 μm. (h and i) Western blot analysis of indicated markers in ATDC5 cells with 1 μM 4μ8C or 1 μM A769662 treatment or both. Results are expressed as mean ± standard deviation. N = 3. * P < 0.05, **P < 0.01 and *** P < 0.001 represent significant differences between the indicated groups.
To further investigate the role of ERN1 in regulation of MTORC1 in process of ERS-apoptosis and autophagy, ATDC5 cells were infected with lentivirus expressing ERN1 and subjected to 4 h FFSS in the presence or absence of MHY1485. Results revealed that overexpression of ERN1 suppressed the expression of p-MTOR and p-RPS6, upregulated BECN1 and LC3B-II and promoted chondrocyte autophagy, but downregulated p-EIF2AK3, CASP12 and DDIT3, and inhibited chondrocyte apoptosis induced by FFSS without affecting HSPA5 expression (Figure 7(a-f)). MHY1485 reversed the ERN1-suppressed expression of p-MTOR and p-RPS6, and inhibited autophagy and promoted ERS-apoptosis without affecting HSPA5 expression (Figure 7(d-f)). Interestingly, p-PRKAA1/2 (protein kinase, AMP-activated, alpha 1/2 catalytic subunit) was upregulated in vivo in the 4-week UAC group and in vitro in the 2 h FFSS group (Figure 7(g-i)). Activation of p-PRKAA1/2 by A769662 reversed the suppressing effect of 4μ8C on autophagy (Figure 7(h,i)). These results suggest that p-ERN1 inhibits ERS-apoptosis, but promotes autophagy, through suppressing MTORC1 by the p-PRKAA1/2 (AMPK) pathway.
Inhibition of MTORC1 promotes autophagy and suppresses apoptosis in TMJ chondrocytes stimulated by UAC
We next investigated the effects of inhibiting MTORC1 on UAC-induced chondrocyte autophagy and apoptosis in TMJ cartilage. Rats with 8 wk UAC treatment were injected with rapamycin and vehicle into the TMJ region every other day for 4 and 12 wk. During the njection period the UAC was kept installed. As expected, rapamycin reduced the levels of p-MTOR and p-RPS6 proteins (Figure 8(a-b)), blocked UAC-induced cartilage loss (Figure 8(c,d), Figures S6 and S7(a)), suppressed UAC-stimulated expression of p-EIF2AK3, cleaved CASP3, CASP12, and DDIT3, and inhibited chondrocyte apoptosis as demonstrated by histochemistry staining, TUNEL staining, IHC, IF and western blotting assays (Figure 8(a-c), (e-g), Figure S7(b-c)). It increased the expression levels of BECN1 and LC3B-II, and also increased the colocalization of LC3B-II and LAMP2 without affecting the expression of HSPA5 and ERN1 (Figure 6(a-c), Figure S8).
Figure 8.
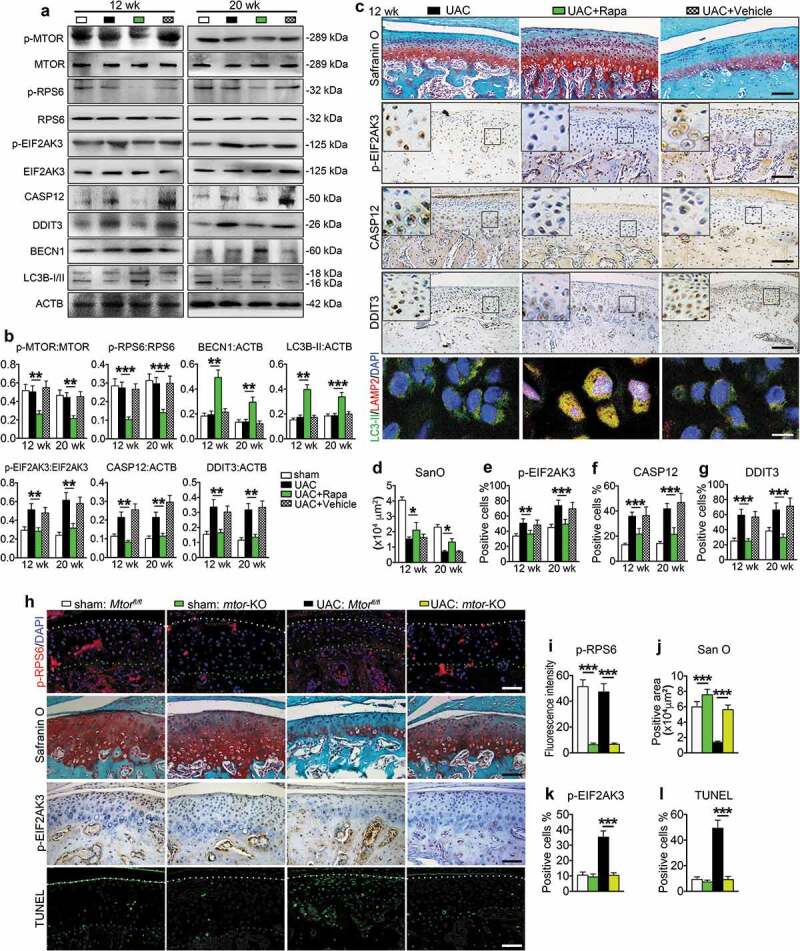
MTORC1 inactivation promotes chondrocyte autophagy, suppresses chondrocyte apoptosis and prevents cartilage loss under UAC. (a and b) Injection of 100 nM MTORC1 inhibitor rapamycin (50 μl, Rapa group) or equal volume PBS (vehicle group) in TMJ region of UAC rats from 8 to 12 wk every other day. The samples were harvested after 4 and 12 wk’ injection. Condylar cartilage was prepared for protein extracts for western blotting and its quantification. (c) Sagittal central sections of the condylar cartilage were subjected to safranin O staining for proteoglycans and the positive areas in each group at 12 wk. IHC staining for expression of the p-EIF2AK3, CASP12 and DDIT3. Black scale bar: 100 μm. IF staining for detecting the autophagosome and lysosome location. LC3B-II, green; LAMP2, red; DAPI, blue. White scale bar: 10 μm. (d-g) Quantitative data of cartilage area and p-EIF2AK3-, CASP12- and DDIT3-positive cells in each group are shown. (h) Cartilage-specific deletion of MTORC1 in chondrocytes. Mice were subjected to UAC or sham surgery for 7 wk and injected with TM as described in the Materials and Methods. IF staining: sagittal central sections of the TMJ were stained with antibody against p-RPS6 (S235/236). p-RPS6, red; DAPI, blue. White dots, superficial of condylar cartilage; Green dots, the border between cartilage and subchondral bone. Safranin O (San O) staining. IHC staining of p-EIF2AK3. TUNEL staining. White dots, superficial of condylar cartilage; Blue dots, the border between cartilage and subchondral bone. Scale bar: 100 μm. (i-l) Quantification for (h). Results are expressed as mean ± standard deviation. Safranin O, TUNEL and IHC staining: N = 6 rats, N = 5 mice. Western blotting and qPCR analysis: N = 3. * P < 0.05, ** P < 0.01 and *** P < 0.001 represent significant differences between the indicated groups.
We further determined the effects of MTORC1 inactivation on UAC-induced chondrocyte autophagy and apoptosis in TMJ cartilage by deleting MTORC1 expression in mice. We bred the Mtorfl/fl mice with the Col2a1-CreER transgenic mice and generated the Mtorfl/fl; Col2a1-CreER mice. To delete MTORC1 expression in chondrocytes, the Mtorfl/fl; Col2a1-CreER mice were treated with tamoxifen (TM) as described in the Materials and Methods. The Cre-negative Mtorfl/fl littermates treated with TM treatment were used as controls. Mutant mice and their control littermates were subjected to UAC for 7 wk or sham operation. Data demonstrated that in sham operation group deletion of MTORC1 reduced the level of p-RPS6 protein in chondrocytes and increased the matrix amount revealed by safranin O staining (Figure 8(h,i)). Results showed that deletion of MTORC1 activated the autophagy program, as demonstrated by increased expression of BECN1 and LC3B-II and the colocalization of LC3B-II and LAMP2 in chondrocytes. However, it did not markedly alter the expression of p-EIF2AK3, cleaved CASP3, CASP12, DDIT3 and the number of TUNEL-positive cells (Figure S9). Deletion of MTORC1 in chondrocytes dramatically reduced the UAC-induced cartilage loss in TMJ at 7 wk. Importantly, deletion of MTORC1 activity significantly decreased the UAC-stimulated increases in the expression levels of p-EIF2AK3, cleaved CASP3, CASP12 and DDIT3 and the numbers of TUNEL-positive cells, but increased the expression levels of BECN1 and LC3B-II proteins in UAC-treated cartilage (Figure 8(h-l), Figure S9).
MTORC1 activation by injection of MHY1485 or genetic deletion of Tsc1 suppresses autophagy and promotes apoptosis in chondrocytes and enhanced TMJ cartilage loss induced by UAC
We next investigated the effects of MTORC1 activation on UAC-induced chondrocyte autophagy and apoptosis in TMJ cartilage. Rats in UAC group were injected with MHY1485 or vehicle into the TMJ region every other day for 2 and 4 wk from day 1 of UAC installation. As expected, MHY1485 increased the levels of p-MTOR and p-RPS6 proteins in UAC-treated rats TMJ cartilage, exacerbated UAC-induced cartilage loss, increased the expression of p-EIF2AK3, cleaved CASP3, CASP12 and DDIT3, and accelerated chondrocyte apoptosis (Figure 9, Figures S10 and S11). It reduced the expression of BECN1 and LC3B-II and inhibited colocalization of LC3B-II and LAMP2 in UAC-treated rats TMJ cartilage (Figure 9(a-c), Figure S12(a-b)) without changing the expression levels of HSPA5 and p-ERN1 (Figure S12(c-e)).
Figure 9.
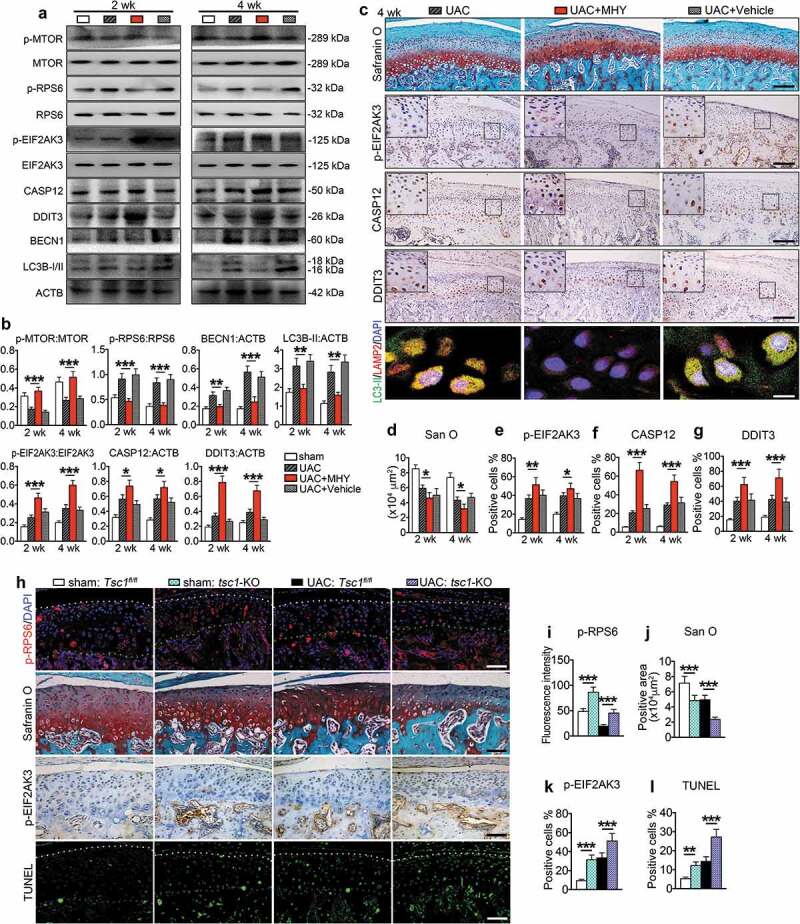
MTORC1 activation by MHY1485 or genetic deletion of Tsc1 suppresses chondrocyte autophagy and promotes chondrocyte apoptosis and TMJ cartilage loss in UAC animals. (a) Fifty μl, 100 nM MHY1485 or equal volume PBS was injected into the TMJ region of mice with UAC surgery from 0 wkto 4 wk. Protein extracts were prepared from the condylar cartilage for western blotting for the expression of p-MTOR, p-RPS6, p-EIF2AK3, CASP12, DDIT3, BECN1 and LC3B-I/II. (b) Quantitative data of (a). (c) Sagittal central sections of the condylar cartilage of each group were subjected to Safranin O staining. IHC staining of p-EIF2AK3, CASP12, and DDIT3. Black scale bar, 100 μm. IF staining for autophagosome and lysosome location. LC3B-II, green; LAMP2, red; DAPI, blue. White scale bar: 10 μm. (d-g) Quantitative data of (C). (h) Deletion of Tsc1 in chondrocytes. Mice were subjected to UAC or sham surgery for 3 wk and injected with TM as described in the Materials and Methods. IF staining: sagittal central sections of the TMJ were stained with antibody against p-RPS6 (S235/236). p-RPS6, red; DAPI, blue. White dots, superficial of condylar cartilage; Green dots, the border between cartilage and subchondral bone. Safranin O staining. IHC staining of p-EIF2AK3. TUNEL staining. White dots, superficial of condylar cartilage; Blue dots, the border between cartilage and subchondral bone. Scale bar: 100 μm. (i-l) Quantitative data for (H). Results are expressed as mean ± standard deviation. IHC staining: N = 6 for rat, N = 5 for mice. Western blotting and qPCR analysis: N = 3. * P < 0.05, ** P < 0.01 and *** P < 0.001 represent significant differences between the indicated groups..
We finally investigated the effects of genetic activation of MTORC1 by deleting the expression of TSC1, an upstream negative regulator of MTORC1, in chondrocytes on UAC-induced TMJ chondrocytes autophagy and apoptosis. To delete TSC1, we bred the Tsc1fl/fl mice with the Col2a1-CreER transgenic mice and generated the Tsc1fl/fl; Col2a1-CreER mice. The Tsc1fl/fl; Col2a1-CreER mice were subjected to UAC for 3 wk or sham operation, and treated with TM as described in the Materials and Methods. Cre-negative Tsc1fl/fl littermates treated with TM were used as controls. As expected, in UAC-sham operation group, deletion of Tsc1 upregulated the level of p-RPS6 protein in chondrocytes, as revealed by immunofluorescence staining (Figure 9(h-i)), increased the expression of p-EIF2AK3, CASP12, DDIT3 and cleaved CASP3, but reduced the expression of BECN1 and LC3B-II, suppressed the colocalization of LC3B-II and LAMP2, and reduced cartilage matrix amount (Figure 9(j-l), Figure S13). In UAC treated group, deletion of Tsc1 reversed the UAC-suppressed p-RPS6 expression, and further upregulated the UAC-stimulated expression of p-EIF2AK3, CASP12, DDIT3 and cleaved CASP3, but reduced UAC-stimulated expression of BECN1 and LC3B-II, and enhanced UAC induced OA-like phenotypes, including dramatic loss of articular cartilage and reduction of proteoglycan amount in TMJ cartilage (Figure 9(j-l), Figure S13).
Discussion
Abnormal biomechanical stimulation is a well-known etiologic factor for OA due to its ability to induce chondrocyte apoptosis [5]. Autophagy is also involved in OA cartilage [39–41]. Switching from autophagy to apoptosis is pivotal in mechanically induced OA progress. In the present study, we determined the functional relationship between ERS-apoptosis and autophagy in dental biomechanically induced TMJ OA cartilage. The ERS-apoptosis was regulated by p-EIF2AK3, a downstreamer of MTORC1, during the entire experimental course (from 2 to 20 wk), while autophagy was modulated by an upstreamer of MTORC1, p-ERN1, which is activated only at early stage (from 2 to 4 wk) of the progressive OA changes, but downregulated at late stage (from 8 wk on). Collectively, these results suggest that MTORC1 signaling plays a pivotal role in switching the protective autophagy to the destructive ERS-apoptosis in the progression of biomechanically induced TMJ OA.
Triggered by a variety of conditions, ERS is a common cellular response [43]. In the present study, we found that ERS in chondrocytes is stimulated by the biomechanical induced Ca2+ overload, which eventually leads to ERS-apoptosis. This ERS-apoptosis was mediated by, at least in part, p-EIF2AK3, which also functioned as a downstreamer of MTORC1. Our combined molecular and biochemical in vitro and in vivo approaches identified that, in addition to inducing ERS-apoptosis, p-EIF2AK3 had a novel function in blocking autophagic flux through the inhibition of autophagosome-lysosome fusion.
The role of MTORC1 activation and its involvement in regulation of apoptosis and autophagy in the pathophysiology of OA cartilage has been reported by several groups [31–34]. In an interleukin-1β activation model it is demonstrated that autophagy regulated the gene expression related to OA lesions through modulation of apoptosis [44]. Knockdown of ERN1 expression by the way of RNAi approach accelerates ERS-mediated apoptosis [45], while genetic deletion of MTORC1 rescue the OA phenotype in mice induced by the destabilization of medial meniscus and accelerate by deletion of PPARG (peroxisome proliferator activated receptor gamma) [46]. Based on our findings and these published reports, and also the study on the role of ERN1-XBP1 in the pathology of Schmid metaphyseal chondrodysplasia [47], we currently proposed a working model (Figure 10). First, normal physiological biomechanical forces induced calcium overload in ER, which led to up-regulation of HSPA5 and ERS in chondrocytes. Then, chondrocytes coped with the ERS by activating unfolded protein response (UPR) and subsequently upregulating the expression of ERN1, EIF2AK3 and ATF6 to reestablish a normal ER homeostasis. In the presence of abnormal mechanical loadings generated by UAC or FFSS, a proper ER homeostasis can not be restored. Under these conditions, p-ERN1-mediated autophagy and p-EIF2AK3-mediated ERS-apoptosis were simultaneously activated. However, p-ERN1 signaling reduced with time. That activated the MTORC1 pathway, leading to not only suppression of autophagosome formation but also enhancement of ERS-apoptosis by promoting the phosphorylation of EIF2AK3. The accumulation of p-EIF2AK3 impaired the autophagosome-lysosome fusion as we described above. That means the reduction of ERN1 signaling released MTORC1 that switched the protective autophagy to pro-death ERS-apoptosis program in chondrocytes, leading to progression of OA. Thus, activation of p-ERN1 or inhibition of MTORC1 as we observed in early stage of UAC or FFSS, was critical in promoting autophagic flux and constraining p-EIF2AK3-mediated ERS-apoptosis and p-EIF2AK3-suppressed autophagic flux to favor chondrocyte survival. In contrast, failure to activate ERN1 led to MTORC1 activation and eventually enhanced chondrocyte apoptosis. Such a role of MTORC1 in switching protective autophagy to ERS-apoptosis in chondrocytes during the progressive OA cartilage complemented the notion that autophagy is involved in both pro-survival and pro-death programs [25,48]. This revealed function of ERN1-MTORC1-EIF2AK3 signaling in chondrocytes provided one explanation for why autophagy is suppressed in the progressed OA cartilage [49–51]. Inhibition of MTORC1 signaling prevented OA cartilage loss by at least two potential mechanisms, i.e., upregulation of LC3B-II and BECN 1 led to autophagy and downregulation of p-EIF2AK3 blocked the autophagic flux and promoted ERS-apoptosis.
Figure 10.
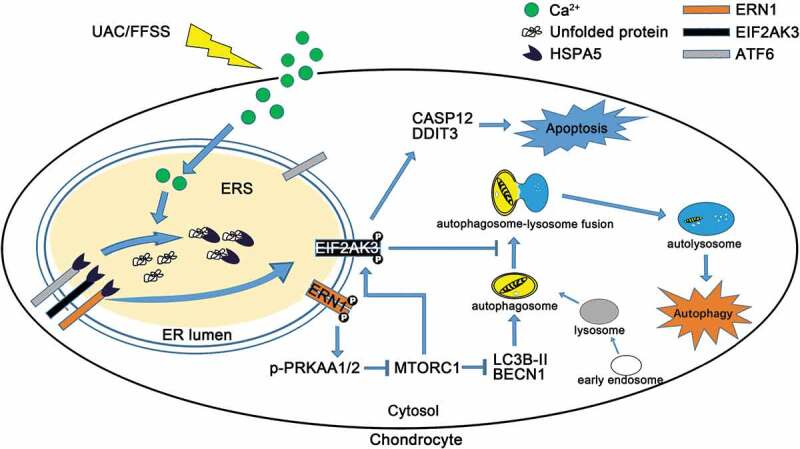
A working model showing that the role of MTORC1 in the cross-talk between ERS-apoptosis and autophagic flux. UAC-FFSS induces calcium overload, and promotes the ERS by upregulating the p-EIF2AK3 and p-ERN1. Autophagic flux is initiated by the ERN1-MTORC1 signal and ERS-apoptosis is induced by MTORC1-EIF2AK3 in chondrocytes. MTORC1, downstream of p-ERN1-p-PRKAA1/2 (AMPK), switches autophagy to ERS-apoptosis of the chondrocytes in response to prolonged aberrant biomechanical loadings by upregulating p-EIF2AK3, which promotes the expression of CASP12 and DDIT3 that leads to apoptosis and suppresses autophagy by suppressing autophagosome-lysosome fusion.
The results of the present study shed a light on therapeutic strategy of protecting articular chondrocytes in biomechanically stimulated OA cartilage. We previously reported that early elimination of UAC promotes restoration of degenerated condyle in rats [52]. Then, early elimination of aberrant biomechanical factors is critical for reversing OA progression. However, in clinic, this is not always practical due to difficulty to identify and/or eliminate those etiological factors. In that case, it is likely that agents that act on signals of p-ERN1 or MTORC1, such as rapamycin, can be used to suppress the ERS-apoptosis and activate the protective autophagy program especially when aberrant biomechanical factor(s) persists.
In summary, results of the present study bring a new insight into the role of MTORC1 in switching protective autophagy mediated by LC3B-II to degradative ERS-apoptosis of the chondrocytes mediated by p-EIF2AK3 in response to the prolonged aberrant biomechanical loadings. In addition to promoting apoptosis by increasing the expression of CASP12 and DDIT3, activated p-EIF2AK3 also suppresses autophagy by inhibiting the autophagosome-lysosome formation. The results of the present study provide a potential therapeutic target for OA by intervention of the ERN1-MTORC1-EIF2AK3 signaling.
Materials and methods
Animals, UAC model and TMJ injection
We crossed the Col2a1-CreER mice to the Mtorfl/fl mice and obtained the Mtorfl/fl; Col2a1-CreER mice [53]. At 6-weeks of age, the Mtorfl/fl; Col2a1-CreER mice were treated with tamoxifen (TM) (Sigma-Aldrich, T5648; 0.1 mg/g of body weight, 5 consecutive daily intraperitoneal injections from 1 d before the UAC surgery) to create the chondrocyte-selective conditional knockout mice. The Mtorfl/fl littermates generated from breeding treated with tamoxifen (TM) were used as controls. Using a similar strategy, we generated the chondrocyte-specific conditional Tsc1 knockout mice. The Tsc1fl/fl littermates generated from breeding treated with TM were used as controls [54]. The mtor-KO or tsc1-KO and their control littermates were subjected to UAC or sham surgery for 7 wk or 3 wk, respectively.
Female Sprague-Dawley (SD) rats (108, 6-weeks old, weight 140–160 g) were provided by the animal center of the Fourth Military Medical University in Xi’an, China. The animal care and all procedures were performed according to institutional guidelines and were approved by the Ethics Committee of the Fourth Military Medical University. All surgeries were performed under sodium pentobarbital anesthesia, and all efforts were made to minimize suffering. Sixty rats were equally divided into 2 groups (sham and UAC) and 5 time-points (2, 4, 8, 12 and 20 wk). Forty-eight rats were equally divided into 4 injection groups (MHY1485 or rapamycin and vehicle of MHY1485 or vehicle of rapamycin), and 4 time-points (started at 0 to 2 or 4 wk for MHY1485, started at 8 wk to 12 or 20 wk for rapamycin). Every group has 6 animals which were euthanized at the corresponding time points, respectively. UAC operation was applied to the rats of UAC groups and injection groups as we previously described [8,9]. The technique of the TMJ area local injection followed our previous report [8]. After UAC stimulation, rats were laid sidelong after deep anesthesia with intraperitoneal 1% sodium pentobarbital. The needle with a specially made Hamilton-type syringe was inserted just below the zygomatic arch between the corner of the eye and ear until the outer surface of the mandibular ramus was reached. The orientation of the needle head was adjusted to allow it to go along the bone wall and finally reach the TMJ region. Fifty μl of 100 nM rapamycin (Selleck, S1039) or 100 nM MHY1485 (Selleck, S7811) were diluted in PBS (Cell Signaling Technology, 9872) and injected locally into the right or left TMJ areas of the injection groups every other day. The same volume of PBS was injected similarly into the TMJ areas bilaterally in vehicle groups.
Tissue sampling and preparation
Pentobarbital overdose were provided to euthanize all rats, and the TMJs were sampled after 2, 4, 8, 12 or 20 wk of UAC stimulation (N = 6). Rats of MHY1485, rapamycin or vehicle treated groups were sampled at 2 and 4 wk or 12 and 20 wk (N = 6) according to the experimental design. Similar to our previous study [5,9], there were no significant differences between the left and right sides samples in the histomorphology or molecular properties. Six TMJs from the left side of each group were sampled for histochemical, safranin O (Sigma-Aldrich, S8884), immunohistochemical and TUNEL staining (N = 6). Six right TMJs from each group were divided into 3 separate samples and were used for mRNA analysis using qPCR assays and protein levels by western blotting (N = 3). For morphological and immunohistochemical analysis, the tissue blocks were embedded in paraffin after fixed in 4% paraformaldehyde for 24 h and decalcified in 10% EDTA (Sigma-Aldrich, 798681) for 4 wk. A serial of 4-μm-thick sections through the TMJ in the sagittal plane was mounted onto poly-L-lysine-coated glass slides (Leica, RM2135, Wetzlar, Germany). To ensure a reliable comparison between the specimens from different groups, the central sagittal sections of each joint were selected. To ensure that the technical parameters of each stain were identical and that the results were comparable between groups, the sections from each group for one type of staining were stained at the same time. For western blot and qPCR analysis for molecules, the cartilage was carefully isolated without subchondral bone and preserved at −80°C for protein or mRNA preparation.
Histomorphology and immunohistochemical staining
The serial sections were stained with hematoxylin and eosin (H/E) and safranin O as previously reported [4] in order to observe histological and proteoglycan changes in the articular cartilage. IHC was performed by an avidin-biotin complex (ABC) staining. In brief, after deparaffinization, hydration and blockage of endogenous peroxidase, the specimens were incubated with 5% goat serum to block special sites and then individually incubated with the following primary antibodies: rabbit anti-p-RPS6 (S235/236) (Cell Signaling Technology, 4858), rabbit anti-HSPA5 antibody (Abcam, ab108613), rabbit anti-p-EIF2AK3 antibody (Santa Cruz Biotechnology, sc32577), rabbit anti-p-ERN1 (phospho-S724) antibody (Abcam, ab48187), rabbit anti-phospho-PRKAA1/2 antibody (Cell Signaling Technology, 2535), rabbit anti-DDIT3 antibody (Abcam, ab179823), goat anti-CASP12 antibody (Santa Cruz Biotechnology, sc12395), rabbit anti-cleaved CASP3 antibody (Sigma-Aldrich, C8487), rabbit anti-BECN1 antibody (Santa Cruz Biotechnology, sc11427) and rabbit anti-LC3B-II antibody (Santa Cruz Biotechnology, sc28266). After rinsing, the sections were incubated with biotinylated conjugated goat anti-rabbit or donkey anti-goat secondary antibody, and then incubated with 3,3-diaminobenzidine tetrahydrochloride (DAB) substrate for 10 s to 2 min for different antibodies. Sections were mounted with balsam after being dehydrated in serial alcohol solutions. Images were acquired using a Leica DFC490 system under a light microscope (Leica, DM 2500, Wetzlar, Germany). Cell counting, thickness measurement, staining intensity in the cytoplasm and the percentage of immune-positive chondrocytes were performed twice in a blinded fashion, over an interval of 1 wk, by 2 independent observers with no knowledge of the group of origin. The mean of the 2 measurements was used for further statistical analysis.
Cell culture and fluid flow shear stress (FFSS)
ATDC5, a cell line of mouse chondrocytes, were cultured and treated for in vitro experiment. Cells were collected and planted on Flexcell StreamerTM Culture Slips (1-mm thick) (Flexcell, CS-C) coated with collagen I in DMEM-F12 medium (Hyclone, SH30023) with 10% (v:v) fetal bovine serum (FBS) (Gibco, 10099–141), 100 mg/ml streptomycin and 100 U/ml penicillin (Hyclone, SV30010) at 37°C with 5% CO2 in a humidified incubator. The medium was replaced every 2 d, and the cells reached 80% confluence after approximately 2 d in culture. The fluid flow shear stress was applied using a Flexcell FX-4000 strain unit (Flexcell, FX4000, Burlington, Ontario, Canada) with loading of 24 dyne/cm2 for 1, 2 and 4 h. Cells without FFSS applying were used as control. The cells were treated with thapsigargin (Abcam, ab120286), rapamycin (Selleck, S1039), MHY1485 (Selleck, S7811), GSK2606414 (Selleck, S7307) or lentiviral transfected chondrocytes in another group were treated with 24 dyne/cm2 FFSS for 1, 2 or 4 h.
Extracellular environment has an effect on the chondrocyte ERS and cell differentiation [55]. High concentration of serum (e.g., 20%) was reported to promote chondrocyte differentiation and stress [56]. We used 10% FBS (Gibco, 10099–141) or ITS (Cyagen, ITSS-10201–5) culture medium in the present study. No marked differences in the FFSS stimulated ERS-apoptosis and autophagy were observed in chondrocytes cultured in media containing 10% FBS (Figure S14).
RNA transfection
The cell line grown to 50% confluence on Culture Slips were transfected with ERN1 activation sequence using lentiviral transfection reagent (Santa Cruz Biotechnology, sc-429758-LAC) according to the manufacturer’s instructions. ERN1 Lentiviral Activation Particles contain the following synergistic activation mediator (SAM) activation elements: a deactivated Cas9 (dCas9) nuclease (D10A and N863A) fused to the transactivation domain VP64, an MS2-p65-HSF1 fusion protein, and a target-specific 20 nt guide RNA (GeCKO (v2), Feng Zhang lab, 1000000048). They also contain blasticidin, hygromycin and puromycin resistance genes. The resulting SAM complex provides a robust transcription activation system for the upregulation of Ern1. After that the transfection, cultured cells were replaced with DMEM-F12 contained 10% FBS. All the experiments were carried out after transfection.
Cell viability assay
After pretreatment of OA chondrocytes (6x10³/well) with rapamycin or MHY1485 (25–500 nM, 2 h), chondrocytes were incubated with 20 ml of 0.5% MTT for 4 h (Roche, 11465007001). The supernatant was removed and 150 µl of DMSO (Sigma-Aldrich, D2650) was added. Absorbance at 490nm was measured using the Synergy H4 Multimode Plate reader (Bio-Tek instruments, Winooski, VT, USA).
Autolysosome turnover assay
The estimation of autophagic flux is important to distinguish increased autophagosome formation from impaired degradation. To measure autophagic flux, cells were incubated with the indicated drugs in the presence or absence of the inhibitor bafilomycin A1 (Abcam, ab120497) to prevent lysosomal acidification, followed by western blot analysis and immunofluorescence staining using mouse anti-LC3B-II (Cell Signaling Technology, 83506) and rabbit anti-LAMP2 (Abcam, ab125068) antibody.
TUNEL staining
Apoptotic cells were assessed by terminal deoxynucleotidyl transferase-mediated deoxyuridine triphosphate nick-end labeling (TUNEL) staining with the in situ cell death detection kit (Roche, 11684795910) following the manufacturer’s protocol. After being incubated with proteinase K, TUNEL reaction mixture solution was added at 37°C for 1 h; the samples were examined in the dark using a laser scanning confocal microscope (Olympus, BX-60, Tokyo, Japan). Positive and negative controls were incubated with 0.01 mg/ml bovine pancreatic DNase I (Sigma-Aldrich, 10104159001) or labeling solution, respectively. The percentage of TUNEL-positive cells was calculated from the number of total cells through a software (Olympus, FV1000, Tokyo, Japan).
Transmission electron microscopy
Primary chondrocytes harvested after FFSS treatment were fixed in 2.5% glutaraldehyde in phosphate buffer (0.01 M, pH = 7.4). After being rinsed with phosphate buffer, the samples were post-fixed in 1% osmium tetroxide for 1 h, rinsed with water, dehydrated in a graded series of ethanol followed by propylene oxide and kept overnight in Epon812 (Sigma-Aldrich, 45,347). The samples were embedded in Epon812 and cured in an oven at 60℃. Ultrathin sections were obtained with a Reichert Ultracut E microtome. The sections were stained with uranyl acetate and lead citrate and observed using a transmission electron microscope (Hitachi, H-600, Tokyo, Japan). For each group, at least 100 cells from randomly chosen transmission electron microscopy fields were observed.
Total RNA extraction and quantitative real-time PCR analysis
Total RNAs from rats’ condylar cartilage (N = 3) and primary chondrocytes (N = 3) were isolated by Tripure Isolation Reagent (Roche, 11667165001). The purity of the obtained total RNA was separated by northern blotting and revealed that there was no degradation and no genome contamination (Figure S15, Table S1, Table S2). cDNA was reverse-transcribed with PrimeScriptTM RT reagent Kit Perfect Real Time (TaKaRa Biotechnology, RR036A). SYBR@ Premix Ex TagTM II (TaKaRa Biotechnology, RR820A) was used to perform quantitative real-time PCR (qPCR) analysis with a Bio-rad real-time PCR system (Biorad, CFX96, Hercules, CA, USA) at the manufacturer’s recommendatory conditions. The details of the purity of the PCR melt curve are represented in Figure S16. The mRNA expression was normalized to Gapdh and calculated using the the formula 2−ΔΔCt. The primers used are shown in Table 1, Table S3 for rat and Table 2, Table S4 for mouse.
Table 1.
Rat gene primers.
| Genes | Forward primer | Reverse primer |
|---|---|---|
| Hspa5 | TCAGCCCACCGTAACAATCAAG | TCCAGTCAGATCAAATGTACCCAGA |
| Eif2ak3 | CCAAGCTGTACATGAGCCCAGA | TTTCTGAGTGAACAGTGGTGGAAAC |
| Arf6 | ATCACCTGCTATTACCAGCTACCAC | TGACCTGACAGTCAATCTGCATC |
| Ern1 | CATCACCATGTATGACACCAAGACC | TGTCCACAGTTACCACCAGTCCA |
| Ddit3 | TGGAAGCCTGGTATGAGGATCTG | GAGGTGCTTGTGACCTCTGCTG |
| Casp12 | CAATTCCGACAAACAGCTGAGTTTA | CATGGGCCACTCCAACATTTAC |
| Gapdh | GGCACAGTCAAGGCTGAGAATG | ATGGTGGTGAAGACGCCAGTA |
Table 2.
Mouse gene primers.
| Genes | Forward primer | Reverse primer |
|---|---|---|
| Hspa5 | TGCGGCCAAGAACCAACTC | AATGTCTTGGTTTGCCCACCTC |
| Eif2ak3 | GTACTGACTCCAATGCCAGCCTA | CATCTGGGTGCTGAATGGGTA |
| Atf6 | AGTCCCAAGTCCAAAGCGAAGA | CTGATTGGCAGGGCTCACACTA |
| Ern1 | TGCGCAAATTCAGAACCTACAAAG | AGTGAAGTAGCGCACAAAGTCATCC |
| Ddit3 | TCACACGCACATCCCAAAG | ACTGACCACTCTGTTTCCGTTTC |
| Casp12 | CTGGCTCTCATCATCTGCAACAA | CGGCCAGCAAACTGCATTAAC |
| Gapdh | TGTGTCCGTCGTGGATCTGA | TTGCTGTTGAAGTCGCAGGAG |
Western blotting
Condylar cartilage tissues were smashed into powder using our developed metal device in liquid nitrogen, and cells were lysis with Tripure Isolation Reagent (Roche, 11667165001). After centrifugation at 12,000 g for 10 min, the protein was isolated from the red organic phase by alcohol precipitation steps. Resuspend each protein pellet with 0.3 M guanidine hydrochloride in 95% ethanol and dissolve in 1% sodium dodecyl sulphate (SDS), and the protein content of the lysates was determined using a Bicinchoninic Acid Kit for protein determination (Pierce Rockford, 23225) with BSA as the standard. Cell lysates were adjusted to identical equals of protein and then were applied to SDS-polyacrylamide gels (10%–15%) for electrophoresis. Next, the proteins were electroblotted onto polyvinylidene fluoride membranes. After the membranes were blocked in 10 mM Tris-buffered saline containing 0.1% Tween-20 (TBS-T) (Sigma-Aldrich, SRE0031) and 5% skimmed milk, the membranes were probed for 1.5 h with the respective primary antibodies in TBS-T: rabbit anti-HSPA5 antibody (Abcam, ab108613), rabbit anti-p-EIF2AK3 antibody (Santa Cruz Biotechnology, sc32577), goat anti-EIF2AK3 antibody (Santa Cruz Biotechnology, sc9477), rabbit anti-p-ERN1 (phosphor S724) antibody (Abcam, ab48187), anti-ERN1 antibody (Abcam, ab37073), rabbit anti-DDIT3 antibody (Abcam, ab179823), goat anti-CASP12 antibody (Santa Cruz Biotechnology, sc12395), rabbit anti-p-MTOR antibody (Cell Signaling Technology, 5536), rabbit anti-p-RPS6 antibody (Cell Signaling Technology, 4858), mouse anti-RPS6 (Santa Cruz Biotechnology, sc74459), rabbit anti-phospho-PRKAA1/2 antibody (Cell Signaling Technology, 2535), rabbit anti-PRKAA antibody (Cell Signaling Technology, 2603), rabbit anti-BECN1 antibody (Santa Cruz Biotechnology, sc11427), rabbit anti-LC3B-II antibody (Santa Cruz Biotechnology, sc28266), rabbit anti-LAMP2 (Abcam, ab125068), mouse anti-SQSTM1 (Abcam, ab56416) and mouse anti-ACTB (Zhuangzhi Inc., NC010). After washing the membranes with TBS-T, the membranes were incubated with horseradish peroxidase-conjugated goat anti-rabbit (Zhuangzhi Inc., EK020), goat anti-mouse (Zhuangzhi Inc., EK010) or donkey anti-goat IgG (Zhuangzhi Inc., EK030) at 37°C for 1 h. Subsequently, by further washing with TBS-T, protein bands were visualized with an enhanced chemiluminescence system using a Bio-Rad Chemidoc Apparatus (Biorad, XRS, Hercules, CA, USA).
Statistical analysis
Statistical analysis was accomplished using the SPSS 21.0 software (SPSS Inc, IL, USA). All data acquisition and analysis were completed blindly. Data were expressed as means ± standard deviation (means ± SD) for each group. A Kolmogorov-Smirnov test was performed to evaluate Gaussian distribution of the data (all P > 0.1). Fisher test was used to assess homogeneity of variance. The percentages of degraded cartilage areas were compared by using the non-parametric KruskaleWallis test and ManneWhitney U test. Unpaired Student’s t-test was used to compare data from two groups if the homogeneity of variance was consistent; Satterthwaite’s t-test was used if the homogeneity of variance was not equal. For multiple comparisons of three or more groups, one-way analysis of variance with Tukey’s post hoc test was used. Statistical power was calculated by G*power 3.1 software (Heinrich-Heine University Duesseldorf, Germany). P values less than 0.05 were considered to be statistically significant in all cases.
Funding Statement
This work was supported by the National Natural Science Foundation of China under grants (81530033, 81500875, 81500896, 81371166, 81630066, 81700995, 81472049, and 81870532), the Guangdong Provincial Science and Technology Innovation Council Grant (2017B030301018).
Acknowledgments
We thank Prof. Wenhan Chang, Department of Veterans Affairs Medical Center and Department of Medicine, University of California San Francisco, for the Col2a1-CreER mice as a gift. Mtorfl/fl mice were kindly provided by Prof. Minsheng Zhu from Center of Model Animal Research at Nanjing University. We thank Shujing Cai for assistance in tissue section preparation. We thank Yishi Wang from Department of physiology and pathophysiology, Fourth Military Medical University for assistance in the background of related cell research.
Disclosure statement
No potential conflict of interest was reported by the authors.
Supplementary material
Supplemental data for this article can be accessed here.
References
- [1].Glyn-Jones S, Palmer AJ, Agricola R, et al. Osteoarthritis. Lancet. 2015;386(9991):376–387. PMID: 25748615. [DOI] [PubMed] [Google Scholar]
- [2].Bijlsma JW, Berenbaum F, Lafeber FP.. Osteoarthritis: an update with relevance for clinical practice. Lancet. 2011;377(9783):2115–2126. PMID: 21684382. [DOI] [PubMed] [Google Scholar]
- [3].Caramés B, Taniguchi N, Seino D, et al. Mechanical injury suppresses autophagy regulators and pharmacologic activation of autophagy results in chondroprotection. Arthritis Rheum. 2012;64(4):1182–1192. PMID: 22034068. [DOI] [PMC free article] [PubMed] [Google Scholar]
- [4].Scrivani SJ, Keith DA, Kaban LB.. Temporomandibular disorders. N Engl J Med. 2008;359(25):2693–2705. PMID: 19092154. [DOI] [PubMed] [Google Scholar]
- [5].Zhang M, Yang H, Lu L, et al. Matrix replenishing by BMSCs is beneficial for osteoarthritic temporomandiblar joint cartilage. Osteoarthritis Cartilage. 2017;25(9):1551–1562. PMID: 28532603. [DOI] [PubMed] [Google Scholar]
- [6].Liu Q, Yang HX, Wan XH, et al. Calcium-/calmodulin-dependent protein kinase II in occlusion-induced degenerative cartilage of rat mandibular condyle. J Oral Rehabil. 2018. March 30. Epub ahead of print. DOI: 10.1111/joor.12629. PMID: 29603329. [DOI] [PubMed] [Google Scholar]
- [7].Zhang J, Zhang HY, Zhang M, et al. Connexin43 hemichannels mediate small molecule exchange between chondrocytes and matrix in biomechanically-stimulated temporomandibular joint cartilage. Osteoarthritis Cartilage. 2014;22(6):822–830. PMID: 24704497 PMCID: PMC4706739. [DOI] [PMC free article] [PubMed] [Google Scholar]
- [8].Yang H, Zhang M, Wang X, et al. TNF accelerates death of mandibular condyle chondrocytes in rats with biomechanical stimulation-induced temporomandibular joint disease. PLoS ONE. 2015;10(11):e0141774. PMID: 26529096 PMCID: PMC4631347. [DOI] [PMC free article] [PubMed] [Google Scholar]
- [9].Zhang M, Wang H, Zhang J, et al. Unilateral anterior crossbite induces aberrant mineral deposition in degenerative temporomandibular cartilage in rats. Osteoarthritis Cartilage. 2016;24(5):921–931. PMID: 26746151 PMCID: PMC5699887. [DOI] [PMC free article] [PubMed] [Google Scholar]
- [10].Liu YD, Yang HX, Liao LF, et al. Systemic administration of strontium or NBD peptide ameliorates early stage cartilage degradation of mouse mandibular condyles. Osteoarthritis Cartilage. 2016;24(1):178–187. PMID: 26256766 PMCID: PMC4695290. [DOI] [PMC free article] [PubMed] [Google Scholar]
- [11].Lu L, Huang J, Zhang X, et al. Changes of temporomandibular joint and semaphorin 4D/Plexin-B1 expression in a mouse model of incisor malocclusion. J Oral Facial Pain Headache. 2014;28(1):68–79. PMID: 24482790. [DOI] [PubMed] [Google Scholar]
- [12].Liu Z, Lv Y, Zhao N, et al. Protein kinase R-like ER kinase and its role in endoplasmic reticulum stress-decided cell fate. Cell Death Dis. 2015;6:e1822. PMID: 26225772 PMCID: PMC4650730. [DOI] [PMC free article] [PubMed] [Google Scholar]
- [13].Zhang KZ, Kaufman RJ. From endoplasmic-reticulum stress to the inflammatory response. Nature. 2008;454(7203):455–462. PMID: 18650916 PMCID: PMC2727659. [DOI] [PMC free article] [PubMed] [Google Scholar]
- [14].Wang M, Kaufman RJ. Protein misfolding in the endoplasmic reticulum as a conduit to human disease. Nature. 2016;529(7586): 326–335. PMID: 26791723. [DOI] [PubMed] [Google Scholar]
- [15].Hetz C, Martinon F, Rodriguez D, et al. The unfolded protein response: integrating stress signals through the stress sensor IRE1α. Physiol Rev. 2011;91(4):1219–1243. PMID: 22013210. [DOI] [PubMed] [Google Scholar]
- [16].Cerezo M, Rocchi S. New anti-cancer molecules targeting HSPA5/BIP to induce endoplasmic reticulum stress, autophagy and apoptosis. Autophagy. 2017;13(1):216–217. PMID: 27791469 PMCID: PMC5240825. [DOI] [PMC free article] [PubMed] [Google Scholar]
- [17].Kim I, Xu W, Reed JC. Cell death and endoplasmic reticulum stress: disease relevance and therapeutic opportunities. Nat Rev Drug Discov. 2008;7(12):1013–1030. PMID: 19043451. [DOI] [PubMed] [Google Scholar]
- [18].Cameron TL, Gresshoff IL, Bell KM, et al. Cartilage-specific ablation of XBP1 signaling in mouse results in a chondrodysplasia characterized by reduced chondrocyte proliferation and delayed cartilage maturation and mineralization. Osteoarthritis Cartilage. 2015;23(4):661–670. PMID: 25600960. [DOI] [PubMed] [Google Scholar]
- [19].Hetz C. The unfolded protein response: controlling cell fate decisions under ER stress and beyond. Nat Rev Mol Cell Biol. 2012;13(2):89–102. PMID: 22251901. [DOI] [PubMed] [Google Scholar]
- [20].Matsumoto H, Miyazaki S, Matsuyama S, et al. Selection of autophagy or apoptosis in cells exposed to ER-stress depends on ATF4 expression pattern with or without CHOP expression. Biol Open. 2013;2(10):1084–1090. PMID: 24167719 PMCID: PMC3798192. [DOI] [PMC free article] [PubMed] [Google Scholar]
- [21].Uehara Y, Hirose J, Yamabe S, et al. Endoplasmic reticulum stress-induced apoptosis contributes to articular cartilage degeneration via C/EBP homologous protein. Osteoarthritis Cartilage. 2014;22(7):1007–1017. PMID: 24795271. [DOI] [PubMed] [Google Scholar]
- [22].Shen C, Gu W, Cai GQ, et al. Autophagy protects meniscal cells from glucocorticoids-induced apoptosis via inositol trisphosphate receptor signaling. Apoptosis. 2015;20(9):1176–1186. PMID: 26108728. [DOI] [PubMed] [Google Scholar]
- [23].Levine B, Kroemer G. Autophagy in the pathogenesis of disease. Cell. 2008;132(1):27–42. PMID: 18191218 PMCID: PMC2696814. [DOI] [PMC free article] [PubMed] [Google Scholar]
- [24].Cheng NT, Guo A, Meng H. The protective role of autophagy in experimental osteoarthritis, and the therapeutic effects of Torin 1 on osteoarthritis by activating autophagy. BMC Musculoskelet Disord. 2016;17:150. PMID: 27052304 PMCID: PMC4823842. [DOI] [PMC free article] [PubMed] [Google Scholar]
- [25].Lin NY, Beyer C, Giessl A, et al. Autophagy regulates TNFα-mediated joint destruction in experimental arthritis. Ann Rheum Dis. 2013;72(5):761–768. PMID: 22975756. [DOI] [PubMed] [Google Scholar]
- [26].Wirawan E, Vande Walle L, Kersse K, et al. Caspase-mediated cleavage of Beclin-1 inactivates Beclin-1-induced autophagy and enhances apoptosis by promoting the release of proapoptotic factors from mitochondria. Cell Death Dis. 2010;1:e18. PMID: 21364619 PMCID: PMC3032505 [DOI] [PMC free article] [PubMed] [Google Scholar]
- [27].Caramés B, Taniguchi N, Otsuki S, et al. Autophagy is a protective mechanism in normal cartilage, and its aging-related loss is linked with cell death and osteoarthritis. Arthritis Rheum. 2010;62(3):791–801. PMID: 20187128 PMCID: PMC2838960. [DOI] [PMC free article] [PubMed] [Google Scholar]
- [28].Jeon H, Im GI. Autophagy in osteoarthritis. Connect Tissue Res. 2017;58(6):497–508. PMID: 27668694. [DOI] [PubMed] [Google Scholar]
- [29].Zaglia T, Milan G, Ruhs A, et al. Atrogin-1 deficiency promotes cardiomyopathy and premature death via impaired autophagy. J Clin Invest. 2014;124(6):2410–2424. PMID: 24789905 PMCID: PMC4038560. [DOI] [PMC free article] [PubMed] [Google Scholar]
- [30].Komatsu M, Ichimura Y. Physiological significance of selective degradation of p62 by autophagy. FEBS Lett. 2010;584(7):1374–1378. PMID: 20153326. [DOI] [PubMed] [Google Scholar]
- [31].Caramés B, Hasegawa A, Taniguchi N, et al. Autophagy activation by rapamycin reduces severity of experimental osteoarthritis. Ann Rheum Dis. 2012;71(4):575–581. PMID: 22084394 PMCID: PMC3294168. [DOI] [PMC free article] [PubMed] [Google Scholar]
- [32].Zhang Y, Vasheghani F, Li YH, et al. Cartilage-specific deletion of mTOR upregulates autophagy and protects mice from osteoarthritis. Ann Rheum Dis. 2015;74(7):1432–1440. PMID: 24651621. [DOI] [PubMed] [Google Scholar]
- [33].Ito M, Yurube T, Kakutani K, et al. Selective interference of mTORC1/RAPTOR protects against human disc cellular apoptosis, senescence, and extracellular matrix catabolism with Akt and autophagy induction. Osteoarthritis Cartilage. 2017;25(12):2134–2146. PMID: 28888905. [DOI] [PubMed] [Google Scholar]
- [34].Takayama K, Kawakami Y, Kobayashi M, et al. Local intra-articular injection of rapamycin delays articular cartilage degeneration in a murine model of osteoarthritis. Arthritis Res Ther. 2014;16(6):482. PMID: 25403236 PMCID: PMC4269094. [DOI] [PMC free article] [PubMed] [Google Scholar]
- [35].Jiang LB, Lee S, Wang Y, et al. Adipose-derived stem cells induce autophagic activation and inhibit catabolic response to pro-inflammatory cytokines in rat chondrocytes. Osteoarthritis Cartilage. 2016;24(6):1071–1081. PMID: 26778531. [DOI] [PubMed] [Google Scholar]
- [36].Guo FJ, Xiong Z, Lu X, et al. ATF6 upregulates XBP1S and inhibits ER stress-mediated apoptosis in osteoarthritis cartilage. Cell Signal. 2014;26(2):332–342. PMID: 24269637. [DOI] [PubMed] [Google Scholar]
- [37].Musumeci G, Castrogiovanni P, Trovato FM, et al. Biomarkers of chondrocyte apoptosis and autophagy in osteoarthritis. Int J Mol Sci. 2015;16(9):20560–20575. PMID: 26334269 PMCID: PMC4613218. [DOI] [PMC free article] [PubMed] [Google Scholar]
- [38].Caramés B, Olmer M, Kiosses WB, et al. The relationship of autophagy defects to cartilage damage during joint aging in a mouse model. Arthritis Rheumatol. 2015;67(6):1568–1576. PMID: 25708836 PMCID: PMC4446178. [DOI] [PMC free article] [PubMed] [Google Scholar]
- [39].Dai Y, Hu S. Recent insights into the role of autophagy in the pathogenesis of rheumatoid arthritis. Rheumatology (Oxford). 2016;55(3):403–410. PMID: 26342228. [DOI] [PubMed] [Google Scholar]
- [40].Shen C, Cai GQ, Peng JP, et al. Autophagy protects chondrocytes from glucocorticoids-induced apoptosis via ROS/Akt/FOXO3 signaling. Osteoarthritis Cartilage. 2015;23(12):2279–2287. PMID: 26165503. [DOI] [PubMed] [Google Scholar]
- [41].Almonte-Becerril M, Navarro-Garcia F, Gonzalez-Robles A, et al. Cell death of chondrocytes is a combination between apoptosis and autophagy during the pathogenesis of Osteoarthritis within an experimental model. Apoptosis. 2010;15(5):631–638. PMID: 20091349. [DOI] [PubMed] [Google Scholar]
- [42].Chang J, Wang W, Zhang H, et al. The dual role of autophagy in chondrocyte responses in the pathogenesis of articular cartilage degeneration in osteoarthritis. Int J Mol Med. 2013;32(6):1311–1318. PMID: 24126970. [DOI] [PubMed] [Google Scholar]
- [43].Clarke R, Cook KL, Hu R, et al. Endoplasmic reticulum stress, the unfolded protein response, autophagy, and the integrated regulation of breast cancer cell fate. Cancer Res. 2012;72(6):1321–1331. PMID: 22422988 PMCID: PMC3313080. [DOI] [PMC free article] [PubMed] [Google Scholar]
- [44].Sasaki H, Takayama K, Matsushita T, et al. Autophagy modulates osteoarthritis-related gene expression in human chondrocytes. Arthritis Rheum. 2012;64(6):1920–1928. PMID: 22147463. [DOI] [PubMed] [Google Scholar]
- [45].Han X, Zhou J, Zhang P, et al. IRE1α dissociates with BiP and inhibits ER stress-mediated apoptosis in cartilage development. Cell Signal. 2013;25(11):2136–2146. PMID: 23816533. [DOI] [PubMed] [Google Scholar]
- [46].Vasheghani F, Zhang Y, Li YH, et al. PPARγ deficiency results in severe, accelerated osteoarthritis associated with aberrant mTOR signaling in the articular cartilage. Ann Rheum Dis. 2015;74(3):569–578. PMID: 25573665 PMCID: PMC4345902. [DOI] [PMC free article] [PubMed] [Google Scholar]
- [47].Cameron TL, Bell KM, Gresshoff IL, et al. XBP1-Independent UPR pathways suppress C/EBP-β mediated chondrocyte differentiation in ER-stress related skeletal disease. PLoS Genet. 2015;11(9):e1005505. PMID: 26372225 PMCID: PMC4651170. [DOI] [PMC free article] [PubMed] [Google Scholar]
- [48].Deegan S, Koryga I, Glynn SA, et al. A close connection between the PERK and IRE arms of the UPR and the transcriptional regulation of autophagy. Biochem Biophys Res Commun. 2015;456(1):305–311. PMID: 25475719. [DOI] [PubMed] [Google Scholar]
- [49].Song S, Tan J, Miao Y, et al. Crosstalk of autophagy and apoptosis: involvement of the dual role of autophagy under ER stress. J Cell Physiol. 2017;232(11):2977–2984. PMID: 28067409. [DOI] [PubMed] [Google Scholar]
- [50].Srinivas V, Bohensky J, Zahm AM, et al. Autophagy in mineralizing tissues: microenvironmental perspectives. Cell Cycle. 2009;8(3):391–393. PMID: 19177014 PMCID: PMC2668933. [DOI] [PMC free article] [PubMed] [Google Scholar]
- [51].Wu C, Zheng J, Yao X, et al. Defective autophagy in chondrocytes with Kashin-Beck disease but higher than osteoarthritis. Osteoarthritis Cartilage. 2014;22(11):1936–1946. PMID: 25168363. [DOI] [PubMed] [Google Scholar]
- [52].Zhang HY, Liu YD, Yang HX, et al. Installing and thereafter removing an aberrant prosthesis elicited opposite remodelling responses in growing mouse temporomandibular joints. J Oral Rehabil. 2015;42(9):685–692. PMID: 25940877. [DOI] [PubMed] [Google Scholar]
- [53].Wu T, Zhao Y, Wang H, et al. mTOR masters monocytic myeloid-derived suppressor cells in mice with allografts or tumors. Sci Rep. 2016;6:20250. PMID: 26833095 PMCID: PMC4735296. [DOI] [PMC free article] [PubMed] [Google Scholar]
- [54].Yan B, Zhang Z, Jin D, et al. mTORC1 regulates PTHrP to coordinate chondrocyte growth, proliferation and differentiation. Nat Commun. 2016;7:11151. PMID: 27039827 PMCID: PMC4822018. [DOI] [PMC free article] [PubMed] [Google Scholar]
- [55].Li A, Wei Y, Hung C, et al. Chondrogenic properties of collagen type XI, a component of cartilage extracellular matrix. Biomaterials. 2018;173:47–57. PMID: 29758546. [DOI] [PubMed] [Google Scholar]
- [56].Pesesse L, Sanchez C, Delcour JP, et al. Consequences of chondrocyte hypertrophy on osteoarthritic cartilage: potential effect on angiogenesis. Osteoarthritis Cartilage. 2013;21(12):1913–1923. PMID: 23973427. [DOI] [PubMed] [Google Scholar]
Associated Data
This section collects any data citations, data availability statements, or supplementary materials included in this article.