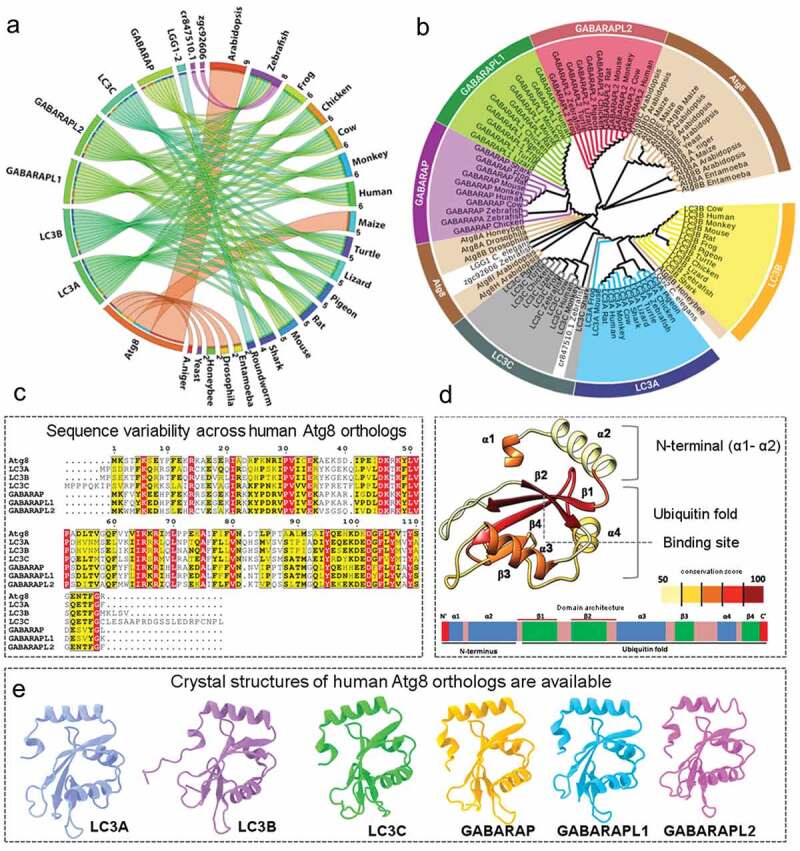
Figure 1.

Evolutionary, sequence and structural overview of human Atg8 orthologs. (a) A Circos plot illustrating connection between Atg8 orthologs (left half) and their number in 20 representative species (right half). Different species are individually colored and the width of the ribbon is proportional to number of proteins present. (b) The phylogenetic tree of Atg8 homologs is constructed using maximum likelihood method with 500 bootstrap iterations. Proteins and branches are coloured according to protein name where Atg8, LC3A, LC3B, LC3C, GABARAP, GABARAPL1 and GABARAPL2 are colored in brown, blue, yellow, gray, purple, green and pink, respectively. Other taxa not belonging to any of the above categories are coloured in black. (c) Multiple sequence alignment of human Atg8 orthologs showing sequence conservation with identical (red) and similar residues (yellow and bold). (d) The sequence conservation score averaged according to secondary structural elements (lower bar) is mapped onto the LC3B structure. The low to high intensity of the color bar indicates sequence conservation. (e) The 6 experimentally resolved structures of 6 human Atg8 orthologs are illustrated and individually colored.
