

Abstract
Objectives:
To examine trends in past-year cannabis use (CU) and cannabis use disorders (CUD) among youth in the U.S., when related changes began, and factors associated with these changes.
Method:
Data from 288,300 persons aged 12–17 who participated in the 2002–2014 National Surveys on Drug Use and Health. Descriptive analyses and bivariable and multivariable logistic regressions were applied (using year 2002 as the reference group for most analyses).
Results:
The prevalence of past-year CU among youth decreased from 15.8% in 2002 to 13.1% in 2014 (this downward trend occurred during 2002–2007 only (β= −0.0540, p<0.0001)). Among youth cannabis users, the prevalence of past-year CUD decreased from 27.0% in 2002 to 20.4% in 2014, with a downward trend starting in 2011 (β= −0.0970, p<0.0001). During 2002–2014, the prevalence of past-year tobacco use and alcohol use decreased, and prevalences of past-year CU increased among tobacco users and among alcohol users. Our multivariable results suggest that declines in past-year tobacco use (but not alcohol use) among youth were associated with declines in past-year CU during 2010–2014. Past-year CU and CUD were higher among racial/ethnic minorities (except for Non-Hispanic Asians and Hawaiians/Pacific Islanders for CU) than non-Hispanic whites and were similar between male and female youth during 2002–2014.
Conclusions:
In the U.S., compared to 2002, even after adjusting for covariates, CU decreased among youth during 2005–2014, and CUD declined among youth cannabis users during 2013–2014. Associations between declines in tobacco use and decreased CU suggest the importance of tobacco control and prevention among youth.
INTRODUCTION
In the past 20 years, cannabis-related policies and laws have changed significantly in the U.S.1–4 By November 2016, legalization for medical purposes had been adopted by 28 states and the District of Columbia,2–4 and nonmedical cannabis had been legalized in several jurisdictions.2 A recent study found that cannabis use (CU) and cannabis use disorders (CUD) doubled among U.S. adults from 2001–2002 to 2012–2013,5 yet another study reported that passage of state medical cannabis laws showed no increase in past-month CU among school-based youth.4 Given these changes and adverse effects of CU among youth,6–7 research is needed to examine trends in CU and CUD among youth in the U.S. (including school dropouts) and to assess factors associated with these trends.
Individuals are more likely to start with readily available substances, i.e., tobacco, alcohol, and marijuana.8–12 Yet, despite the common co-occurrence of CU with other substance use, none of existing studies examined the interplay of tobacco, alcohol, and other substance use, risk perceptions of CU, and perceived cannabis availability, with trends in past-year CU and CUD. Importantly, risk perceptions of CU have historically been inversely related to the prevalence of CU.13–15 However, a recent report suggested that perceived risk of smoking cannabis among school students had declined over the past decade, while the prevalence of CU had not increased.16 Thus, to help improve the effectiveness of youth substance use prevention and intervention programs, it is critical to investigate relationships among tobacco, alcohol, risk perceptions of CU, perceived cannabis availability, and trends in past-year CU and CUD.
Moreover, to help identify youth at risk for CU and CUD, it is necessary to understand whether and how sociodemographic factors such as race/ethnicity and gender are associated with past-year CU and CUD. Since previous studies have examined this topic among adults5, 17–19 or among people aged 12 or older 20 based on national data and among youth based on local data21−23 or convenience samples,24 it is important to examine these associations among youth based on nationally representative data and assess whether effect sizes of the associations between sociodemographic characteristics and past-year CU and CUD changed during 2002–2014.
To address these issues, this study examined the following questions:
Did prevalences of past-year CU among youth and CUD among youth cannabis users change in the U.S. during 2002–2014? Did risk perceptions of CU, perceived parental strong disapproval of CU, and perceived cannabis availability among youth and among youth cannabis users change during 2002–2014? If so, when did the changes begin?
Were tobacco use, alcohol use, risk perceptions of CU, and perceived cannabis availability associated with changes in past-year CU among youth and CUD among youth cannabis users during 2002–2014?
Additionally, were sociodemographic characteristics (e.g., race/ethnicity and gender), other substance use, cannabis legalization, and peer and parent factors associated with past-year CU among youth and CUD among youth cannabis users?
METHODS
Data Source
We examined serial cross-sectional data from youth aged 12–17 who participated in the 2002–2014 National Survey on Drug Use and Health (NSDUH), conducted by the Substance Abuse and Mental Health Services Administration (SAMHSA). NSDUH provides nationally representative data on CU and CUD among the U.S. civilian, noninstitutionalized population aged 12 or older.
Key advantages of using NSDUH include the consistent survey design, methodology and questionnaire content and large sample sizes, allowing sensitive detection of changes in CU and CUD trends across every year during 2002–2014.25 The annual mean weighted response rate of the 2002–2014 NSDUH was 66.0%.26–27 Details regarding NSDUH methods are provided elsewhere.26
Measures
NSDUH collected data on past-year (12 months prior to survey interview) use of tobacco, alcohol, cannabis, cocaine, hallucinogens, heroin, and inhalants and past-year nonmedical use of prescription pain relievers, sedatives, and stimulants among all respondents.26 Past-year cannabis users were asked the number of days they used cannabis. For persons reporting CU, NSDUH collected the source of last used cannabis.26 Based on state and year information, we created a variable indexing state legalization of commercial sales or personal possession for model adjustment purposes. NSDUH estimated past-year CUD and major depressive episodes (MDE) based on assessments of individual diagnostic criteria from the DSM-IV.28 CU, CUD, and other substance use measured by NSDUH have good validity and reliability.29–31
NSDUH also assessed perceptions of CU: perceived risk of smoking cannabis once or twice a week, perceived parental strong disapproval of using cannabis once a month or more, perceived peer’s strong disapproval of using cannabis once a month or more, perceived state legalization of medical CU (whether respondents think that medical CU is legal in their residing state), and perceived cannabis availability.26Age at first CU and having talked to parents about dangers of tobacco, alcohol, and drugs (yes/no) were also measured.26 Sociodemographic characteristics included age, sex, race/ethnicity, health insurance, metropolitan statistical area, census region, and year.
Statistical Analyses
For each examined year, we estimated past-year prevalences of CU and CUD and prevalences of risk perceptions of CU. Bivariable logistic regression models were applied to estimate prevalences, to test for differences between estimates for 2002 and each year during 2003–2014, and to test p values of beta coefficients of the year variable. Importantly, to examine temporal changes in trends, we identified joinpoints indicating significant inflection points in trends using a Monte Carlo Permutation method32 and estimated beta coefficients and p values for each segment separated by a joinpoint using segmented regression analyses.
Bivariable and multivariable logistic regression modeling were applied to assess unadjusted and adjusted relative risks33–34 for past-year CU among youth and CUD among cannabis users. Because MDE was unavailable in the 2002–2003 NSDUH,35 separate multivariable models were conducted using 2004–2014 data with this additional variable included and using 2002–2014 data without it. Our multivariable analysis specified a fixed order of entry for variables to test the effects of certain predictors independent of the influence of others and to identify factors that may be associated with changes in these outcomes. Multicollinearity and potential interaction effects between examined factors were assessed and were not identified in final multivariable models. Variables adjusted for in the model are presented in Table 3‘s footnote and Table 4. This study used SUDAAN33 to account for the complex sample design and sampling weights of the NSDUH.
Table 3.
Twelve-month unadjusted and adjusted relative risks of past-year cannabis use among youth as well as past-year cannabis use disorders among youth cannabis users in the U.S.
| Factors associated with cannabis use among youth |
Past-year cannabis use among youth: 2002–2014 NSDUH, n=288,300 a |
||||
|---|---|---|---|---|---|
| Bivariable model without adjusting for any covariates |
Multivariable Model controlled for other covariates, but not alcohol or tobacco use b |
Multivariable model controlled for alcohol use & other covariates, but not tobacco use b |
Multivariable model controlled for tobacco use & other covariates, but not alcohol use b |
Multivariable model controlled for other covariates & alcohol and tobacco use b |
|
| URR (95% CI) | ARR (95% CI) | ARR (95% CI) | ARR (95% CI) | ARR (95% CI) | |
| Year | |||||
| 2002† | 1.0 | 1.0 | 1.0 | 1.0 | 1.0 |
| 2003 | 1.0 (0.90–1.01) | 1.0 (0.95–1.04) | 1.0 (0.95–1.03) | 1.0 (0.96–1.04) | 1.0 (0.95–1.03) |
| 2004 | 0.9 (0.87–0.98) | 1.0 (0.95–1.04) | 1.0 (0.95–1.03) | 1.0 (0.96–1.04) | 1.0 (0.95–1.03) |
| 2005 | 0.8 (0.80–0.90) | 0.9 (0.89–0.98) | 0.9 (0.89–0.97) | 0.9 (0.90–0.98) | 0.9 (0.90–0.97) |
| 2006 | 0.8 (0.79–0.89) | 0.9 (0.90–0.99) | 0.9 (0.90–0.98) | 0.9 (0.91–0.99) | 0.9 (0.90–0.98) |
| 2007 | 0.8 (0.75–0.84) | 0.9 (0.87–0.95) | 0.9 (0.87–0.95) | 0.9 (0.89–0.97) | 0.9 (0.89–0.96) |
| 2008 | 0.8 (0.78–0.88) | 0.9 (0.89–0.97) | 0.9 (0.90–0.99) | 0.9 (0.91–0.99) | 1.0 (0.93–1.01) |
| 2009 | 0.9 (0.82–0.92) | 0.9 (0.86–0.94) | 0.9 (0.88–0.96) | 1.0 (0.93–1.01) | 0.9 (0.92–0.99) |
| 2010 | 0.9 (0.84–0.95) | 0.9 (0.86–0.95) | 0.9 (0.91–0.99) | 1.0 (0.93–1.02) | 1.0 (0.95–1.03) |
| 2011 | 0.9 (0.85–0.96) | 0.9 (0.85–0.93) | 0.9 (0.91–0.99) | 1.0 (0.96–1.04) | 1.0 (0.98–1.06) |
| 2012 | 0.9 (0.81–0.91) | 0.8 (0.80–0.88) | 0.9 (0.87–0.96) | 1.0 (0.94–1.02) | 1.0 (0.96–1.05) |
| 2013 | 0.9 (0.80–0.91) | 0.8 (0.77–0.84) | 0.9 (0.86–0.94) | 1.0 (0.93–1.01) | 1.0 (0.97–1.06) |
| 2014 | 0.8 (0.78–0.89) | 0.8 (0.73–0.80) | 0.9 (0.82–0.90) | 1.0 (0.91–1.00) | 1.0 (0.95–1.04) |
| Alcohol Use | |||||
| Yes | 2.9 (2.77–2.95) | 2.1 (2.01–2.13) | |||
| No† | 1.0 | 1.0 | |||
| Tobacco Use | |||||
| Yes | 3.0 (2.92–3.09) | 3.0 (2.92–3.09) | |||
| No† | 1.0 | 1.0 | |||
| Factors associated with cannabis use disorders among youth cannabis users |
Past-year cannabis use disorders among youth cannabis users: 2002–2014 NSDUH, n=41,100 a |
||||
| Bivariable model without adjusting for any covariates |
Multivariable Model controlled for other covariates, but not alcohol or tobacco use c |
Multivariable model controlled for alcohol use & other covariates, but not tobacco use c |
Multivariable model controlled for tobacco use & other covariates, but not alcohol use c |
Multivariable model controlled for other covariates & alcohol and tobacco use c |
|
| URR (95% CI) | ARR (95% CI) | ARR (95% CI) | ARR (95% CI) | ARR (95% CI) | |
| Year | |||||
| 2002† | 1.0 | 1.0 | 1.0 | 1.0 | 1.0 |
| 2003 | 0.9 (0.85–1.04) | 1.0 (0.88–1.07) | 1.0 (0.88–1.07) | 1.0 (0.89–1.07) | 1.0 (0.89–1.07) |
| 2004 | 1.0 (0.90–1.09) | 1.0 (0.92–1.10) | 1.0 (0.92–1.10) | 1.0 (0.92–1.09) | 1.0 (0.92–1.10) |
| 2005 | 1.0 (0.90–1.10) | 1.0 (0.94–1.13) | 1.0 (0.94–1.13) | 1.0 (0.93–1.13) | 1.0 (0.93–1.13) |
| 2006 | 1.0 (0.86–1.07) | 1.0 (0.89–1.09) | 1.0 (0.90–1.09) | 1.0 (0.88–1.08) | 1.0 (0.89–1.08) |
| 2007 | 0.9 (0.83–1.02) | 1.0 (0.87–1.06) | 1.0 (0.87–1.06) | 1.0 (0.87–1.05) | 0.9 (0.87–1.05) |
| 2008 | 1.0 (0.87–1.07) | 1.0 (0.93–1.13) | 1.0 (0.93–1.13) | 1.0 (0.93–1.13) | 1.0 (0.93–1.13) |
| 2009 | 0.9 (0.83–1.02) | 0.9 (0.86–1.04) | 0.9 (0.86–1.05) | 0.9 (0.86–1.05) | 0.9 (0.86–1.05) |
| 2010 | 0.9 (0.85–1.04) | 1.0 (0.89–1.08) | 1.0 (0.89–1.08) | 1.0 (0.90–1.09) | 1.0 (0.90–1.09) |
| 2011 | 0.9 (0.83–1.02) | 0.9 (0.85–1.03) | 0.9 (0.85–1.04) | 0.9 (0.87–1.06) | 1.0 (0.87–1.06) |
| 2012 | 0.9 (0.79–0.99) | 0.9 (0.83–1.01) | 0.9 (0.83–1.02) | 1.0 (0.86–1.06) | 1.0 (0.86–1.06) |
| 2013 | 0.8 (0.71–0.89) | 0.9 (0.76–0.95) | 0.9 (0.77–0.96) | 0.9 (0.80–0.99) | 0.9 (0.80–0.99) |
| 2014 | 0.8 (0.67–0.86) | 0.8 (0.70–0.89) | 0.8 (0.70–0.89) | 0.8 (0.75–0.95) | 0.8 (0.75–0.96) |
| Alcohol Use | |||||
| Yes | 1.1 (1.07–1.23) | 1.1 (1.01–1.16) | |||
| No† | 1.0 | 1.0 | |||
| Tobacco Use | |||||
| Yes | 1.5 (1.43–1.63) | 1.5 (1.42–1.61) | |||
| No† | 1.0 | 1.0 | |||
Notes: CI: Confidence Interval. URR: Unadjusted Relative Risk. ARR: Adjusted Relative Risk.
Reference group. Significant relative risks are in bold.
SAMHSA requires that any description of overall sample sizes based on the restricted-use data files has to be rounded to the nearest 100 to minimize potential disclosure risk.
Each multivariable model also adjusted for the following variables not showing in the table above: age, gender, race/ethnicity, health insurance, metropolitan statistical area, region, use of heroin, cocaine, hallucinogens, or inhalants, nonmedical use of prescription pain relievers, sedatives, and stimulants, perceived state legalization of medical cannabis use, state legalization of commercial sales or personal possession, perceived risk of smoking cannabis once or twice a week, perceived parent disapproval of using cannabis once a month or more, perceived peer’s disapproval of using cannabis once a month or more, perceived cannabis availability, talked to parents about dangers of tobacco, alcohol, and drugs, and major depressive episode (See Table 4). The trend in cannabis use among youth remained the same even after entering risk perceptions of cannabis use and perceived cannabis availability separately.
Each multivariable model also adjusted for the following variables not showing in the table above: age, gender, race/ethnicity, health insurance, metropolitan statistical area, region, use of heroin, cocaine, hallucinogens, or inhalants, nonmedical use of prescription pain relievers, sedatives, and stimulants, age at first cannabis use, perceived state legalization of medical cannabis use, state legalization of commercial sales or personal possession, perceived cannabis availability, source of cannabis , perceived risk of smoking cannabis once or twice a week, perceived parent disapproval of using cannabis once a month or more, perceived peer’s disapproval of using cannabis once a month or more, talked to parents about dangers of tobacco, alcohol, and drugs, and major depressive episode (See Table 4). The trend in cannabis use disorders among youth cannabis users remained the same even after entering risk perceptions of cannabis use and perceived cannabis availability separately.
Table 4.
Other correlates of past-year cannabis use among youth as well as other correlates of cannabis use disorders among youth cannabis users in the U.S.
| Factors | Cannabis Use among Youth 2002–2014 NSDUH, n=288,300a Adjusted Relative Risk (95% CI) |
Cannabis Use Disorders among Youth Users 2002–2014 NSDUH, n=41,100 a Adjusted Relative Risk (95% CI) |
|---|---|---|
| Age | ||
| 12–13 | 0.7 (0.70–0.75) | 0.8 (0.72–0.88) |
| 14–15 | 0.9 (0.92–0.95) | 0.9 (0.89–0.98) |
| 16–17† | 1.0 | 1.0 |
| Gender | ||
| Male | 1.0 (0.98–1.01) | 1.0 (0.98–1.07) |
| Female† | 1.0 | 1.0 |
| Race/Ethnicity | ||
| NH white† | 1.0 | 1.0 |
| NH black | 1.3 (1.26–1.32) | 1.2 (1.17–1.33) |
| NH Native American/Alaska Native | 1.4 (1.31–1.53) | 1.2 (1.04–1.43) |
| NH Hawaiian/Other Pacific Islander | 1.1 (0.97–1.30) | 1.3 (1.03–1.69) |
| NH Asian | 1.0 (0.92–1.06) | 1.2 (1.02–1.48) |
| NH more than one race | 1.2 (1.11–1.22) | 1.2 (1.03–1.31) |
| Hispanic | 1.1 (1.05–1.10) | 1.2 (1.16–1.31) |
| Health Insurance | ||
| Private only† | 1.0 | 1.0 |
| No insurance coverage | 1.0 (1.00–1.07) | 1.0 (0.95–1.12) |
| Medicaid | 1.1 (1.09–1.14) | 1.1 (1.01–1.12) |
| Other | 1.0 (0.96–1.05) | 1.0 (0.89–1.12) |
| Metropolitan Statistical Area | ||
| Large† | 1.0 | 1.0 |
| Small | 1.0 (0.97–1.01) | 1.0 (0.97–1.07) |
| Nonmetropolitan | 0.9 (0.90–0.94) | 1.0 (0.93–1.04) |
| Region | ||
| Northeast | 1.0 (0.94–0.99) | 1.0 (0.93–1.07) |
| Midwest | 0.9 (0.92–0.97) | 1.0 (0.97–1.10) |
| South | 0.9 (0.88–0.92) | 1.1 (0.94–1.07) |
| West† | 1.0 | 1.0 |
| Cocaine Use | ||
| Yes | 1.9 (1.71–2.00) | 1.2 (1.13–1.29) |
| No† | 1.0 | 1.0 |
| Hallucinogen Use | ||
| Yes | 1.8 (1.71–1.86) | 1.2 (1.18–1.32) |
| No† | 1.0 | 1.0 |
| Heroin Use | ||
| Yes | 1.2 (0.96–1.44) | 1.0 (0.83–1.22) |
| No† | 1.0 | 1.0 |
| Inhalant Use | ||
| Yes | 1.0 (1.01–1.08) | 1.2 (1.14–1.30) |
| No† | 1.0 | 1.0 |
| Pain Reliever Nonmedical use | ||
| Yes | 1.2 (1.20–1.27) | 1.3 (1.21–1.34) |
| No† | 1.0 | 1.0 |
| Sedative Nonmedical Use | ||
| Yes | 1.2 (1.13–1.24) | 1.2 (1.15–1.30) |
| No† | 1.0 | 1.0 |
| Stimulant Nonmedical Use | ||
| Yes | 1.2 (1.13–1.26) | 1.2 (1.17–1.33) |
| No† | 1.0 | 1.0 |
| Age of First Cannabis Use | ||
| ≤13 | -- | 1.9 (1.71–2.04) |
| 14–15 | 1.4 (1.32–1.55) | |
| 16–17† | 1.0 | |
| State Legalized Commercial Sales or Personal Possession | ||
| Yes | 1.0 (0.95–1.15) | 0.9 (0.73–1.15) |
| No† | 1.0 | 1.0 |
| Perceived State Legalization of Medical Cannabis Use | ||
| Yes | 1.1 (1.04–1.08) | 1.1 (1.01–1.13) |
| No† | 1.0 | 1.0 |
| Not Sure/Unknown | 1.0 (0.95–0.99) | 0.9 (0.89–1.01) |
| Perceived Cannabis Availability, Fairly/Very Easy | ||
| Yes | 1.6 (1.54–1.63) | 1.4 (1.29–1.58) |
| No† | 1.0 | 1.0 |
| Perceived Risk of Smoking Cannabis 1–2/Week | ||
| No risk† | 1.0 | 1.0 |
| Slight risk | 0.9 (0.82–0.87) | 1.0 (0.95–1.05) |
| Moderate risk | 0.7 (0.66–0.70) | 0.9 (0.87–0.98) |
| Great risk | 0.5 (0.52–0.56) | 0.9 (0.86–1.02) |
| Unspecified | 0.7 (0.58–0.76) | 0.9 (0.60–1.46) |
| Perceived Parent Disapproval of Using Cannabis Once a Month or More | ||
| Strong disapproval† | 1.0 | 1.0 |
| Somewhat disapproval | 1.1 (1.11–1.19) | 1.0 (0.89–1.02) |
| Neither approval nor disapproval | 1.4 (1.32–1.40) | 1.0 (0.96–1.07) |
| Perceived Peer’s Disapproval of Using Cannabis Once a Month or More | ||
| Strong disapproval† | 1.0 | 1.0 |
| Somewhat disapproval | 1.4 (1.39–1.48) | 1.2 (0.95–1.56) |
| Neither approval nor disapproval | 1.8 (1.80–1.90) | 1.2 (1.14–1.31) |
| Talked to Parents about Dangers of Tobacco, Alcohol, and Drugs | ||
| Yes | 1.0 (0.95–0.99) | 0.9 (0.86–0.94) |
| No† | 1.0 | 1.0 |
| Source of Cannabis | ||
| Bought it | -- | 1.6 (1.50–1.65) |
| Traded for it | 1.4 (1.25–1.68) | |
| Got it for free/shared † | 1.0 | |
| Grew it yourself | 1.6 (1.34–2.00) | |
| Method unspecified | 0.4 (0.29–0.47) | |
| Major Depressive Episode b | ||
| Yes | 1.0 (1.00–1.06) | 1.3 (1.21–1.36) |
| No† | 1.0 | 1.0 |
Notes: CI: Confidence Interval. NH: Non-Hispanic. +Reference group. Significant relative risks are in bold.
SAMHSA requires that any description of overall sample sizes based on the restricted-use data files has to be rounded to the nearest 100 to minimize potential disclosure risk.
The relative risks of past-year major depressive episode (MDE) were based on separate models using the 2004–2014 NSDUH data since MDE among youth was not measured in 2002–2003 NSDUH.
RESULTS
Trends in cannabis use and use disorders among youth
Based on 288,300 sampled youth aged 12–17 from the 2002–2014 NSDUH, the prevalence of past-year CU among youth decreased from 15.8% in 2002 to 13.1% in 2014 (absolute difference= −2.7%, 95% Confidence Interval [CI]= −3.68% to −1.72%); this downward trend occurred during 2002–2007 only (β= −0.0540, p<0.0001) (Table 1, Figure 1). The prevalence of past-year CUD among youth decreased from 4.3% in 2002 to 2.7% in 2014 (absolute difference= −1.6%, 95% CI= −1.99% to −1.21%); there was a downward trend during 2002–2007 (β= −0.0585, p<0.0001), an upward trend during 2007–2010 (β= 0.0414, p=0.0486), and another downward trend starting in 2010 (β= −0.0790, p<0.0001).
Table 1.
Past-year prevalence of cannabis, alcohol, and tobacco use among youth (n=288,3001), cannabis use among tobacco users (n=57,0001), cannabis use among alcohol users (n=89,3001), and cannabis use disorders among youth (n=288,3001) and among youth users (n=41,1001): U.S., 2002–2014a
| Past-year prevalence a, weighted percentage (95% confidence interval) |
β coefficients and p Values for Trends |
|||||||||||||
|---|---|---|---|---|---|---|---|---|---|---|---|---|---|---|
| 2002 | 2003 | 2004 | 2005 | 2006 | 2007 | 2008 | 2009 | 2010 | 2011 | 2012 | 2013 | 2014 | ||
| Cannabis use among youth b | 15.8 (15.15–16.42) | 15.0 (14.38–15.60) | 14.5 † (13.90–15.12) | 13.3 † (12.77–13.94) | 13.2 † (12.62–13.83) | 12.5 †* (11.94–13.11) | 13.1 † (12.53–13.67) | 13.7 † (13.06–14.29) | 14.0 † (13.36–14.71) | 14.2 † (13.59–14.89) | 13.5† (12.91–14.09) | 13.4† (12.84–14.07) | 13.1† (12.48–13.77) | Overall: β= −0.0102, p<0.0001 2002–2007: β= −0.0540, p<0.0001 2007–2014: β= 0.0059, p=0.1850 |
| Cannabis use disorders among youth b | 4.3 (3.94–4.61) | 3.8 (3.51–4.16) | 3.9 (3.57–4.21) | 3.6† (3.27–3.91) | 3.4† (3.13–3.75) | 3.1†* (2.85–3.40) | 3.4† (3.11–3.72) | 3.4† (3.11–3.72) | 3.6†* (3.25–3.90) | 3.5† (3.22–3.85) | 3.2† (2.93–3.57) | 2.9† (2.59–3.19) | 2.7† (2.38–3.01) | Overall: β= −0.0272, p<0.0001 2002–2007: β= −0.0585, p<0.0001 2007–2010: β= 0.0414, p=0.0486 2010–2014: β= −0.0790, p<0.0001 |
| Cannabis use disorders among users c | 27.0 (25.19–28.92) | 25.5 (23.66–27.45) | 26.8 (24.90–28.73) | 26.8 (24.79–28.95) | 25.9 (23.87–28.05) | 24.9 (23.00–26.86) | 26.0 (23.94–28.11) | 24.8 (22.88–26.85) | 25.4 (23.53–27.40) | 24.8* (22.85–26.75) | 24.0† (21.94–26.11) | 21.4† (19.53–23.35) | 20.4† (18.37–22.66) | Overall: β= −0.0226, p<0.0001 2002–2011: β= −0.0108, p=0.0540 2011–2014: β= −0.0970, p=0.0001 |
| Tobacco use d among youth | 23.6 (22.84–24.35) | 22.5 (21.80–23.30) | 22.1† (21.33–22.81) | 21.2† (20.40–21.94) | 20.9† (20.16–21.56) | 19.9† (19.12–20.60) | 19.1† (18.41–19.75) | 19.5† (18.77–20.25) | 18.2†* (17.44–18.88) | 16.8† (16.17–17.51) | 15.2† (14.63–15.88) | 13.9† (13.28–14.55) | 12.7† (12.06–13.39) | Overall: β= −0.0558, p<0.0001 2002–2010: β= −0.0387, p<0.0001 2010–2014: β= −0.1066, p<0.0001 |
| Cannabis use among tobacco users d | 51.9 (50.18–53.64) | 50.9 (49.20–52.60) | 50.8 (48.94–52.72) | 48.1†* (46.29–49.96) | 50.3 (48.36–52.14) | 48.8† (46.93–50.74) | 51.7 (49.76–53.62) | 52.4 (50.35–54.49) | 55.3† (53.29–57.33) | 57.2† (55.23–59.18) | 57.4† (55.15–59.65) | 59.7† (57.46–61.98) | 57.1† (54.55–59.54) | Overall: β= 0.0294, p<0.0001 2002–2005: β= −0.0454, p=0.0058 2005–2014:β= 0.0521, p<0.0001 |
| Alcohol use e among youth | 34.6 (33.82–35.38) | 34.3 (33.42–35.11) | 33.9 (33.02–34.70) | 33.3† (32.54–34.16) | 33.0†* (32.17–33.81) | 31.9† (31.04–32.69) | 31.0† (30.25–31.85) | 30.5†* (29.73–31.37) | 28.7† (27.85–29.52) | 27.8† (26.96–28.63) | 26.3† (25.47–27.12) | 24.6† (23.86–25.43) | 24.0† (23.23–24.86) | Overall: β= −0.0440, p<0.0001 2002–2006: β= −0.0185, p=0.0018 2006–2009: β= −0.0378, p<0.0001 2009–2014: β= −0.0671, p<0.0001 |
| Cannabis use among alcohol users e | 40.5 (39.06–41.89) | 38.6 (37.08–40.04) | 37.8† (36.29–39.26) | 35.1† (33.71–36.52) | 35.3† (33.89–36.67) | 34.4†* (32.92–35.85) | 37.1† (35.66–38.49) | 38.1† (36.54–39.77) | 41.5* (39.97–43.12) | 42.9† (41.26–44.58) | 42.1 (40.35–43.85) | 42.4 (40.63–44.12) | 43.0† (41.16–44.84) | Overall: β= 0.0195, p<0.0001 2002–2007: β= −0.0530, p<0.0001 2007–2010: β= 0.0959, p<0.0001 2010–2014: β= 0.0096, p=0.3913 |
Notes: Data source: Substance Abuse and Mental Health Services Administration’s the 2002–2014 National Survey on Drug Use and Health (NSDUH) data. Weighted prevalence estimates are reported. SAMHSA requires that any description of overall sample sizes based on the restricted-use data files has to be rounded to the nearest 100 to minimize potential disclosure risk.
Youth: Those aged 12–17 in the U.S.
Users: Those aged 12–17 who had past-year cannabis use in the U.S.
Tobacco use: Use of tobacco in the past 12 months.
Alcohol use: Use of alcohol in the past 12 months.
Difference between the estimate in which the footnote symbol appears and the 2002 estimate (the reference year) is statistically significant at the .05 level.
: Indicates the year when a jointpoint occured. All these overall trends were statistical significant even after Bonferroni correction (Because a total of 7 hypotheses for the overall trends with a desired α of .05 were tested, the Bonferroni correction would test each individual hypothesis at α = .05/7 =0.0071).
Figure 1.
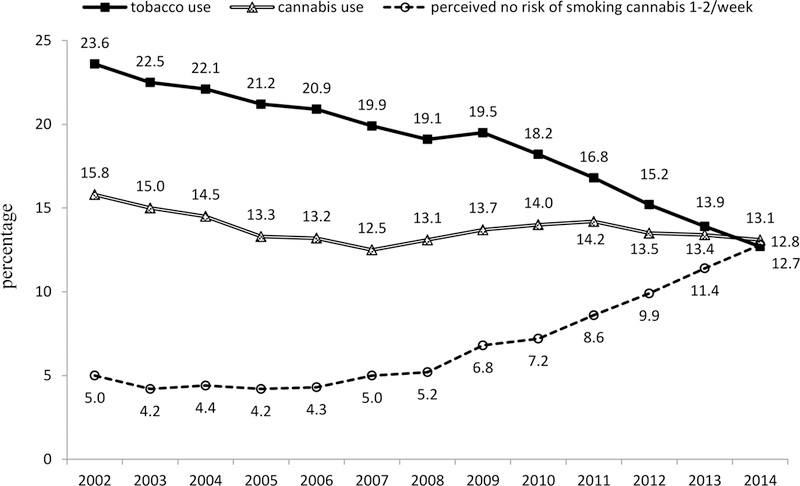
12-month prevalence of cannabis use and tobacco use and perceived no risk of smoking cannabis once or twice a week among youth in the U.S.: 2002–2014
Trends in tobacco and alcohol use among youth
The prevalence of tobacco use decreased from 23.6% in 2002 to 12.7% in 2014 (absolute difference= −10.9%, 95% CI= −11.88% to −9.92%) with downward trends starting in 2002 (2002–2010: β= −0.0387, p<0.0001) and accelerating in 2010 (2010–2014: β= −0.1066, p<0.0001) (Table 1, Figure 1). The prevalence of alcohol use decreased from 34.6% in 2002 to 24.0% in 2014 (absolute difference= −10.6%, 95% CI= −11.78% to −9.42%) with downward trends starting 2002 (2002–2006: β= −0.0185, p=0.0018) and accelerating in 2006 (2006–2009: β= −0.0378, p<0.0001) and further accelerating in 2009 (2009–2014: β= −0.0671, p<0.0001).
Trends in cannabis use among youth tobacco and alcohol users
Among tobacco users, the prevalence of past-year CU increased from 51.9% in 2002 to 57.1% in 2014 (absolute difference= 5.2%, 95% CI= 2.26% to 8.14%) with a downward trend during 2002–2005 (β= −0.0454, p=0.0058) and an upward trend starting in 2005 (β= 0.0521, p<0.0001) (Table 1). Among alcohol users, the prevalence of past-year CU increased from 40.5% in 2002 to 43.0% in 2014 (absolute difference 2.5%, 95% CI= 0.15% to 4.85%) with a downward trend during 2002–2007 (β= −0.0530, p<0.0001) and an upward trend during 2007–2010 (β= 0.0959, p<0.0001).
Trends in risk perceptions of smoking cannabis among youth
The prevalence of perceiving great risk of smoking cannabis decreased from 51.5% in 2002 to 37.4% in 2014 (absolute difference= −14.1%, 95% CI= −15.28% to −12.92%) with an upward trend during 2002–2007 (β=0.0164, p=0.0002); then a downward trend starting in 2007 (β= −0.0996, p<0.0001) (Table 2). The prevalence of perceiving no risk of smoking cannabis increased from 5.0% in 2002 to 12.8% in 2014 (absolute difference= 7.8%, 95% CI= 7.02% to 8.58%) with a slightly downward trend during 2002–2006 (β= −0.0362, p=0.0068); then an upward trend starting in 2006 (β=0.1517, p<0.0001) (Figure 1).
Table 2.
Perceived risk of cannabis use, perceived parental strong disapproval of cannabis use, perceived cannabis availability among youth (n=288,300 a) and among youth cannabis users (n=41,100 a):U.S., 2002–2014 a
| 12-Month Prevalence, weighted percentage (95% confidence interval) |
β coefficients and p Values for Trends |
|||||||||||||
|---|---|---|---|---|---|---|---|---|---|---|---|---|---|---|
| 2002 | 2003 | 2004 | 2005 | 2006 | 2007 | 2008 | 2009 | 2010 | 2011 | 2012 | 2013 | 2014 | ||
| Perceiving great riskb among youth c | 51.5 (50.70–52.36) | 54.4† (53.54–55.31) | 54.7† (53.84–44.60) | 55.0† (54.10–55.93) | 54.2† (53.33–55.11) | 54.6†* (53.71–55.54) | 52.8† (51.88–53.64) | 49.0† (48.12–49.92) | 47.2† (46.33–48.12) | 44.8† (43.82–45.74) | 43.6† (42.73–44.55) | 39.5† (38.63–40.41) | 37.4† (36.44–38.36) | Overall: β= −0.0569, p<0.0001 2002–2007: β= 0.0164, p=0.0002 2007–2014: β= −0.0996, p<0.0001 |
| Perceiving great riskb among Users d | 15.8 (14.33–17.42) | 16.6 (15.11–18.28) | 16.8 (15.21–18.54) | 15.9 (14.36–17.65) | 16.5 (14.73–18.42) | 16.2* (14.55–18.04) | 14.5 (13.00–16.23) | 10.5† (9.17–12.02) | 11.5† (9.97–13.19) | 8.0† (6.83–9.28) | 8.4† (7.19–9.71) | 6.4† (5.26–7.70) | 5.9† (4.77–7.20) | Overall: β= −0.0929, p<0.0001 2002–2007: β= 0.0013, p=0.9304 2007–2014: β= −0.1646, p<0.0001 |
| Perceiving no risk e among youth | 5.0 (4.63–5.34) | 4.2 (3.91–4.59) | 4.4 (4.04–4.82) | 4.2 (3.82–4.52) | 4.3* (3.91–4.61) | 5.0 (4.66–5.41) | 5.2 (4.80–5.57) | 6.8† (6.35–7.24) | 7.2† (6.79–7.76) | 8.6† (8.07–9.06) | 9.9† (9.36–10.39) | 11.4† (10.86–11.99) | 12.8† (12.14–13.39) | Overall: β= 0.1118, p<0.0001 2002–2006: β= −0.0362, p=0.0068 2006–2014: β= 0.1517, p<0.0001 |
| Perceiving no risk eamong Users | 17.4 (15.90–19.07) | 16.4 (14.87–18.11) | 16.0 (14.45–17.70) | 17.0 (15.34–18.84) | 14.9†* (13.38–16.63) | 21.0† (19.04–23.03) | 20.5† (18.86–22.50) | 27.6† (25.58–29.79) | 29.0† (27.19–30.96) | 32.1† (30.09–34.24) | 38.8† (36.45–41.21) | 42.8† (40.50–45.03) | 47.4† (44.74–50.03) | Overall: β= 0.1407, p<0.0001 2002–2006: β= −0.0323, p=0.0952 2006–2014: β= 0.1932, p<0.0001 |
| Perceived parental strong disapproval of using cannabis f amonth youth | 92.0 (91.50–92.42) | 92.2 (91.77–92.68) | 93.0† (92.52–93.42) | 92.9† (92.45–93.37) | 93.1† (92.68–93.54) | 93.3†*(92.80–93.68) | 93.1† (92.63–93.53) | 93.0† (92.49–93.39) | 91.9 (91.37–92.41) | 91.7 (91.16–92.10) | 91.3 (90.83–91.81) | 90.6† (90.11–91.13) | 90.0† (89.32–90.55) | Overall: β= −0.0254, p<0.0001 2002–2007: β= 0.0382, p<0.0001 2007–2014:β= −0.0647, p<0.0001 |
| Perceived parental strong disapproval of using cannabis f among users | 74.4 (72.45–76.18) | 74.0 (72.07–75.85) | 75.8 (73.84–77.72) | 74.6 (72.55–76.52) | 75.0 (72.98–76.90) | 74.3* (72.26–76.32) | 74.1 (71.99–76.14) | 72.0 (69.87–74.03) | 68.8† (66.58–70.85) | 69.0† (66.82–71.14) | 68.7† (66.43–70.79) | 65.5† (63.27–67.65) | 63.2† (60.62–65.71) | Overall: β= −0.0448, p<0.0001 2002–2007: β= 0.0031, p=0.8037 2007–2014: β= −0.0737, p<0.0001 |
| Perceived availability g among youth | 55.0 (54.11–55.82) | 53.6† (52.73–54.52) | 52.2† (51.34–53.14) | 51.0† (50.09–51.82) | 50.1†* (49.25–50.99) | 49.2† (48.32–50.07) | 49.4†(48.50–50.28) | 50.0† (49.11–50.94) | 48.9† (47.89–49.87) | 47.7† (46.79–48.66) | 47.8† (46.89–48.67) | 48.6† (47.72–49.54) | 47.8† (46.80–48.74) | Overall: β= −0.0214, p<0.0001 2002–2006: β= −0.0496, p<0.0001 2006–2014: β= −0.0111, p<0.0001 |
| Perceived availability g among users | 91.7 (90.41–92.78) | 91.1 (89.80–92.16) | 91.9 (90.59–92.99) | 91.2 (89.81–92.44) | 92.1 (90.72–93.29) | 91.9 (90.56–93.03) | 91.5 (89.98–92.77) | 90.8 (89.35–92.14) | 89.8 (88.11–91.19) | 91.3 (89.99–92.43) | 90.3 (88.78–91.56) | 90.3 (88.71–91.60) | 89.8 (88.18–91.28) | Overall: β=−0.0177, p=0.0036 No joinpoint identified during this period. |
Notes: Data source: The 2002–2014 National Survey on Drug Use and Health (NSDUH) data. Weighted prevalence estimates are reported. SAMHSA requires that any description of overall sample sizes based on the restricted-use data files has to be rounded to the nearest 100 to minimize potential disclosure risk.
Perceived great risk of smoking cannabis once or twice a week.
Youth: Those aged 12–17 in the U.S.
Users: Those aged 12–17 who had past-year cannabis use in the U.S.
Perceived no risk of smoking cannabis once or twice a week.
Perceived parental strong disapproval of using cannabis once a month or more.
Perceived availability (fairly or very easy to obtain marijuana).
Difference between the estimate in which the footnote symbol appears and the 2002 estimate (the reference year) is statistically significant at the .05 level.
: Indicates the year when a jointpoint occured. All these overall trends were statistical significant even after Bonferroni correction (Because a total of 8 hypotheses for the overall trends with a desired α of .05 were tested, the Bonferroni correction would test each individual hypothesis at α = .05/8 =0.00625).
Trends in cannabis use disorders and perceived risk of smoking cannabis among youth users
Among cannabis users, the prevalence of past-year CUD decreased from 27.0% in 2002 to 20.4% in 2014 (absolute difference= −6.6%, 95% CI= −9.34% to −3.89%), with a downward trend starting in 2011 (β= −0.0970, p<0.0001) (Table 1). The prevalence of perceiving great risk of smoking cannabis decreased from 15.8% in 2002 to 5.9% in 2014 (absolute difference= −9.9%, 95% CI= −11.86% to −7.94%), with a downward trend starting in 2007 (β= −0.1646, p<0.0001) (Table 2). The prevalence of perceiving no risk of smoking cannabis increased from 17.4% in 2002 to 47.4% in 2014 (absolute difference= 30.0%, 95% CI= 26.86% to 33.14%) with an upward trend starting in 2006 (β= 0.1932, p<0.0001).
Associations between changes in cannabis use and changes in alcohol and tobacco use
Bivariable logistic regression results showed that youth were less likely to use cannabis during 2004–2014 compared to 2002 (unadjusted relative risks (URRs)=0.8–0.9) (Table 3). After controlling for other covariates (See Table 3 footnotes and Table 4), but without adjusting for alcohol and tobacco use, youth were still less likely to use cannabis during 2005–2014 compared to 2002 (adjusted relative risks (ARRs)=0.8–0.9). After controlling for other covariates and alcohol use, but not tobacco use, youth were still less likely to use cannabis in 2005–2014 compared to 2002 (ARRs=0.8–0.9).
Results were similar after either controlling for other covariates and tobacco use, but not alcohol use, or controlling for other covariates and tobacco and alcohol use: youths were less likely to use cannabis only during 2005–2007 and in 2009 compared to 2002 (ARRs=0.9). Thus, adjusting for alcohol use did not seem to affect ARRs and significance of the year variable, but adjusting for tobacco reduced both ARRs and significance of the year variable.
Associations between changes in cannabis use disorders and changes in alcohol and tobacco use
Bivariable logistic regression results showed that youth cannabis users were less likely to have past-year CUD during 2012–2014 than in 2002 (URRs=0.8–0.9) (Table 3). After controlling for other covariates (See Table 3 footnotes and Table 4), but not alcohol or tobacco use, youth cannabis users were still less likely to have CUD during 2013–2014 compared to 2002 (ARRs=0.8–0.9). After controlling for other covariates and alcohol use, but not tobacco use, youth cannabis users were less likely to have CUD during 2013–2014 compared to 2002 (ARRs=0.8–0.9). Results remained similar either after controlling for other covariates and tobacco use, but not alcohol use, or controlling for other covariates as well as tobacco and alcohol use.
Other correlates of cannabis use among youth
Compared with each corresponding reference group, the adjusted prevalence of past-year CU was higher among youth aged 16–17, non-Hispanic blacks, Hispanics, non-Hispanic youth with more than one race, non-Hispanic Native Americans and Alaska Natives, Medicaid beneficiaries, and youth residing in large metropolitan areas and in the South (Table 4). CU was higher among users of tobacco, alcohol, cocaine, hallucinogens, and inhalants, and nonmedical users of prescription pain relievers, sedatives, and stimulants than the corresponding nonusers.
Other correlates of cannabis use disorders among youth users
Among Cannabis users (Table 4), compared with each corresponding reference group, past-year CUD were higher among those aged 16–17, racial/ethnic minorities, and Medicaid beneficiaries. It was higher among users of tobacco, alcohol, cocaine, hallucinogens, and inhalants, and nonmedical users of prescription pain relievers, sedatives, and stimulants than the corresponding nonusers. Compared with each corresponding reference group, CUD were also higher among those who first used cannabis by age 15 and users with depression.
DISCUSSION
During 2002–2014, the prevalence of perceiving that smoking cannabis has no risk increased from 5.0% to 12.8% among youth and increased from 17.4% to 47.4% among youth cannabis users. Changes in risk perceptions among youth generally began in 2006–2007, which may be due to cumulative effects of policy changes as 12 states had legalized medical CU by 2007.19
Surprisingly, given the reductions in perceived harmfulness, the prevalence of past-year CU among youth also decreased from 15.8% in 2002 to 13.1% in 2014. CU declined among youth during 2005–2014 compared to 2002, even after adjusting for sociodemographic characteristics and substance use factors (except for tobacco use). This decline occurred even in the context of declines in youth risk perceptions of CU, especially during 2007–2014. Previous researchers have suggested that the stable prevalence of parental or peer’s disapproval of CU and the decline in perceived cannabis availability may explain the recent stable prevalence of CU among U.S. middle and high school students despite declining risk perceptions.16 By contrast, we found that during 2002–2014, changes in alcohol use, parental or peer’s disapproval of CU, risk perceptions of CU, and perceived cannabis availability were not associated with declines in CU among youth.
Tobacco use among youth declined from 23.6% in 2002 to 12.7% in 2014. Importantly, we found that these declines in tobacco use (starting in 2004–2010 and accelerating during 2010–2014) were strongly associated with declines in CU among U.S. youth. After adjusting for the prevalence of tobacco use, the differences in the prevalence of CU in 2010–2014 and 2002 were no longer significant, suggesting if the prevalence of tobacco use remained unchanged, the prevalence of past-year CU among youth in 2010–2014 would have been similar to that in 2002.
Overall, our results highlight the importance of tobacco control and prevention among youth.36–38 Overlaps of tobacco, alcohol, and CU are common among youth.12, 37, 39–40 Tobacco use and CU share a common route of administration and genetic liability.10−12 Thus, clinicians should particularly screen for CU and CUD among youth tobacco users, a conclusion supported by our finding that among youth tobacco users the prevalence of past-year CU increased from 51.9% in 2002 to 57.1% in 2014. Future research is needed to monitor trends in tobacco use among youth and whether the prevalence of CU will continue to decline among youth or will begin to parallel the increase among adults.19
The prevalence of past-year CUD among youth users decreased from 27.0% in 2002 to 20.4% in 2014. It was lower in 2013–2014 compared to 2002, even after controlling for sociodemographic factors, substance use factors, and risk perceptions of CU. Unlike its association with the decline in CU, tobacco use was not associated with the decline in CUD, suggesting that tobacco use may be related to CU among youth but not its progression to CUD among youth users. Future studies are needed to better understand why youth cannabis users were less likely to have CUD during 2013–2014 than in 2002.
A recent study showed non-Hispanic black youth tend to view CU favorably.32 We found that prevalences of past-year CU and CUD were higher among racial/ethnic minorities (except non-Hispanic Asians and Hawaiians or Pacific Islanders for CU) than non-Hispanic whites. These results diverge from earlier work among adults,17 but were similar to findings from recent studies among adults18–19 and among those aged 12 or older,20 suggesting a shifting racial/ethnic pattern of CU and CUD in the U.S.5 Previous studies also found gender differences in pathways to CU among youth:21–23 Females tended to be at higher risk for initiating CU at younger ages22 and had a faster transition from initiation of CU to regular use.23 However, our study found no gender differences in prevalences of past-year CU and CUD suggesting a shifting gender pattern of CU and CUD. Additionally, insignificant interaction effects between year and race/ethnicity and between year and gender on CU and CUD suggested that effect sizes of these associations remained unchanged during 2002–2014. Thus, our findings underscore the importance of clinicians screening for CU and CUD among minority youth and among both male and female youth. Future research needs to continue to monitor race/ethnic and gender patterns of CU and CUD.
CU has adverse sequelae, including deleterious effects on brain development and school performance, mental health problems, and addictions.6–7 Consistent with previous research,12, 37–40 our study identified associations of CU and CUD with tobacco, alcohol, and other substance use and the association between CUD and depression, suggesting that use of multiple substances and comorbidity with psychiatric illness are common among youth cannabis users. Identification of one of the psychiatric and behavioral problems should prompt clinicians to carefully probe for other related problems.12, 41–43
This study has several limitations. NSDUH does not cover homeless youth not living in shelters or youth residing in institutions. Furthermore, NSDUH does not ascertain use of electronic cigarettes, which have become common among youth.16 However, our results are consistent with trends found in other surveys.16Also, because of the cross-sectional nature of NSDUH data, this study could not establish temporal or causal relationships. Finally, NSDUH is a self-reported survey and is subject to recall bias.
CONCLUSIONS
In the U.S., compared to 2002, even after adjusting for covariates, the prevalence of past-year CU decreased among youth during 2005–2014, and the prevalence of past-year CUD declined among youth users during 2013–2014 compared to 2002. Associations between declines in tobacco use and decreases in CU may suggest the importance of tobacco control and prevention among U.S. youth. Past-year CU and CUD were higher among racial/ethnic minorities (except for non-Hispanic Asians and Hawaiians or Pacific Islanders for CU) than non-Hispanic whites and were similar between male and female youth. Co-occurrence of CU and CUD with other substance use and depression highlights the importance of screening across the full range of behavioral health issues.
CLINICAL POINTS:
In the U.S., compared to 2002, the adjusted prevalence of past-year cannabis use decreased among youth during 2005–2014, and the adjusted prevalence of past-year cannabis use disorders declined among youth users during 2013–2014.
The association between declines in tobacco use and decreases in cannabis use may suggest the importance of tobacco control and prevention among U.S. youth.
Acknowledgments
Human Participation Protection: The data collection protocol of the National Survey on Drug Use and Health was approved by the Institutional Review Board at the RTI International.
Footnotes
Conflict of Interest Disclosures: Dr. Compton reports ownership of stock in General Electric Co., 3M Co., and Pfizer Inc., unrelated to the submitted work. Drs. Han, Jones, and Blanco have no conflicts to disclose.
Disclaimers: The findings and conclusions of this study are those of the authors and do not necessarily reflect the views of the Substance Abuse and Mental Health Services Administration, the National Institute on Drug Abuse of the National Institutes of Health, or the U.S. Department of Health and Human Services.
REFERENCES
- 1.Pacula RL, Sevigny EL. Marijuana liberalization policies: why we can’t learn much from policy still in motion. J Policy Anal Manage. 2014;33:212–21. [DOI] [PMC free article] [PubMed] [Google Scholar]
- 2.Roy-Byrne P, Maynard C, Bumgardner K, Krupski A, Dunn C, West II, Donovan D, Atkins DC, Ries R. Are medical marijuana users different from recreational users? The view from primary care. Am J Addict. 2015; 24:599–606. [DOI] [PubMed] [Google Scholar]
- 3.ProCon.org. 28 Legal Medical Marijuana States and DC. Last updated on November 9, 2016. http://medicalmarijuana.procon.org/view.resource.php?resourceID=000881. Accessed Nov. 15, 2016.
- 4.Hasin DS, Wall M, Keyes KM, Cerdá M, Schulenberg J, O’Malley PM, Galea S, Pacula R, Feng T. Medical marijuana laws and adolescent marijuana use in the USA from 1991 to 2014: results from annual, repeated cross-sectional surveys. Lancet Psychiatry. 2015; 2:601–8. [DOI] [PMC free article] [PubMed] [Google Scholar]
- 5.Hasin DS, Saha TD, Kerridge BT, Goldstein RB, Chou SP, Zhang H, Jung J, Pickering RP, Ruan WJ, Smith SM, Huang B, Grant BF. Prevalence of marijuana use disorders in the United States between 2001–2002 and 2012–2013. JAMA Psychiatry. 2015;72:1235–42. [DOI] [PMC free article] [PubMed] [Google Scholar]
- 6.Volkow ND, Baler RD, Compton WM, Weiss SRB. Adverse health effects of marijuana use: state of the science. N Eng J Med. 2014;370:2219–2227. [DOI] [PMC free article] [PubMed] [Google Scholar]
- 7.Silins E, Horwood LJ, Patton GC, Fergusson DM, Olsson CA, Hutchinson DM, Spry E, Toumbourou JW, Degenhardt L, Swift W, Coffey C, Tait RJ, Letcher P, Copeland, Mattick RP. Young adult sequelae of adolescent cannabis use: an integrative analysis. Lancet Psychiatry.2014;1:286–2. [DOI] [PubMed] [Google Scholar]
- 8.Kandel DB, editor. Stages and pathways of drug involvement: Examining the gateway hypothesis. Cambridge, UK: Cambridge University Press; 2002. [Google Scholar]
- 9.Patton GC, Coffey C, Carlin JB, Sawyer SM, Lynskey M. Reverse gateways? Frequent cannabis use as a predictor of tobacco initiation and nicotine dependence. Addiction. 2005; 100:1518–25. [DOI] [PubMed] [Google Scholar]
- 10.Agrawal A, Silberg JL, Lynskey MT, Maes HH, Eaves LJ. Mechanisms underlying the lifetime co-occurrence of tobacco and cannabis use in adolescent and young adult twins. Drug Alcohol Depend. 2010; 108:49–55. [DOI] [PMC free article] [PubMed] [Google Scholar]
- 11.Chen X, Williamson VS, An S-S, Hettema JM, Aggen SH, Neale MC, et al. Cannabinoid receptor 1 gene association with nicotine dependence. Arch Gen Psychiat. 2008; 65:816–24. [DOI] [PMC free article] [PubMed] [Google Scholar]
- 12.Peters EN, Budneyb AJ, Carrollc KM. Clinical correlates of co-occurring cannabis and tobacco use: A systematic review. Addiction. 2012; 107:1404–1417. [DOI] [PMC free article] [PubMed] [Google Scholar]
- 13.Keyes KM, Schulenberg JE, O’Malley PM, Johnston LD, Bachman JG, Li G, Hasin D. The social norms of birth cohorts and adolescent marijuana use in the United States, 1976–2007. Addiction. 2011;106:1790–800. [DOI] [PMC free article] [PubMed] [Google Scholar]
- 14.Salas-Wright CP, Vaughn MG, Todic J, Córdova D, Perron BE. Trends in the disapproval and use of marijuana among adolescents and young adults in the United States: 2002–2013. Am J Drug Alcohol Abuse. 2015;41:392–404. [DOI] [PMC free article] [PubMed] [Google Scholar]
- 15.Bachman JG, Johnson LD, O’Malley PM. Explaining recent increases in students’ marijuana use: impacts of perceived risks and disapproval, 1976 through 1996. Am J Public Health. 1998;88:887–892. [DOI] [PMC free article] [PubMed] [Google Scholar]
- 16.Johnston LD, O’Malley PM, Miech RA, Bachman JG, & Schulenberg JE. Monitoring the Future national survey results on drug use: 1975–2014: Overview, key findings on adolescent drug use. Ann Arbor: Institute for Social Research, the University of Michigan. 2015. [Google Scholar]
- 17.Compton WM, Grant BF, Colliver JD, Glantz MD, Stinson FS. Prevalence of marijuana use disorders in the United States: 1991–1992 and 2001–2002. JAMA. 2004; 291:2114–21. [DOI] [PubMed] [Google Scholar]
- 18.Wu LT, Zhu H, Swartz MS. Trends in cannabis use disorders among racial/ethnic population groups in the United States. Drug Alcohol Depend. 2016;165:181–90. [DOI] [PMC free article] [PubMed] [Google Scholar]
- 19.Compton WM, Han B, Jones CM, Blanco C, Hughes A. Marijuana use and use disorders in adults in the USA, 2002–14: analysis of annual cross-sectional surveys. Lancet Psychiatry. 2016; 3(10):954–964. [DOI] [PubMed] [Google Scholar]
- 20.Wu LT, Brady KT, Mannelli P, Killeen TK; NIDA AAPI Workgroup. Cannabis use disorders are comparatively prevalent among nonwhite racial/ethnic groups and adolescents: a national study. J Psychiatr Res. 2014;50:26–35. [DOI] [PMC free article] [PubMed] [Google Scholar]
- 21.Brook JS, Brook DW, De La Rosa M, Duque LF, Rodriguez E, Montoya ID, Whiteman M. Pathways to marijuana use among adolescents: cultural/ecological, family, peer, and personality influences. J Am Acad Child Adolesc Psychiatry. 1998;37:759–66. [PubMed] [Google Scholar]
- 22.Buu A, Dabrowska A, Mygrants M, Puttler LI, Jester JM, Zucker RA. Gender differences in the developmental risk of onset of alcohol, nicotine, and marijuana use and the effects of nicotine and marijuana use on alcohol outcomes. J Stud Alcohol Drugs. 2014;75:850–8. [DOI] [PMC free article] [PubMed] [Google Scholar]
- 23.Schepis TS, Desai RA, Cavallo DA, Smith AE, McFetridge A, Liss TB, Potenza MN, Krishnan-Sarin S. Gender differences in adolescent marijuana use and associated psychosocial characteristics. J Addict Med. 2011;5: 65–73. [DOI] [PMC free article] [PubMed] [Google Scholar]
- 24.Cavazos-Rehg PA, Krauss M, Fish SL, Salyer P, Grucza RA, Bierut LJ. Twitter chatter about marijuana. J Adolesc Health. 2015; 56: 139–145. [DOI] [PMC free article] [PubMed] [Google Scholar]
- 25.Han B, Compton WM, Jones CM, Cai R. Nonmedical prescription opioid use and use disorders among adults aged 18 through 64 years in the United States, 2003–2013. JAMA. 2015;314:1468–78. [DOI] [PubMed] [Google Scholar]
- 26.Substance Abuse and Mental Health Services Administration: National Survey on Drug Use and Health. http://www.samhsa.gov/data/population-data-nsduh/reports . Also at http://www.samhsa.gov/data/sites/default/files/NSDUH-DetTabs2014/NSDUH-DetTabs2014.htm. Accessed September 28, 2015.
- 27.American Association for Public Opinion Research. Standard definitions: Final dispositions of case codes and outcome rates for surveys, 8th edition Lenexa, KS: Author; 2015. Pages 52–53. [Google Scholar]
- 28.American Psychiatry Association: Diagnostic and Statistical Manual of Mental Disorders (4th ed.). Washington DC. 1994. [Google Scholar]
- 29.Grucza RA, Abbacchi AM, Przybeck TR, Gfroerer JC. Discrepancies in estimates of prevalence and correlates of substance use and disorders between two national surveys. Addiction. 2007;102:623–629. [DOI] [PMC free article] [PubMed] [Google Scholar]
- 30.Substance Abuse and Mental Health Services Administration. Reliability of Key Measures in the National Survey on Drug Use and Health (Office of Applied Studies, Methodology Series M-8, HHS Publication No. SMA 09–4425). Rockville, MD. 2010. [PubMed] [Google Scholar]
- 31.Jordan BK, Karg RS, Batts KR, Epstein JF, Wiesen C. A clinical validation of the National Survey on Drug Use and Health assessment of substance use disorders. Addict Behav. 2008;33:782–98. [DOI] [PubMed] [Google Scholar]
- 32.Kim HJ, Fay MP, Feuer EJ, Midthune DN. Permutation tests for joinpoint regression with applications to cancer rates. Stat Med. 2000;19:335–51. [DOI] [PubMed] [Google Scholar]
- 33.Research Triangle Institute. SUDAAN Release 11.0.1. Research Triangle Park, NC: RTI International; 2015. [Google Scholar]
- 34.Bieler GS, Brown GG, Williams RL, Brogan DL. Estimating model-adjusted risks, risk differences, and risk ratio from complex survey data. Am J Epidemiol. 2010; 171:618–623. [DOI] [PubMed] [Google Scholar]
- 35.Substance Abuse and Mental Health Services Administration. Results from the 2010 National Survey on Drug Use and Health: Mental Health Findings, NSDUH Series H-42, HHS Publication No. (SMA) 11–4667. Rockville, MD: Substance Abuse and Mental Health Services Administration, 2012. [Google Scholar]
- 36.U.S. Department of Health and Human Services. The Health Consequences of Smoking—50 Years of Progress: A Report of the Surgeon General. Atlanta, GA: U.S. Department of Health and Human Services, Centers for Disease Control and Prevention, National Center for Chronic Disease Prevention and Health Promotion, Office on Smoking and Health; 2014. [Google Scholar]
- 37.Rolle IV, Kennedy SM, Agaku I, Jones SE, Bunnell R, Caraballo R, Xu X, Schauer G, McAfee T. Cigarette, cigar, and marijuana use among high school students - United States, 1997–2013. MMWR Morb Mortal Wkly Rep. 2015; 64:1136–41. [DOI] [PubMed] [Google Scholar]
- 38.Lopez MF, Compton WM, Volkow ND. Changes in cigarette and illicit drug use among US teenagers. Arch Pediatr Adolesc Med. 2009;163:869–70. [DOI] [PMC free article] [PubMed] [Google Scholar]
- 39.Schauer GL, Berg CJ, Kegler MC, Donovan DM, Windle M. Assessing the overlap between tobacco and marijuana: trends in patterns of co-use of tobacco and marijuana in adults from 2003–2012. Addictive Behaviors. 2015;49:26–32. [DOI] [PubMed] [Google Scholar]
- 40.Degenhardt L, Hall Lynskey M. The relationship between cannabis use and other substance use in the general population. Drug Alcohol Depend. 2001;64:319–327. [DOI] [PubMed] [Google Scholar]
- 41.Dawson DA, Compton WM, Grant BF. Frequency of 5+/4+ Drinks as a screener for drug use and drug use disorders. J Stud Alcohol Drugs. 2010; 71:751–760. [DOI] [PMC free article] [PubMed] [Google Scholar]
- 42.Compton WM, Blanco C, Wargo EM. Integrating addiction services into general medicine. JAMA. 2015; 314:2401–2. [DOI] [PubMed] [Google Scholar]
- 43.Center for Substance Abuse Treatment. A Guide to Substance Abuse Services for Primary Care Clinicians. Treatment Improvement Protocol (TIP) Series, No. 24 Substance Abuse and Mental Health Services Administration, DHHS Publication No. (SMA) 97–3139. Washington, DC: U.S. Government Printing Office, 1997. [PubMed] [Google Scholar]