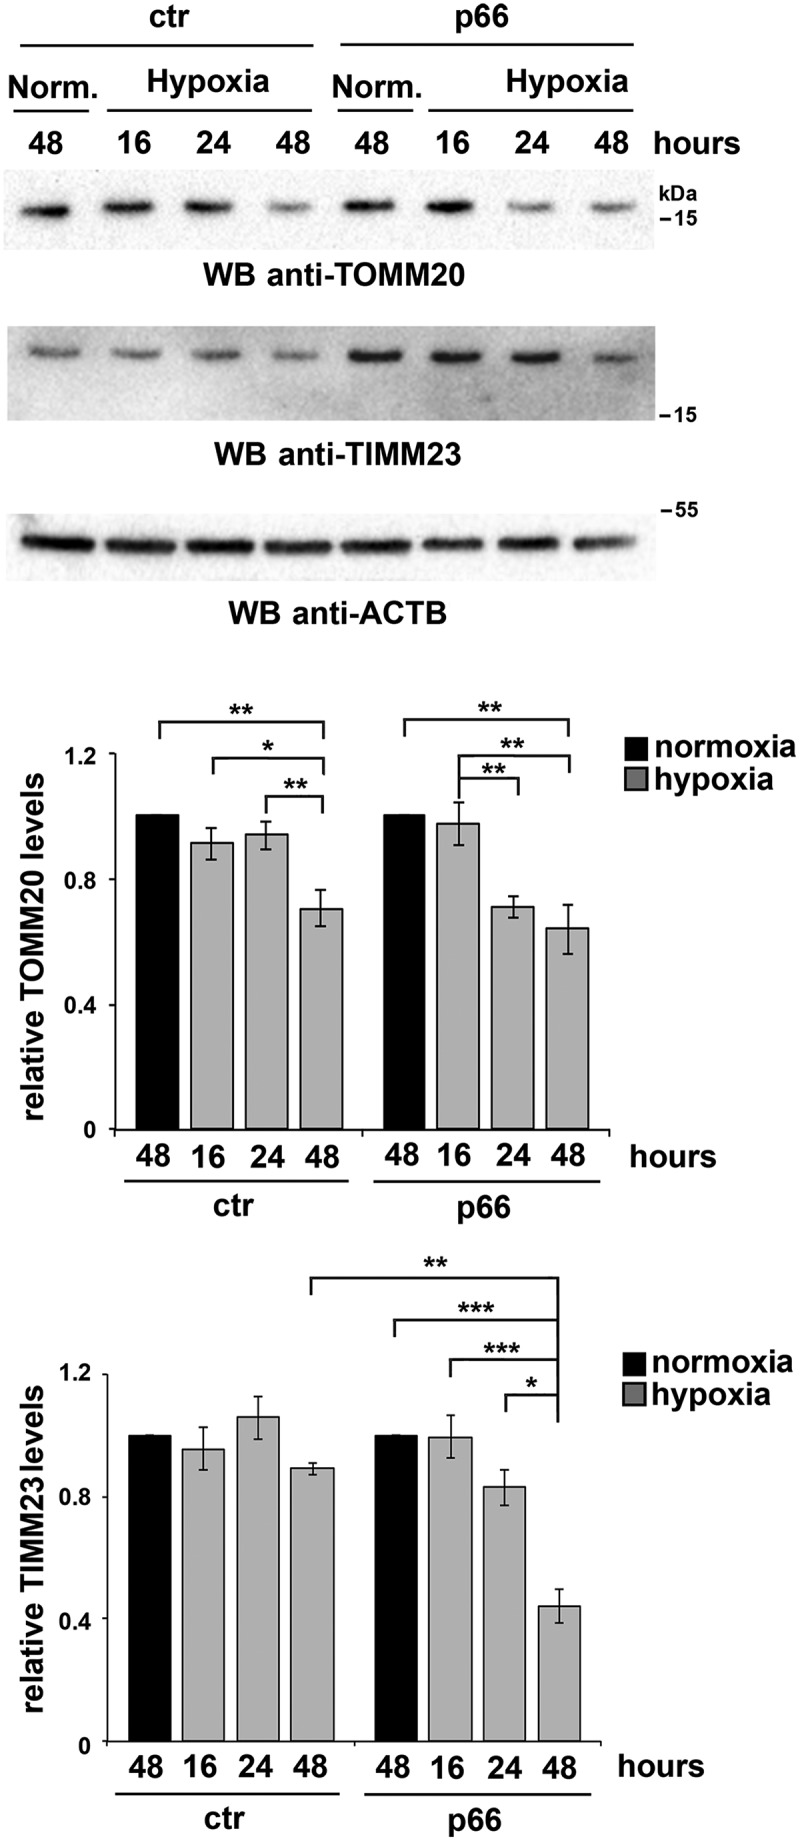
Figure 7.

p66SHC promotes hypoxia-induced mitophagy in B cells. Immunoblot analysis of TIMM23 and TOMM20 in ctr or MEC transfectants expressing wild-type p66SHC (p66), under normoxic (Norm.) or hypoxic conditions (8–48 h 1% O2). ACTB was used as a loading control. The histograms in the lower part show the quantification of the relative TIMM23 and TOMM20 levels in each transfectant over time (n = 3). The levels of TOMM20 are comparable in ctr and p66 cells under normoxia, while the levels of TIMM23 are 2.4 ± 0.3 fold (mean± SD, n = 3) higher in p66 cells compared to ctr cells under the same conditions. The data are expressed as mean± SD. ***P ≤ 0.001; **P ≤ 0.01; *P ≤ 0.05 (one-way ANOVA).
