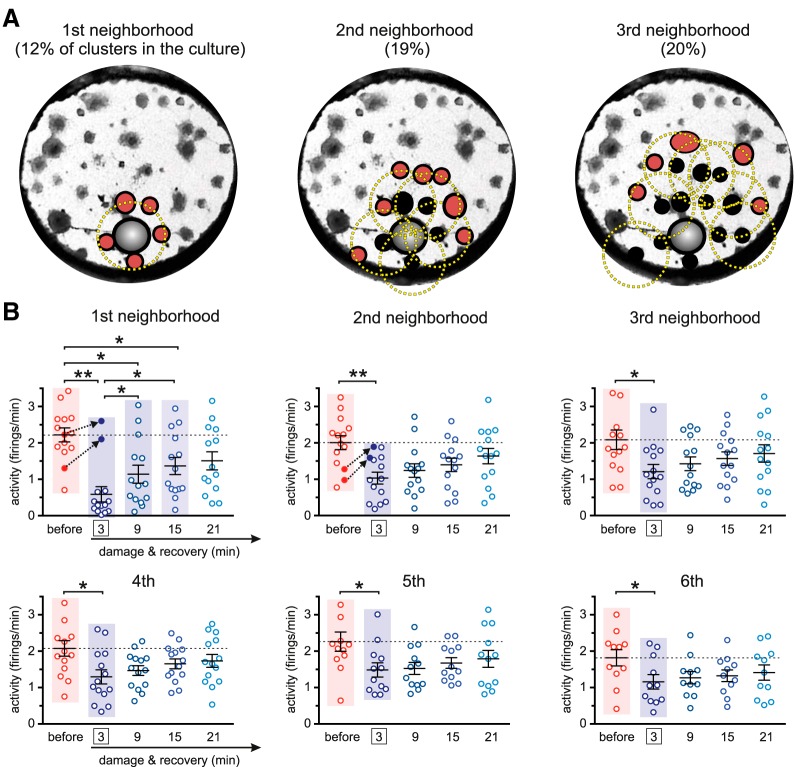
Figure 4.
Spontaneous activity in the neighborhood of damage. A, Construction of the ring of neighbors for a representative culture. The first neighborhood ring (red clusters) is constituted by all clusters whose centers fall within a distance mm (yellow circle) from the ablated cluster (gray). The second and subsequent rings are built by identifying the clusters that are neighbors of the clusters in the previous ring according to the same distance RC. B, Box plots showing the temporal evolution of the average activity in six neighborhoods and for the 14 experimental realizations. Before damage, activity is averaged over 30 min. The indicated times correspond to the center of the analysis windows t. For damage (at t = 3 min, boxed) and subsequent recovery stages, activity is averaged in 6-min windows. Dotted black arrows highlight two experiments whose activity boosted up after damage. Average values of the distributions are shown as mean ± SD. The colored panels highlight the distributions that are significantly different according to a one-way ANOVA (*p < 0.05, **p < 0.01).

