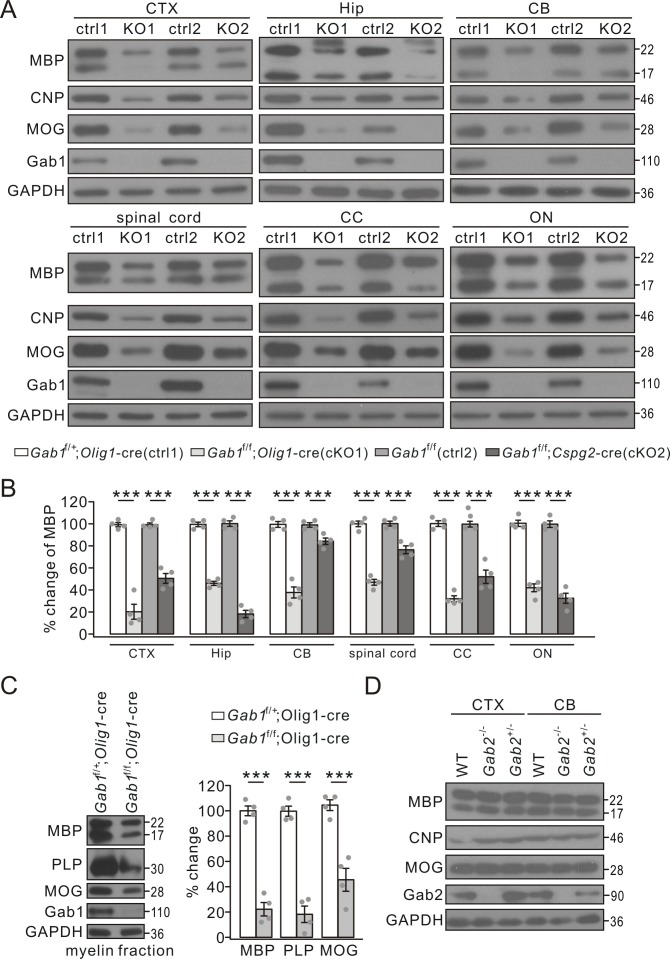
Figure 4. The reduced expression of myelin-related proteins in conditional Gab1 knockout mice.
(A) Western blots of myelin proteins in the cerebral cortex (CTX), the hippocampus (Hip), the cerebellum (CB), spinal cord, the corpus callosum (CC), and optic nerve (ON) from Gab1f/+;Olig1-cre (ctrl1) vs. Gab1f/f;Olig1-cre (KO1) mice or Gab1f/f (ctrl2) vs. Gab1f/f;Cspg2-cre (KO2) mice at P21. (B) MBP expression was normalized to GAPDH and percentage changes are shown. In the order of ctrl1, KO1, ctrl2, and KO2, changes are: CTX, 100 ± 2% and 20 ± 8% (p=0.000030), 100 ± 2% and 51 ± 5% (p=0.000051); Hip, 100 ± 2% and 46 ± 2% (p=0.000001), 100 ± 3% and 18 ± 4% (p=0.000001); CB, 100 ± 3% and 38 ± 6% (p=0.000034), 100 ± 2% and 84 ± 3%(p=0.0058); spinal cord, 100 ± 3% and 47 ± 3% (p=0.000007), 100 ± 3% and 76 ± 4% (p=0.0013); CC, 100 ± 3% and 32 ± 3% (p=0.000002), 100 ± 3% and 52 ± 7%(p=0.00036); ON, 100 ± 3% and 42 ± 4% (p=0.000014), 100 ± 3% and 33 ± 5% (p=0.000017). n = 4/group. t-test, df = t(7). (C) Myelin proteins in myelin fractions of corpus callosum from Gab1f/+;Olig1-cre and Gab1f/f;Olig1-cre mice at P60. GAPDH was internal control. Expressions of MBP, PLP and MOG were normalized to corresponding GAPDH and the percentage changes are shown. MBP: 100 ± 4% (Gab1f/+;Olig1-cre) and 23 ± 6% (Gab1f/f;Olig1-cre) (p=0.000023). PLP: 100 ± 4% (Gab1f/+;Olig1-cre) and 18 ± 7% (Gab1f/f;Olig1-cre) (p=0.000039). MOG: 100 ± 5% (Gab1f/+;Olig1-cre) and 45 ± 10% (Gab1f/f;Olig1-cre) (p=0.0011). n = 4/group, t-test, df = t(7). (D) Western blots of myelin proteins in the cerebral cortex (CTX) and the cerebellum (CB) from WT, Gab2-/- and Gab2+/- mice at P21. The experiment was repeated four times. Gray dots indicate individual data points. ***p<0.01.


