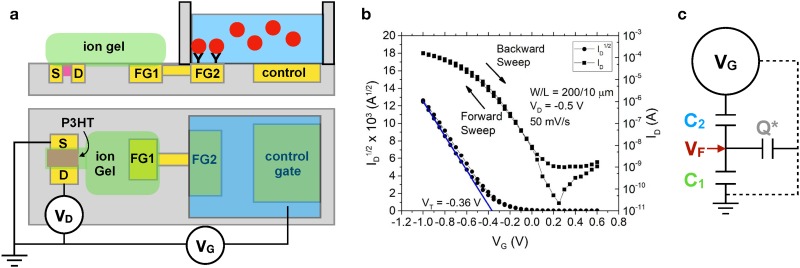
FIG. 4.
Model for EGT detection. (a) Schematic illustration of an EGT sensor using a static fluid reservoir. The P3HT is printed first to connect the source and drain electrodes, and the ion gel is printed second to connect the P3HT to the left arm of the floating gate (FG1). The floating gate extends into the aqueous environment, such that the right arm of the floating gate (FG2) can be functionalized for sensing. (b) Example of a transfer curve obtained by sweeping the control gate voltage, , at a rate of 50 mV/s and measuring the drain current, .34 The parameters and refer to the dimensions of the printed P3HT semiconductor. Reproduced with permission from Thomas et al., J. Phys. Chem. Lett. 9, 1335 (2018). Copyright 2018 American Chemical Society. (c) Model for the EGT sensor. The quantities and refer to the lumped capacitance of the EGT portion of the device and the aqueous portion of the device, respectively. Fitting the experimental data requires accounting for an additional parasitic capacitance via the stored charge . The model provides an approach to relate the applied gate voltage, , to the voltage at the floating gate.

