

Abstract
Background
Physical activity (PA) breaks in sitting time might attenuate metabolic markers relevant to the prevention of type 2 diabetes.
Objectives
The primary aim of this paper was to systematically review and meta-analyse trials that compared the effects of breaking up prolonged sitting with bouts of PA throughout the day (INT) versus continuous sitting (SIT) on glucose, insulin and triacylglycerol (TAG) measures. A second aim was to compare the effects of INT versus continuous exercise (EX) on glucose, insulin and TAG measures.
Methods
The review followed the Preferred Reporting Items for Systematic Reviews and Meta-analyses (PRISMA) recommendations. Eligibility criteria consisted of trials comparing INT vs. SIT or INT vs. one bout of EX before or after sitting, in participants aged 18 or above, who were classified as either metabolically healthy or impaired, but not with other major health conditions such as chronic obstructive pulmonary disease or peripheral arterial disease.
Results
A total of 42 studies were included in the overall review, whereas a total of 37 studies were included in the meta-analysis. There was a standardised mean difference (SMD) of − 0.54 (95% CI − 0.70, − 0.37, p = 0.00001) in favour of INT compared to SIT for glucose. With respect to insulin, there was an SMD of − 0.56 (95% CI − 0.74, − 0.38, p = 0.00001) in favour of INT. For TAG, there was an SMD of − 0.26 (95% CI − 0.44, − 0.09, p = 0.002) in favour of INT. Body mass index (BMI) was associated with glucose responses (β = − 0.05, 95% CI − 0.09, − 0.01, p = 0.01), and insulin (β = − 0.05, 95% CI − 0.10, − 0.006, p = 0.03), but not TAG (β = 0.02, 95% CI − 0.02, 0.06, p = 0.37). When energy expenditure was matched, there was an SMD of − 0.26 (95% CI − 0.50, − 0.02, p = 0.03) in favour of INT for glucose, but no statistically significant SMDs for insulin, i.e. 0.35 (95% CI − 0.37, 1.07, p = 0.35), or TAG i.e. 0.08 (95% CI − 0.22, 0.37, p = 0.62). It is worth noting that there was possible publication bias for TAG outcomes when PA breaks were compared with sitting.
Conclusion
The use of PA breaks during sitting moderately attenuated post-prandial glucose, insulin, and TAG, with greater glycaemic attenuation in people with higher BMI. There was a statistically significant small advantage for PA breaks over continuous exercise for attenuating glucose measures when exercise protocols were energy matched, but no statistically significant differences for insulin and TAG. PROSPERO Registration: CRD42017080982.
PROSPERO Registration
CRD42017080982.
Electronic supplementary material
The online version of this article (10.1007/s40279-019-01183-w) contains supplementary material, which is available to authorized users.
Key Points
| Breaking up sitting with physical activity (PA) moderately attenuated post-prandial glucose and insulin, with a small effect size attenuation for TAG. |
| There was greater glycaemic attenuation in people with higher body mass index (BMI). |
| PA breaks were slightly more effective for glycaemic attenuation compared to one continuous bout of PA when experimental conditions were energy expenditure matched. |
Introduction
Rationale
Increasing physical activity (PA) [1] and both decreasing and interrupting “sedentary behaviour” are emphasised in public health guidelines [2]. “Sedentary behaviour” (SB) is any seated or reclining behaviour, whilst awake, with energy expenditure (EE) at or below 1.5 metabolic equivalents (METs) [3, 4], such as sitting in the office. The UK Department of Health [2] recommends breaking up long periods of sitting during working hours and interrupting sedentary time. Australia’s Department of Health [5] recommends interrupting long sitting periods, although no quantitative threshold is specified.
A systematic review and meta-analysis of cross-sectional observational and laboratory-based experimental studies on the effects of breaks in SB [6] concluded that walking-based light-intensity physical activity (LIPA) and moderate intensity physical activity (MPA) breaks resulted in significant reductions in post-prandial glucose and insulin. Physical activity (PA) breaks in sitting were also more effective than one continuous bout of exercise on glucose. Nonetheless because this review only included five studies on glucose, published between 2011 and 2014, some relevant earlier studies [7–12] and more recent studies [13–22] might have been omitted or missed. There was no date restriction in Benatti et al. [23] but no meta-analysis was performed. Therefore, the magnitude and moderators of PA breaks on metabolic variables compared to sitting were not quantitatively assessed. It also remains to be established if PA breaks influence metabolic markers in a different way to structured continuous exercise, and thus confer a different benefit to structured continuous exercise. Recently, the United States of America Physical Activity Guidelines Advisory Committee in its Scientific Report to the Secretary of Health and Human Services stated a need for randomised controlled trials to test the effects of interventions to replace time spent in SB with PA [24]. Therefore, an updated meta-analysis of such existing trials, in adults, whether healthy or with type 2 diabetes, that can be used as part of the development of public health guidelines, is apposite.
Accordingly, there is scope for a new systematic review and meta-analysis of the experimental literature on the metabolic effects of interruptions of prolonged sitting with PA breaks, as an important contributor to the evidence pool used to develop, update, and refine public health guidance.
Objective
The primary aim was to systematically review and meta-analyse that studied the effects of controlled trials breaking up prolonged sitting with PA breaks throughout the day compared with prolonged sitting on glucose, insulin and TAG. A secondary aim was to systematically review and meta-analyse controlled trials that compared the effects of PA breaks against continuous exercise on glucose, insulin and TAG.
Methods
The review adhered to PRISMA recommendations [25, 26], and is registered at the International Prospective Register of Systematic Reviews (PROSPERO) (identification code: CRD42017080982).
Search Strategy
Firstly, a systematic database search of PubMed, OvidSP, Journals@Ovid and PsycINFO, Science Direct, and SPORTDiscus, was conducted on 04/03/2017. The search was subsequently updated on 03/07/2018. Search terms were collated into four broad categories, based on the PICOT (population, intervention, comparison, outcome, time) format [26, 27]: setting (“sedentary behaviour”), intervention (“physical activity”), intervention type/comparison (“breaks”), outcomes (“glucose”) [28]. Full search details terms for all databases searched are provided in Electronic Supplementary Material Appendix S1.
Additionally, a hand search of the reference lists of articles included in the final analysis that were identified via the database search was conducted, as were the first 20 “related articles”, via the “related articles” link on PubMed, of those included database search articles. A hand search of other reviews, commentaries, letters, PhD dissertations, and reference lists of original articles was also conducted.
Study Selection
Studies were then selected according to the following inclusion and exclusion criteria. Studies were included if they fulfilled all of the following criteria, with PICOT categories in parentheses where appropriate:
Participants aged 18 years or above (population).
Included as an outcome at least one measure of continuous glucose monitoring system or blood glucose, insulin or TAG measures, such as area under the curve (outcomes).
Studies with participants with type 2 diabetes (T2D), prediabetes, impaired fasting glucose (IFG) or obesity (population). Type 2 diabetics were included as the outcome variables assessed, specifically glucose and insulin are of direct relevance to type 2 diabetes. Additionally, the daily habitual PA of type 2 diabetics is not influenced by their condition.
Published peer reviewed prospective intervention studies, assessing explicitly breaking up sitting time with some form of physical activity (intervention), such that there would either be: (a) at least one condition in which a bout of continuous prolonged sitting (comparison) occurred, and another condition in which such sitting was intermittently broken up with multiple PA bouts spread throughout the sitting bout (intervention); or (b) one condition in which a bout of continuous prolonged sitting was broken up with multiple PA bouts spread throughout the sitting bout (intervention) and one condition in which there was a continuous bout of exercise performed during a sitting bout (intervention). One bout of continuous exercise was defined as one continuous non-stop bout of exercise without any rest periods in between. A sitting bout was defined as a bout in which continuous prolonged sitting occurred, such that participants were reported to be sitting or sedentary or rested in the laboratory.
The study attempted to control for/manipulating sitting and PA break conditions, with the sitting (comparison) and PA breaks protocol (intervention) was clearly reported.
Different conditions in cross-over trials conducted separately on different days, to minimise carryover effects (comparison).
Trials in which the PA breaks and sitting bouts protocol was not controlled or clearly reported were included in the narrative review, but not meta-analysed.
English language articles.
Studies were excluded if they met any of the following criteria:
Different trial conditions were performed on the same day, without a washout period.
If the study included an experimental condition comparing a continuous exercise bout against a sitting bout condition, but no condition in which sitting was broken up with multiple short physical activity bouts.
No attempt was made to control for sitting bouts, for example, if participants during an exercise trial condition were permitted to be absent from the laboratory when not exercising, or if the sitting and breaks protocol was not monitored to adhere to an explicitly reported protocol. However, such studies were included in the narrative summary, but not the meta-analysis.
The only intervention used to interrupt sitting was standing, as standing may have minimal impact on EE compared to sitting activities [29, 30]. Furthermore, it has been reported that inter-individual heterogeneity in EE during standing might be due to leg or body displacement, such that heterogeneity in effectiveness of standing interventions might be due to such variations [29, 30]. Additionally, normal weight men and women, BMI: 22.5 ± 1.5 kg/m2, had higher leg muscle activity during sitting compared to the overweight, BMI: 28.4 ± 2.9 kg/m2. Conversely, leg muscle activity was higher in overweight adults during standing [31]. Thus, standing studies were excluded.
Reused data from a previous study, without containing any new measurements for at least one of glucose, insulin or TAGs.
Participants were from special/clinical populations, for example patients with peripheral arterial disease or chronic obstructive pulmonary disease. Studies with participants with chronic obstructive pulmonary disease (COPD) or peripheral arterial disease (PAD) were excluded as the aim of the meta-analysis was not to assess the effects of physical activity breaks on rehabilitation, especially rehabilitation from cardiopulmonary disease or cancer.
Commentaries, letters, reviews, conference abstracts, poster abstracts, theses or dissertations.
Non-English articles.
Studies were independently assessed for inclusion by two reviewers, RL, DF, with disagreements resolved via discussion. The reviewers, RL, DF, were not blinded to authors, institutions or journals of publication. If a decision on whether to include or exclude a paper could not be made from the title and abstract, the full text was obtained and checked. The flow diagram for the search process is presented in Fig. 1. A complete list of excluded studies, with reasons for exclusion, is available upon request.
Fig. 1.

Modified PRISMA flow diagram for included and excluded studies
Data Extraction
Data from included studies were extracted (by RL) for first author name, publication date, participant characteristics, full description of the PA and sitting intervention protocol and outcomes. Outcomes extracted for the narrative review were measures of glucose, insulin, triacyglycerol, c-peptide, non-esterified fatty acids (NEFA), cholesterol, lipoproteins from blood whether plasma, serum or whole, and blood pressure.
Risk of Bias Assessment
The Cochrane Collaboration’s risk of bias (RoB) tool [32] was used to aid in assessing the RoB in individual studies. Components were assessed independently, with no overall composite score assigned, as per PRISMA [25, 26] and Cochrane collaboration [32, 33] recommendations. Washout period for crossover studies was used for the “other” sources of bias component. Each component rated was as “high risk” or “low risk”. If details for a particular domain were insufficient, the risk of bias was assessed as “unclear”. Assessments were performed independently by two authors (RL, DF) with disagreements resolved by discussion, and then arbitration (HJM) if necessary.
Data Synthesis
A narrative overview provided in text and tables summarises study characteristics. The narrative synthesis includes studies in which PA break or sitting protocols were not strictly controlled to provide a broader summary of the literature, whereas only controlled laboratory studies were statistically meta-analysed.
C-peptide, blood pressure, NEFA, cholesterol and lipoprotein outcomes were not meta-analysed because few studies had these variables as outcomes. Studies with glucose, insulin and TAG measures were meta-analysed. Interstitial glucose data via continuous glucose monitoring system (CGMS), if available, were extracted for the meta-analysis as a first preference over post-prandial measures of venous or capillary blood glucose, as continuous glucose data, as opposed to the snapshot nature of venous or capillary blood draw, provides a more comprehensive view of glucose responses, that is not dependent on the blood draw schedule. Incremental area under the curve (iAUC) for glucose, insulin, TAG was meta-analysed in preference to total area under the curve (tAUC), as iAUC is the recommended measure for detecting differences in post-prandial responses [34–36]. Data from prior studies that were reanalysed, combined for reanalysis, and reported in a later study were not extracted. If a later publication reported a new measure of, for example glucose, obtained from the same experimental conditions as a prior publication, CGMS glucose was used as the first preference, if available. If this was not available, post-prandial iAUC was used, followed by tAUC.
Means, standard deviations or standard errors or 95% confidence intervals (CI) were extracted from individual studies and used to calculate standardised mean differences (SMD) using DerSimonian and Laird random-effects models [33]. Continuous outcomes were analysed using SMD to account for different measurement scales [37], tAUC or iAUC over different time scales. When multiple exercise conditions were used in a study, data for all relevant conditions were synthesised and reported separately in the appropriate meta-analysis.
If a study contained more than 2 trial arms, and a control comparison condition was used twice in the meta-analysis, the sample size for the control condition was divided by the number of times the control condition was used [33]. If means were not reported, and medians were reported instead, the study was not meta-analysed. Pooled continuous data were expressed as SMD with 95% CI. SMDs were interpreted according to Cohen [38]: 0.2 represents a small effect, 0.5 a moderate effect, and 0.8 a large effect.
Missing Data
When required outcome data for glucose, insulin and TAG were not available in the full text, but data were presented graphically, an attempt was made to digitise the graph. If this was not possible, the original authors were contacted. If data still could not be obtained successfully, the affected study was omitted from the meta-analysis, and the results summarised in the narrative review.
Assessment of Heterogeneity
Statistical heterogeneity was tested with the Chi-square test (p < 0.05) and I2 statistic (0–40%: might not be important; 30–60%: may represent moderate heterogeneity; 50–90%: may represent substantial heterogeneity; 75–100%: considerable heterogeneity) [33].
Subgroup Analysis
Subgroup analysis for TAG was pre-specified [33] according to whether the experimental condition was performed on 1 day, or over multiple days, as there is considerable evidence that the effects of exercise on TAG peak approximately 18 h post-exercise [39, 40]. Usual PA, body mass index, cardio-respiratory fitness (CRF) or insulin resistance status of participants was selected as another subgroup characteristic, given that metabolic responses to exercise might be affected by CRF or insulin sensitivity status [41–44], with one subgroup consisting of studies that assessed participants who were physically inactive, or sedentary, or were overweight/obese or had type 2 diabetes or impaired fasting glucose, and the other subgroup containing physically active participants. “Physically active” was defined as either exceeding the recommended 150 min of moderate to vigorous physical activity (MVPA) per week, or reported as “recreationally active” [7, 8, 45]. “Sedentary” was defined as not working in a non-sedentary job [46], exceeding 5 h of sitting time per day [15, 22, 47], or any study that defined participants as sedentary. If a study did not report the PA, body mass or health status of participants, it was omitted from the subgroup analysis. Subgroup analysis was also performed for sex, as sex might affect metabolic responses to exercise, feeding, and metabolic health [48–51], possibly due to the effects of sex hormones such as oestrogen [52]. As EE of exercise might affect results, subgroup analysis was also performed to determine whether EE between conditions was matched when comparing PA breaks with continuous exercise.
Meta-regression
Meta-regression was only performed, to explore the possible effects of any explanatory variable on differences in post-prandial glucose, if at least ten studies were included in the meta-analysis, as there should be at least ten studies in a meta-regression for each explanatory variable modelled [33]. If there were sufficient studies, a random-effects model was used to assess whether body mass index (BMI) moderates the effect, as evaluated by SMD, of PA breaks compared with sitting, and of PA breaks vs continuous exercise.
Publication Bias
Funnel plots, Begg and Mazumdar’s rank correlation test [53], Egger’s regression test [54] and Rosenthal’s fail-safe N [55] were used to assess publication bias if more than ten studies were included in the meta-analysis [26, 56]. The trim and fill method, with L0 as the estimator [57], was used to estimate “missing” studies, if any, in the funnel plots. The method of Vevea and Woods [58] was used to calculate the modified SMD in the event of severe 2-tailed selection bias.
Statistical Analysis
Graphical representations of potential bias within and across studies are presented using Review Manager 5.3 (RevMan5.3) (Cochrane Collaboration, Copenhagen, Denmark). All statistical calculations for summary measures were analysed in RevMan 5.3 and presented as SMD and 95% CI. Meta-regression and publication bias analyses were performed in R (The R Project for Statistical Computing). Statistical adjustment of SMD for publication bias was performed in SPSS version 23 (IBM Corporation, Armonk, NY, USA) and R, using the macros developed by Field and Gillett [59].
Results
Studies Retrieved
The initial database search was performed on 04/03/2017. Subsequently, the search was updated on 03/07/2018. There were 897 studies in the initial search results after removal of duplicates. 28 studies met the inclusion criteria. In the updated search results, there were 174 studies after removal of duplicates, of which 14 met the inclusion criteria. Therefore, a total of 42 studies were included in the final systematic review, of which 37 were included in the meta-analysis. The results of the systematic search are presented in Fig. 1.
Characteristics of Included Studies
PA Breaks vs No-Exercise Sitting
In total, 42 studies were reviewed. Participants ranged from those with type 2 diabetes [15, 47, 60] to those who were healthy and had relatively high levels of CRF [7, 8, 45]. The number of participants in studies ranged from 9 [45, 61] to 70 [62]. A total number of 620 participants were included in the meta-analysis for glucose outcomes, 523 for insulin outcomes and 360 for TAG outcomes. Participants were from 22.1 [63] to 70.5 years old [64]. Most studies utilised 1 day designs, but some utilised multi-day designs [7–10, 17, 19, 45, 65]. Altenburg et al. (80) was omitted from the meta-analysis, but included in the narrative summary (Table 1) as data were skewed, and might have violated the underlying assumptions of normality of data distribution [33, 66] for the statistical models used in the meta-analyses. Forest plots for TAG outcomes are presented in Figs. 2, 3, Electronic Supplementary Material Appendix S2—Fig. S1; for glucose outcomes in Figs. 4, 5, 6; and for insulin outcomes in Figs. 7, 8, Electronic Supplementary Material Appendix S2—Fig. S2.
Table 1.
Studies comparing PA breaks with sitting
| Study | Participants | Protocol | Outcomes | Results (please see table footnotes for interpretation of results) |
|---|---|---|---|---|
| Altenburg et al. [67] | 5 M 6 W (median, 25%tile–75%tile); age: 21.4 y (19.5–23.1); BMI: 23.2 kg/m2; PA/SB unmentioned | SIT: 1 h baseline + 7 h sitting; INT: sitting (372 min) + 8 min cycling @ 40–60% (52 ± 3.2%) HRR, RPE: 11.2 ± 1.6, hourly (6 × 8) (1st session @ 0 h + 1) | Capillary @ baseline, hourly before exercise: C-peptide, glucose, TAG, HDL-C, LDL-C, TC | C-peptide: INT < SIT; TAG, TC, HDL-C, LDL-C, glucose: ↔ |
| Bailey and Locke [68] | 7 M 3 W (mean ± SE); age: 24 ± 3 y; BMI: 26.5 kg/m2 ± 4.3; healthy, PA unmentioned | SIT: sitting 5 h; STAND: sitting (272 min) +2 min standing every 30 min; WALK: sitting (272 min) +2 min walking (3.2 km/h) every 30 min |
Capillary: baseline, hourly, before exercise: glucose, BP baseline and 5 h for TAG, HDL-C, TC |
Glucose: WALK < STAND and SIT |
| Bailey et al. [13] | Healthy 6 M 7 W (mean ± SD); age: 26.6 ± 8 y, < 150 min/w MVPA), not in non-sedentary job; BF: 24.4% ± 8.2% | SIT: sitting 5 h; LIGHT: sitting (272 min) +2 min walking (3.2 km/h) every 30 min; MOD: sitting (272 min) +2 min walking (5.8–7.9 km/h) every 30 min | Cannula: − 1 h, 0 h, hourly, before exercise: subjective appetite, acylated ghrelin, peptide YY, insulin, glucose | a; Glucose iAUC: men < women in CON; in men, glucose iAUC: MOD < LIGHT, MOD < CON |
| Bailey et al. [63] | 14 M (mean ± SD); age: 22.1 ± 1.2 y, BMI: 25.0 ± 3.1 kg/m2, BF: 17.2 ± 5.5% | SIT + HIGH GI: high GI breakfast + 4 h sitting; SIT + LOW GI: low GI breakfast + 4 h sitting; INT + HIGH GI: high GI breakfast + 2 min walking/20 min (6.5–8.0 km/h, RPE: 12–14); INT + low GI breakfast: high GI breakfast + 2 min moderate walking/20 min (6.5 to 8.0 km/h, RPE: 12–14) | Capillary for glucose: − 15 min, 15, 30, 45, 60, 90, 120, 180, 240 min for glucose; venous: 60 min 120, 180, 240 min for insulin | a |
| Bhammar et al. [69] | 5 M 5 W (mean ± SD); age: M: 31 ± 5 y W: 32 ± 6 y; BMI: M: 30.1 ± 2.3 kg/m2, W: 30.5 ± 6.6 kg/m2; VO2max: M: 34.9 ± 4.0 ml/kg/min, W: 22.8 ± 2.7 ml/kg/min | SIT: 9 h sitting; 2 minMod20: 2min walking at 53 ± 5% HRmax/3 miles/h every 20 min, total 42 min, 240 kcal. 2 minVig60: 2min walking at 79 ± 4% HRmax every hour, total 16 min, 140 kcal; EX: 30 min walking at 71 ± 4% HRmax/56% VO2max/3.3 miles/h, 230 kcal | CGMS. ABP, MAP | a, Systolic ABP, MAP: EX < SIT |
| Blankenship et al. [70] | 2 M 8 W (mean ± SE); age: 51.9 ± 15.4 y; BMI: 31.6 ± 10.0 kg/m2, BF: 42.6 ± 3.3% | EX: 30 min brisk walking, ~ 300 kcal before lunch. FLB: isoenergetic with EX, bouts of sitting ≤ 20 min; FSB: bouts of sitting ≤ 20 min, same number of breaks as FLB but time walking standing reduced to minimise EE | CGMS, catheter for blood, after MMTT at end of day, @ 30, 60, 90, 120 min, for glucose, insulin | Post-prandial glucose and insulin AUC: ↔ between conditions; glycaemic variability: FLB < EX; nocturnal hyperglycaemia: FLB < EX and FSB |
| Brocklebank et al. [71] | 8 M 9 W (mean ± SD); age: 52.4 ± 5.1 y; BMI: 28.0 ± 4.5 kg/m2; 8 active, 9 inactive | SIT: 5 h sitting; WALK: 2 min corridor walking @ RPE 9 every 20 min, total 28 min | CGMS | a |
| Champion et al. [72] | 12 M 12 W (mean ± SD); age: M: 32.0 ± 10.5 y, W: 39.5 ± 10.3 y; BMI: M: 26.6 ± 4.5 kg/m2, W: 24.8 ± 5.13 kg/m2; sitting time: M: 9.4 ± 2.4 h,W: 9.2 ± 2.4 h | SIT: 6 h 30 min sitting; INT: 20 min walking at 20 min, 80 min, 140 min, 200 min, 260 min, 320 min, self-selected @ 1.2–3.5 km/h, RPE 6–9 | Capillary: 0 h, 45 min, 105 min, 165 min, 225 min, 285 min, 345 min, 390 min; SBP, DBP | a; SBP, DBP: INT < SIT |
| Chen et al. [73] | 7 M 4 W (mean ± SD); age: 50 ± 5 y; BMI: 32.5 ± 6.7 kg/m2;bodyfat %: 35 ± 6% | SIT: 315 min sitting; INT, 2 min walking @ 6.4 km/h every 20 min over 315 min, 30 min total | Cannula: 0 h, hourly, and every 15 min after each meal (meal @ 0 h and 180 min), for TAG, glucose, insulin | a |
| Crespo et al. [14] | 2 M 7 W (mean ± SD); age: 30 ± 15 y; BMI: 29 ± 3 kg/m2; 2 participants impaired fasting glucose (5.6–6.9 mmol·L−1), 7 prehypertensive (> 120 mmHg SBP or > 80 mmHg DBP; < 150 min/w MVPA | SIT: 8 h sitting, restroom @ 0850 h, between 1000 and 1030 h, lunch (1200–1230 h), and between 1400 and 1500 h, replicated in all conditions; Stand: 2.5 h total standing time, stand 10 min at 0850 and 0950 h, 15 min at 1045 and 1145 h, 20 min at 1240 and 1320 h, and 30 min at 1400 and 1530 h; Walk: walk @ 1mph, same frequency and duration as Stand; Cycle: ~ 20 W, 25–30 RPM, same frequency, duration as Stand | 24 h CGMS, HR, activPAL | 24 h glucose: Stand, Walk, Cycle < Sit, Cycle < Walk < Stand; mean glucose LAB: Cycle < Stand, EVE: Cycle < Stand and Walk, Sleep: Cycle < Sit, Stand, Walk; 6 h postprandial glucose: Cycle, Walk, Stand < Sit; Cycle < Walk < Stand; cumulative 6 h iAUC: Cycle and Walk < Sit, Cycle < Stand |
| Dempsey et al. (2016, 2017) [15, 47] | T2D (ADA criteria) 14 M 10 W (mean ± SE); age: 62 ± 6 y, BMI: 33.0 ± 3.4 kg/m2, ≥ 25 < 40 kg/m2;); inactive (sitting ≥ 5 h/d OR < 150 min MVPA/w for 3 months) | SIT: 7 h sitting; WALK: sitting + 3 min walking (3.2 km/h) every 30 min (12 × 3), except during lunch; SRA: sitting + 3 min calisthenics/30 min, 12 × 3 (each 3 min divided into 9 20 s segments, alternating halfsquats, calf raises, gluteal contractions, knee raises); RPE intensity (9 ± 0.3 (7–12) and 10 ± 0.3 (7–13), and HR (mean differences for HR for LW and SRA: 17 ± 1.2 bpm (8–31) and 19 ± 1.0 bpm (10–30) | Cannula: − 1 h, 0 h, then @ 30 min intervals, immediately prior to activity, for glucose, insulin, TAG, c-peptides; CGMS | Glucose: 18 h iAUC: a, greater decrease for women than men for WALK and RA vs SIT; insulin: a; c-peptide: WALK < SIT, SRA < SIT; TAG: SRA < SIT, SRA < WALK; EE: SRA increase of 121 ± 7% vs sitting, LW increase of 73 ± 5% vs sitting; SRA increase of 0.58 ± 0.06 kcal · min−1 vs LW |
| Di Pietro [12] | 10 (mean ± SD); age: 69 ± 6 y; BMI: BMI 30 ± 5 kg/m2; impaired fasting glucose | INT: D1: inactive; D2: treadmill walking 3 × 15 min 3 METS postmeals; EXam: D1: inactive; D2: 45 min walking @ 3 METs @ 10.30am; EXpm: D1: inactive; D2: 45 min walking @ 3 METs @ 430 pm | CGMS, glucose; insulin only on sitting days | Glucose: INT: d2 < d1; EXAM: d2 < d1; EXPM: ↔ |
| Dunstan et al. [46] | 11 M 8 W (mean ± SD); age: 53.8 y ± 4.9 y; BMI: 31.2 kg/m2 ± 4.1; self-reported sedentary (sitting time > 5 h/d), < 150 min MVPA/w | SIT: sitting 7 h; LIGHT: sitting (402 min) + 2 min walking (3.2 km/h) every 20 min for 5 h; MOD: sitting (402 min) + 2 min MVPA walking (5.8–6.4 km/h) (RPE: 12–14) every 20 min | Catheter: − 2 h, − 1 h, 0 h, then hourly, before activity for glucose, insulin | a |
| Duvivier et al. [74] | 2 M 16 W (mean ± SD); age: 21 ± 2 y; BMI: 22.6 ± 3.6 kg/m2; FPG: 4.61 ± 0.31 mmol/L | Over 4 days; SIT: 14 h sitting + 1 h walking + 1 h standing; EX: 13 h sitting + 1 h walking + 1 h standing + 1 h MVPA cycling; INT: 8 h sitting + 5 h walking + 3 h standing | Next day (day 5) fasting glucose, insulin, TAG, HDL-C, non-HDL-C, LDL-C, Apo-A, Apo-B; next day OGTT for IS | Glucose AUC/fasting: ↔; Insulin AUC: INT < SIT, INT < EX; fasting TAG: INT < SIT; fasting non-HDL-C: INT < SIT; Apo B: INT < SIT |
| Duvivier et al. [75] | 13 M 6 W; (mean ± SD;)age: 63 ± 9 y, T2D (not on insulin), BMI: 30.5 ± 3.3 kg/m2, self-report MVPA: < 2.5 h/w, FPG: < 11 mmol/L | Over 4 days; SIT: 14 h sitting + 1 h walking + 1 h standing; EX: 13 h sitting + 1 h walking + 1 h standing + 1 h MVPA cycling (3 × 20 min bouts, 5 min rest between bouts); INT: 9 h sitting + 3 h walking + 4 h standing, after every 30 min sitting | Next day (day 5) 24 h CGM glucose; next day glucose, insulin fasting TAG, HDL-C, non-HDL-C, LDL-C, Apo-A, Apo-B | 24 h iAUC GLUC: INT < SIT; Insulin: INT < SIT; HOMA2-IR: INT < SIT and EX; TG: INT and EX < SIT; C-peptide: INT < SIT; NEFA: SIT < INT and EX |
| Duvivier et al. [76] | 13 M 11 W (mean ± SD); age: 64 ± 7 y, BMI: 29 ± 2 kg/m2, self-report MVPA: < 2.5 h/w, FPG: < 6.9 mmol/L | Over 4 days; SIT: walking and standing < 1 h/d; SitLess: ≥ 4 h/d of self-perceived light intensity walking, ≥ 3 h/d of standing, interrupt sitting every 30 min with standing/walking bouts | OGTT, catheter: 0 h, 15 min, 30 min, 45 min, 60 min, 90 min, 120 min, 190 min, for glucose, insulin, c-peptide, AG, total cholesterol, HDL-C, LDL-C, non-HDL-C, FFA, APo A-I, Apo B-100 |
Glucose AUC/fasting: ↔; insulin AUC/fasting: SitLess < SIT; c-peptide: AUC/fasting: SitLess < SIT; Apo B-100: SitLess < SIT; DBP: SitLess < SIT |
| Engeroff et al. [77] | Healthy, 18 W (mean ± SD); age: 25.6 ± 2.6 y, BMI: 21.5 ± 2.0 kg/m2VO2max: 41.3 ± 4.2 ml/kg/min; PA unreported | SIT: 4 h sitting; EX: 30 min cycling @ 70% VO2 max + 4 h sitting; INT: (40 min sitting + 6 min cycling @ 70% VO2max + 40 min sitting | Venous TAG, TC, HDL-C, LDL-C, baseline, post 240 min | TAG: ↔ between conditions, overall time effect, ↑ for INT, SIT; TC: INT < EX; HDL-C: INT < EX, INT < SIT; LDL-C: ↔, ↑ for INT |
| Hansen et al. [16] | 6 M 8 W (mean, 95%CI): age: 22 y (20–23); BMI: 23.0 kg/m2 (21.6–24.4); VO2max: 38.9 ml/min/kg (34.6–43.2); physically active (measured via IPAQ): 1895 MET min/W (44–3747) sedentary time: 429 (312–546) | SIT: 2.5 h sitting; INT: 2.5 h sitting interrupted with 2 min low intensity walking every 20 min (7 × 2) | Capillary: twice @ baseline, every 10 min for next 2.5 h, for glucose | ↔ |
| Hawari et al. [78] | 11 M 3 W (mean ± SD); age: 37 ± 16 y, BMI: 30.5 ± 3.8 kg/m2 | SIT: 390 min sitting; INT: 390 min sitting + 10 chair squats every 20 min over a 3 s period | Cannula: 0 h, 30 min, 60 min, 120 min, 180 min, 210 min, 240 min, 270 min, 330 min, 390 min, for glucose, insulin, TAG | a, Insulin: INT < SIT |
| Henson et al. [17] | 22 W (mean ± SD); age: 66.6 ± 4.7 y; BMI: 32.9 ± 4.7 kg/m2; post-menopausal (> 12 m); dysglycaemic IGT (≥ 7.8 mmol/L < 11.1 mmol/L OGTT); sedentary (objectively measured < 150 min/w MVPA) | SIT: D1: 7.5 h sitting, D2: 7.5 h sitting; STAND: 6.5 sitting +5 min standing every 30 min (12 × 5) on D1, + D2 sitting; WALK: 6.5 sitting + 5 min walking, self-selected light intensity (10–12 RPE, < 4 km/h) (12 × 5) + D2 sitting |
Cannula: − 1 h, 0 h, post-breakfast and lunch: 30 min, 60 min, 120 min, 180 min, for Glucose, TAG, NEFA |
a, Glucose: STAND < SIT; NEFA: WALK > SIT, STAND > SIT |
| Holmstrup et al. [60] | Obese, IFG, 8 M 3 W(mean ± SE); age: 25 ± 2.6 y, BMI: 34 kg/m2, Men VO2max: 32.6 ± 2.5 ml/kg/min, Women VO2max: 25.5 ± 1.8 ml/kg/min; light/moderate walking ≤ 5 × /w (questionnaire) | SIT: sitting: 12 h; EX: 1 h treadmill running @ 60–65% VO2peak, after baseline blood draw and 1st meal, sitting 11 h; INT 12 × 5 mins of treadmill running @ 60–65% VO2peak every 1 h, 1st bout after baseline blood draw and 1st meal | Catheter, baseline, every 10 min over 12 h, for glucose, insulin, c-peptides | a; C-peptide: EX < SIT and INT during exercise, 2 h iAUC: EX and INT < SIT |
| Homer et al. [65] | 11 M, 25 W (mean ± SD); age: 25 (range: 19–34); BMI: 23.78 ± 4.01 kg/m2, VO2max: 36.19 ± mL/kg/min; Sedentary, < 150 min MVPA/w | SIT: D1: 7 h sitting, D2: 5 h sitting; EX: D1: 6 h 30 min sitting + 30 min walking @ 60% VO2max, D2: 5 h sitting; INT: D1 and D2: sitting + 2 min walking @ 60% VO2max every 30 min; EX + INT: D1 and D2: sitting + 2 min walking @ 60% VO2max every 30 min + 30 min walking @ 60% on D1 | Cannula: D1: 0 h. D2: hourly + 30 min and 45 min post-meal, for TAG, glucose, insulin, NEFA | a; NEFA: ↔ |
| Honda et al. [18] | 13 M 3 W (mean ± SE); age: 65.4 ± 1.1 y, BMI: 23.6 ± 0.7 kg/m2, T2D | SIT: 180 min sitting; INT: 180 min sitting + 3 min stair climbing (21 steps × 6 times up and down, 80–110 steps/min) at 60 min and 120 min | Capillary: 0 min, 60, 90, 120, 150, 180 for glucose, C peptide, NEFA, lactate | Glucose: INT < CON; C-peptide: ↔; NEFA: ↔ |
| Kashiwabara et al. [64] | 12 W (mean ± SD); age: 70.5 ± 4.6 y; BMI: 25.3 ± 3.5 kg/m2; BP: 144 ± 19 mmHG; DBP: 85 ± 11 mmHG; inactive, < 150 min MVPA/w | SIT: 8 h sitting; INT: sitting + 1.5 min walking every 15 min @ 3.6 km/h, RPE: 11 @ 1 h, 1 h 15 min, 1 h 30 min, 1 h 45 min, 2 h 15 min, 2 h 30 min, 2 h 45 min, 4 h 15 min, 4 h 30 min, 4 h 45 min, 5 h, 5 h 15 min, 5 h 30 min, 5 h 45 min, 6 h 15 min, 6 h 30 min, 6 h 45 min, 7 h, 7 h 15 min, 7 h 30 min | Venepuncture: 0 h, 2 h, 4 h, 6 h, 8 h, for glucose, insulin, TAG, NEFA, APoB-48, ApoB-100, LPL | a; Apo B-48, Apo B-100, LPL: ↔ |
| Kerr et al. [61] | 9 W (mean ± SD); age: 66 ± 9 y; BMI: 30.6 ± 4.2 kg/m2; SBP: 123 ± 8 mmHG; DBP: 66 ± 7 mmHG | SIT: 5 h sitting; INT: 2 min walking every hour | Cannula: − 0.5 h, 0 h, every 30 min, for glucose, insulin; HR, BP, − 1 h, 0 h, every 30 min | a, SBP, DBP, HR: ↔ |
| Kim et al. [45] | 9 M (mean ± SD); age: 24.0 ± 4.0 y; VO2max: 51.6 ± 6.3 mL/kg/min; BMI < 30 kg/m2, recreationally active, healthy | SIT: D1 and D2: (7000–7500 steps/day, D3: 9 h sitting (< 2000 steps, 0900–1800), D4: HFTT; MOD: D1, D2, D4: same as SIT, D3: sitting +1 h running @ 65% VO2max 3. INT: sitting + isoenergetic (with condition 2) intermittent walking, every hour, 9 sessions, 1st session 30 min, last session 60 min, 7 other sessions 17.8 ± 4.0 min) @ 25% VO2max (total time: 214.5 min ± 28.0) | D4 fasting and postprandial FFA, TAG, glucose, insulin, indirect calorimetry for postprandial substrate oxidisation | a; FFA: MOD > INT and SIT |
| Larsen et al. [19] | 11 M 8 W (mean ± SE); age: 56.7 ± 1.5 y; BMI: 32.7 ± 1 kg/m2; Sedentary (sitting > 5 h/day, self-report, < 150 min/w MVPA) | SIT: 7 h sitting; INT: sitting (402 min) + 2 min walking (3.2 km/h) every 20 min for 5 h, 3 day protocol: on D1 and D3, SIT vs INT | Cannula: − 1 h, 0 h, hourly, before exercise for glucose, insulin, TAG; model of insulin sensitivity | a |
| Maylor et al. [79] | 7 M 7 W (mean ± SD); age: 29 ± 9 y, BMI: 26.1 ± 5.8 kg/m2, VO2max: 38.6 ± 4.2 mL/kg/min; Sedentary, inactive | SIT: 8H sitting; EX: 30 min sitting + 30 min treadmill running @ 60% VO2 reserve + 7 h sitting; INT: 30 min sitting + 2 min 32 s running @ 85% VO2 reserve every 60 min, 8 bouts | Cannula: 0 h. hourly intervals, for TAG, glucose, insulin, HDL-C | a; HDL-C: INT < SIT |
| McCarthy et al. [80] | 6 M 7 W (mean ± SD); age: 66 ± 6 y; BMI: 33.8 ± 3.8;SBP: 140 ± 13 mmHG; DBP: 79 ± 9 mmHG; < 150 min MVPA/w | SIT: 7.5 h sitting; INT: 7.5 sitting + 5 min arm ergometry @ intensity similar to 3 km/h walking, total 1 h (12 ×) | Cannula: 0 h, 30 min, 60 min, 120 min, 180 min, for glucose, insulin | a |
| McCarthy et al. [81] | 16 M 18 W (median ± IQR); age: M: 35 ± 17, W: 43 ± 13; BMI: M: 25.9 ± 5.1, W: 22.7 ± 4.6; VO2max: M: 50.3 ± 19.6 W: 34.0 ± 7.9; sitting: M: 547 ± 164 min, W: 595 ± 126 min | SIT: 7.5 h sitting; INT: 6.5 h sitting +5 min walking @ 3 km/h every 30 min, total 1 h | Cannula: − 1 h, 0 h, 30 min, 1 h, 2 h, 3 h, 210 min, 4 h, 5 h, 6 h, 390 min, for glucose, insulin | a |
| Miyashita et al. [7] | 10 M (mean ± SE); age: 25.0 ± 1.3 y, BMI: 25.4 ± 1.2 kg/m2, WC: 87.2 ± 3.5 cm, BF: 9.4 ± 0.7% VO2max: 56.3 ± 1.8 mL/kg/min; Healthy, recreationally active | 1.SIT: D1: 7 h sitting, D2: 7 h sitting; 2. EX: D1: 6 h 30 min sitting + 30 min running @ 71.1 ± 2.3% VO2max; D2: 7 h sitting; 3: INT: D1: 10 × 3 min running @ 69.6 ± 1.0% VO2max between every 30 min of sitting over 7 h, D2: 7 h sitting | D2 cannula: 0 h, hourly intervals, and @ 0.5, 0.75, 3.5, 3.75 h fasting and post-prandial for TAG, glucose, insulin, NEFA, 3-OHB; | a; NEFA, 3-OHB: ↔ |
| Miyashita et al. [9] | 19 M (M ± SE); age: 22.7 ± 0.5 y, BMI: 23.8 ± 0.8 kg/m2; VO2max: 60.3 ± 2.0 mL · kg−1 · min−1 | SIT: D1: sitting, 830/900 to 1600/1700, D2: 7 h sitting; INT: day1: sitting similar to SIT + 6 min running @ 70%VO2max and 30 min rest between each running bout | D2 venous: hourly, and at 0.5 h, 0.75 h, 3.5 h, 3.75 h, for glucose, insulin, TAG, NEFA | a NEFA: INT > SIT |
| Miyashita et al. [8] | 15 M; (mean ± SE): age: 23.4 ± 0.8 y, VO2max: 56.3 ± 2.1 mL/kg/min, BMI: 23.4 ± 0.6 kg/m2, WC: 80.8 ± 2.1 cm, BF: 11.2 ± 0.9%, SBP: 114 ± 2 mm Hg, DBP: 68 ± 2 mm Hg; non-smoking, BP < 140/90 mmHg | 1. SIT: D1: 7 h sitting, D2: 7 h sitting; 2: day1: EX: 30 min walking @ 6.8 km/h ± 0.1 (42.4 ± 1.8% VO2max) after 6 h 30 min sitting, day2: 7 h sitting; 3: INT: D1: 10 × 3 min walking 6.8 km/h ± 0.1 (41.4 ± 1.8% VO2max) between every 30 min of sitting over 7 h, D2: 7 h sitting | Next day TAG, glucose, insulin; BP: day1: baseline, every 5 and 15 min post-exercise in INT, and at corresponding time points in EX and SIT, day2: baseline, hourly | a; SBP: INT > SIT and EX during intermittent walking, lower 15 min post each walking, D2: INT and EX < SIT |
| Miyashita [10] | 8 M (mean ± SE); age: 26.5 ± 1.5 y; BMI: 28.9 ± 1.4 kg/m2; SBP: 131 ± 4 DBP: 82 ± 5 mmHg | SIT: D1: 7 h sitting, day2: 6 h sitting; EX: day1: 30 min cycling @ 60% max HR after 30 min sitting, D2: 6 h sitting; 3. INT: day1: 10 × 3 min cycling @ 60% max HR, day2: 6 h sitting | Venepuncture on D2: 0 h, 2 h, 4 h, 6 h for TG, NEFA, 3OHB, insulin, plasma glucose | a Postprandial: TAG (tAUC): EX and INT < SIT; INT and EX tending < SIT, main effect for 3OHB, exercise trials trending higher |
| Miyashita et al. [11] | 10 M (mean ± SE); age: 24.4 ± 1.4 y, height: 176.8 ± 1.8 cm, weight: 71.2 ± 2.1 kg, BMI: 22.8 ± 0.6 kg/m2, WC: 78.0 ± 1.1 cm, bodyfat: 8.8% ± 0.7%, VO2max: 56.0 ± 4.1 ml · kg–1 · min–1 recreationally active | SIT: sitting 9 h; INT: 9 h sitting + 6 × 5 min running @ 70% VO2max, every 90 min, beginning 830am, last bout @ 4 pm | Cannula: 0 h, 1 h 30 min, 3 h, 4 h 30 min, 6 h, 7 h 30 min, 9 h for plasma TAG, glucose, insulin; serum CRP at 0 h, 9 h | a CRP: ↔ |
| Miyashita et al. [20] | Inactive, 15 W (mean ± SD); age: 68.8 ± 3.2 y, BMI: 24.0 ± 2.9 kg/m2 SBP: 135 ± 19 mm Hg DBP: 85 ± 10 mm Hg | 1. SIT: 8 h sitting; 2. EX: 1 h sitting- > 30 min walking @ 3.7 ± 1.1 km/h, RPE: 12 ± 1 (0.33 ± 0.07 MJ/30 min)- > 6 h 30 min sitting 3. INT: 1 h sitting- > 20 × 1.5 min walking every 15 min @ 3.7 ± 1.1 km/h RPE: 11 ± 1 | Venous: 0 h, 2 h, 4 h, 6 h, 8 h for TAG, NEFA, 3-OHB, insulin, glucose | a, NEFA: ↔; 3-OHB: INT > SIT, EX |
| Peddie et al. [62] | 28 M 42 W (mean ± SD); age: (25.9 ± 5.3 y) BMI: 23.6 ± 4.0 kg/m2, questionnaire < 2.5 h/w (90 ± 42 min)PA; Healthy | 1. SIT: 9 h sitting; 2. EX: 15 min sitting + 30 min treadmill walking @60% VO2max (84.7BPM) + 8 h 15 min sitting 3. INT: 18 1min40 s (total 30 min) @ 45% VO2max (85.6BPM) walking evenly spread over 9 h, same speed and incline as EX; 1st walk 15 min after 0 h | Cannula, 16 total: baseline, hourly, and 6 additional 30 and 45 min after meals for glucose, insulin, TAG | a |
| Pulsford et al. [21] | 25 M (mean ± SD); age: 40.2 ± 12.2 y; inactive; BMI: 26.1 ± 4.1 kg/m2; BF: 26.6 ± 6% | SIT: 7 h sitting; STAND: sitting + 2 min standing every 20 min; WALK: sitting + 2 min walking (2mph) every 20 min | Cannula: − 1.5 h, OGTT @ 0 h, every 10 min for 30 min, then mixed meal @ 3 h, every 10 min for 30 min, every 30 min until 7 h for glucose, insulin, Matsuda index |
a Matsuda: WALK < SIT |
| Rodriguez-Hernandez et al. [82] | 10 W (mean ± SE); age: 36 ± 5 y; BMI: 38.0 ± 5.66 kg/m2; bodyfat %: 49.57 ± 1.38% | SIT: 4 h sitting: WALK2 min: 2 min walking every 30 min, total 16 min, between 4 h sitting; WALK5 min: 5 min walking every 30 min, total 40 min, between 4 h sitting | 4 h CGMS for glucose | a |
| Van Dijk et al. [83] |
T2D patients (ADA criteria) 20 M (mean ± SD); age: 64 ± 1 y; BMI: 29.5 ± 0.9 kg/m2, PA unreported |
SIT: 11 h? sitting; EX: sitting + breakfast + 45 min cycling @ 50% max workload capacity (EE: 350 kcal) + sitting; INT: sitting + 3 × 15 bouts of walking after each 3 meals (EE: 175 kcal) | Glucose CGMS; total 9 venous: 5 min before each meal, 90, 150 after each meal, last sample @ 1930 for glucose, insulin | Hyperglycaemia: EX < INT and SIT; a |
| Vincent et al. [84] | 6 M (mean ± SD); age: 27.0 ± 3.7 y; BMI: 24.8 ± 2.0 kg/m2 | SIT: sleep restricted: D1, D2, D3: 700–200; INT: sleep restricted: D1, D2, D3: sitting 700–200, from 1000–1700, 3 min walking @ 3.2 km/h every 30 min, 51 min total walking | CGMS | |
| Wennberg et al. [22] | 10 M 9 W (mean ± SD); age: 45–75 y, BMI: 31.5 ± 4.7 kg/m2; sitting time: 9.82 ± 2.19 h, MVPA ≤ 150 min/week | SIT: sitting 7 h; INT: sitting (402 min) + 3 min walking (3.2 km/h) every 30 min for 5 h, total 10 | CGMS for glucose, cannula for insulin, BDNF, IL6, cortisol |
a ↔ |
↔ no statistically significant difference between measures, ↑ increase; < statistically significantly less than, e.g. if Glucose: Walk < Stand and Sit, this means AUC for glucose for the WALK condition was less than the STAND condition, and also less than the SIT condition, @ at, D1 day 1, D2 day2, mean ± SD mean ± standard deviation, mean ± SE mean ± standard error, mean ± IQR mean ± interquartile range, RPE rating of perceived exertion, MET metabolic equivalents, CGMS continuous glucose monitoring system, T2D type 2 diabetes, OGTT oral glucose tolerance test, HFTT high fat tolerance test, FPG fasting plasma glucose, CVD cardiovascular disease, IFG impaired fasting glucose, GI Glycaemic Index, CRP c reactive protein, LPL lipoprotein lipase, NEFA Non-esterified fatty acids, HDL-C high density lipoprotein cholesterol, LDL-C low density lipoprotein cholesterol, TC total cholesterol, Apo A-I apoliprotein A-I, Apo B-48 apoliprotein B-48, Apo B-100 apolipoprotein B-100, SBP systolic blood pressure, DBP dystolic blood pressure, ABP ambulatory blood pressure, HR heart rate, 3OHB beta-hydroxy-butyrate, BDNF brain-derived neurotrophic factor, IL6 interleukin 6, HbA1c haemoglobin A1c, M men, W women, y years old, min minute
Fig. 2.

Forest plot for the effects of physical activity (PA) breaks on TAG measures, multi-day vs 1 day; D1: Day 1, d2: day 2
Fig. 3.

Forest plot for the effects of physical activity (PA) breaks on TAG measures. D1: day 1, D2: day2
Fig. 4.

Forest plot for the effects of physical activity (PA) breaks on glucose measures; GI: glycaemic index
Fig. 5.

Forest plot for the effects of physical activity (PA) breaks on glucose measures, active vs inactive/unfit/T2D/IFG/overweight/obese; T2D; type 2 diabetes, IFG: impaired fasting glucose, GI: glycaemic index
Fig. 6.

Forest plot for the effects of physical activity (PA) breaks vs continuous exercise on glucose measures, stratified by sex; GI: glycaemic index
Fig. 7.

Forest plot for the effects of physical activity (PA) breaks on insulin measures; GI: glycaemic index
Fig. 8.

Forest plot for the effects of physical activity (PA) breaks on glucose measures, active vs inactive/unfit/T2D/IFG/overweight/obese; T2D; type 2 diabetes, IFG: impaired fasting glucose, GI: glycaemic index
Continuous/Prolonged vs PA Breaks
In total, 26 studies were reviewed (Table 2), of which 22 were meta-analysed. Participants ranged from those with type 2 diabetes [60] to those who were healthy and had relatively high levels of CRF [7, 8, 45]. The number of participants in studies ranged from 9 [45, 61] to 70 [62]. A total number of 232 participants were included in the meta-analysis for glucose outcomes, 212 for insulin outcomes and 199 for TAG outcomes. Participants were from 22.1 [8] to 70.5 years old [64]. Most studies utilised one day designs, but some utilised multi-day designs [7, 8, 45, 65]. Forest plots for TAG outcomes are presented in Fig. 9 and ‘Electronic Supplementary Material Appendix S2—Figs S3 and S4; for glucose outcomes in Figs. 10, 11 and Electronic Supplementary Material Appendix S2—Fig. S5’; and for insulin outcomes in Fig. 12 and Electronic Supplementary Material Appendix S2—Figs S6 and S7.
Table 2.
Studies comparing PA breaks with 1 bout of continuous/prolonged exercise
| Study | Participants | Protocol | Outcomes | Results |
|---|---|---|---|---|
| Bhammar et al. [69] | 5 M 5 W (mean ± SD); age: M: 31 ± 5 y W: 32 ± 6 y; BMI: M: 30.1 ± 2.3 kg/m2, W: 30.5 ± 6.6 kg/m2; VO2max: M: 34.9 ± 4.0 ml/kg/min, W: 22.8 ± 2.7 ml/kg/min | SIT: 9 h sitting; 2 minMod20: 2min walking at 53 ± 5% HR max/3 miles/h every 20 min, total 42 min, 240 kcal. 2 minVig60: 2min walking at 79 ± 4% HR max every hour, total 16 min, 140 kcal; EX: 30 min walking at 71 ± 4% HRmax/56% VO2max/3.3 miles/h, 230 kcal | CGMS. ABP, MAP | a, Systolic ABP, MAP: EX < SIT |
| Blankenship et al. [70] | 2 M 8 W (mean ± SE); age: 51.9 ± 15.4 y; BMI: 31.6 ± 10.0 kg/m2, BF: 42.6 ± 3.3% | EX: 30 min brisk walking, ~ 300 kcal before lunch. FLB: isoenergetic with EX, bouts of sitting ≤ 20 min; FSB: bouts of sitting ≤ 20 min, same number of breaks as FLB but time walking standing reduced to minimise EE | CGMS, catheter for blood, after MMTT at end of day, @ 30, 60, 90, 120 min, for glucose, insulin | Post-prandial glucose and insulin AUC: ↔ between conditions; glycaemic variability: FLB < EX; nocturnal hyperglycaemia: FLB < EX and FSB |
| Di Pietro [12] | 10 (mean ± SD); age: 69 ± 6 y; BMI: BMI 30 ± 5 kg/m2; impaired fasting glucose | INT: D1: inactive; D2: treadmill walking 3 × 15 min 3 METS postmeals; EXam: D1: inactive; D2: 45 min walking @ 3 METs @ 10.30 am; EXpm: D1: inactive; D2: 45 min walking @ 3 METs @ 430 pm | CGMS, glucose; insulin only on sitting days | Glucose: INT: d2 < d1; EXAM: d2 < d1; EXPM: ↔ |
| Duvivier et al. [74] | 2 M 16 W (mean ± SD); age: 21 ± 2 y; BMI: 22.6 ± 3.6 kg/m2; FPG: 4.61 ± 0.31 mmol/L | Over 4 days; SIT: 14 h sitting + 1 h walking + 1 h standing; EX: 13 h sitting + 1 h walking + 1 h standing + 1 h MVPA cycling; INT: 8 h sitting + 5 h walking + 3 h standing | Next day (day 5) fasting glucose, insulin, TAG, HDL-C, non-HDL-C, LDL-C, Apo-A, Apo-B; next day OGTT for IS | Glucose AUC/fasting: ↔; Insulin AUC: INT < SIT, INT < EX; fasting TAG: INT < SIT; fasting non-HDL-C: INT < SIT; Apo B: INT < SIT |
| Duvivier et al. [75] | 13 M 6 W; (mean ± SD;)age: 63 ± 9 y, T2D (not on insulin), BMI: 30.5 ± 3.3 kg/m2, self-report MVPA: < 2.5 h/w, FPG: < 11 mmol/L | Over 4 days; SIT: 14 h sitting + 1 h walking + 1 h standing; EX: 13 h sitting + 1 h walking + 1 h standing + 1 h MVPA cycling (3 × 20 min bouts, 5 min rest between bouts); INT: 9 h sitting + 3 h walking + 4 h standing, after every 30 min sitting | Next day (day 5) 24 h CGM glucose; next day glucose, insulin fasting TAG, HDL-C, non-HDL-C, LDL-C, Apo-A, Apo-B | 24 h iAUC GLUC: INT < SIT; Insulin: INT < SIT; HOMA2-IR: INT < SIT and EX; TG: INT and EX < SIT; C-peptide: INT < SIT; NEFA: SIT < INT and EX |
| Engeroff et al. [77] | Healthy, 18 W (mean ± SD); age: 25.6 ± 2.6 y, BMI: 21.5 ± 2.0 kg/m2VO2max: 41.3 ± 4.2 ml/kg/min; PA unreported | SIT: 4 h sitting; EX: 30 min cycling @ 70% VO2 max + 4 h sitting; INT: (40 min sitting + 6 min cycling @ 70% VO2max + 40 min sitting | Venous TAG, TC, HDL-C, LDL-C, baseline, post 240 min | TAG: ↔ between conditions, overall time effect, ↑ for INT, SIT; TC: INT < EX; HDL-C: INT < EX, INT < SIT; LDL-C: ↔, ↑ for INT |
| Holmstrup et al. [60] | Obese, IFG, 8 M 3 W(mean ± SE); age: 25 ± 2.6 y, BMI: 34 kg/m2, Men VO2max: 32.6 ± 2.5 ml/kg/min, Women VO2max: 25.5 ± 1.8 ml/kg/min; light/moderate walking ≤ 5 × /w (questionnaire) | SIT: sitting: 12 h; EX: 1 h treadmill running @ 60–65% VO2peak, after baseline blood draw and 1st meal, sitting 11 h; INT 12 × 5 mins of treadmill running @ 60–65% VO2peak every 1 h, 1st bout after baseline blood draw and 1st meal | Catheter, baseline, every 10 min over 12 h, for glucose, insulin, c-peptides | a; C-peptide: EX < SIT and INT during exercise, 2 h iAUC: EX and INT < SIT |
| Homer et al. [65] | 11 M, 25 W (mean ± SD); age: 25 (19–34); BMI: 23.78 ± 4.01 kg/m2, VO2max: 36.19 ± mL/kg/min; Sedentary, < 150 min MVPA/w | SIT: D1: 7 h sitting, D2: 5 h sitting; EX: D1: 6 h 30 min sitting + 30 min walking @ 60% VO2max, D2: 5 h sitting; INT: D1 and D2: sitting + 2 min walking @ 60% VO2max every 30 min; EX + INT: D1 and D2: sitting + 2 min walking @ 60% VO2max every 30 min + 30 min walking @ 60% on D1 | Cannula: D1: 0 h. D2: hourly + 30 min and 45 min post-meal, for TAG, glucose, insulin, NEFA | a; NEFA: ↔ |
| Kashiwabara et al. [64] | 12 W (mean ± SD); age: 70.5 ± 4.6 y; BMI: 25.3 ± 3.5 kg/m2; BP: 144 ± 19 mmHG; DBP: 85 ± 11 mmHG; inactive, < 150 min MVPA/w | SIT: 8 h sitting; INT: sitting + 1.5 min walking every 15 min @ 3.6 km/h, RPE: 11 @ 1 h, 1 h 15 min, 1 h 30 min, 1 h 45 min, 2 h 15 min, 2 h 30 min, 2 h 45 min, 4 h 15 min, 4 h 30 min, 4 h 45 min, 5 h, 5 h 15 min, 5 h 30 min, 5 h 45 min, 6 h 15 min, 6 h 30 min, 6 h 45 min, 7 h, 7 h 15 min, 7 h 30 min | Venepuncture: 0 h, 2 h, 4 h, 6 h, 8 h, for glucose, insulin, TAG, NEFA, APoB-48, ApoB-100, LPL | a; Apo B-48, Apo B-100, LPL: ↔ |
| Kim et al. [45] | 9 M (mean ± SD); age: 24.0 ± 4.0 y; VO2max: 51.6 ± 6.3 mL/kg/min; BMI < 30 kg/m2, recreationally active, healthy | SIT: D1 and D2: (7000–7500 steps/day, D3: 9 h sitting (< 2000 steps, 0900–1800), D4: HFTT; MOD: D1, D2, D4: same as SIT, D3: sitting +1 h running @ 65% VO2max 3. INT: sitting + isoenergetic (with condition 2) intermittent walking, every hour, 9 sessions, 1st session 30 min, last session 60 min, 7 other sessions 17.8 ± 4.0 min) @ 25% VO2max (total time: 214.5 min ± 28.0) | D4 fasting and postprandial FFA, TAG, glucose, insulin, indirect calorimetry for postprandial substrate oxidisation | a; FFA: MOD > INT and SIT |
| Maylor et al. [79] | 7 M and7 W (mean ± SD); age: 29 ± 9 y, BMI: 26.1 ± 5.8 kg/m2, VO2max: 38.6 ± 4.2 mL/kg/min; Sedentary, inactive, | SIT: 8H sitting; EX: 30 min sitting + 30 min treadmill running @ 60% VO2 reserve + 7 h sitting; INT: 30 min sitting + 2 min 32 s running @ 85% VO2 reserve every 60 min, 8 bouts | Cannula: 0 h. hourly intervals, for TAG, glucose, insulin, HDL-C | a; HDL-C: INT < SIT |
| Miyashita et al. [7] | 10 M (mean ± SE); age: 25.0 ± 1.3 y, BMI: 25.4 ± 1.2 kg/m2, WC: 87.2 ± 3.5 cm, BF: 9.4 ± 0.7% VO2max: 56.3 ± 1.8 mL/kg/min; Healthy, recreationally active | 1.SIT: D1: 7 h sitting, D2: 7 h sitting; 2. EX: D1: 6 h 30 min sitting + 30 min running @ 71.1 ± 2.3% VO2max; D2: 7 h sitting; 3: INT: D1: 10 × 3 min running @ 69.6 ± 1.0% VO2max between every 30 min of sitting over 7 h, D2: 7 h sitting | D2 cannula: 0 h, hourly intervals, and @ 0.5, 0.75, 3.5, 3.75 h fasting and post-prandial for TAG, glucose, insulin, NEFA, 3-OHB | a; NEFA, 3-OHB: ↔ |
| Miyashita et al. [8] | 15 M; (mean ± SE): age: 23.4 ± 0.8 y, VO2max: 56.3 ± 2.1 mL/kg/min, BMI: 23.4 ± 0.6 kg/m2, WC: 80.8 ± 2.1 cm, BF: 11.2 ± 0.9%, SBP: 114 ± 2 mm Hg, DBP: 68 ± 2 mm Hg; non-smoking, BP < 140/90 mmHg, | 1. SIT: D1: 7 h sitting, D2: 7 h sitting; 2: day1: EX: 30 min walking @ 6.8 km/h ± 0.1 (42.4 ± 1.8% VO2max) after 6 h 30 min sitting, day2: 7 h sitting; 3: INT: D1: 10 × 3 min walking 6.8 km/h ± 0.1 (41.4 ± 1.8% VO2max) between every 30 min of sitting over 7 h, D2: 7 h sitting | Next day TAG, glucose, insulin; BP: day1: baseline, every 5 and 15 min post-exercise in INT, and at corresponding time points in EX and SIT, day2: baseline, hourly | a; SBP: INT > SIT and EX during intermittent walking, lower 15 min post each walking, D2: INT and EX < SIT |
| Miyashita et al. [20] | Inactive, 15 W (mean ± SD); age: 68.8 ± 3.2 y, BMI: 24.0 ± 2.9 kg/m2 SBP: 135 ± 19 mm Hg DBP: 85 ± 10 mm Hg | 1. SIT: 8 h sitting; 2. EX: 1 h sitting- > 30 min walking @ 3.7 ± 1.1 km/h RPE RPE 12 ± 1 (0.33 ± 0.07 MJ/30 min)- > 6 h 30 min sitting 3. INT: 1 h sitting- > 20 × 1.5 min walking every 15 min @ 3.7 ± 1.1 km/h RPE: 11 ± 1 | Venous: 0 h, 2 h, 4 h, 6 h, 8 h for TAG, NEFA, 3-OHB, insulin, glucose | a, NEFA: ↔; 3-OHB: INT > SIT, EX |
| Peddie et al. [62] | 28 M 42 W (mean ± SD); age: (25.9 ± 5.3 y) BMI: 23.6 ± 4.0 kg/m2, questionnaire < 2.5 h/w (90 ± 42 min)PA; Healthy | 1. SIT: 9 h sitting; 2. EX: 15 min sitting + 30 min treadmill walking @60% VO2max (84.7BPM) + 8 h 15 min sitting 3. INT: 18 1min40 s (total 30 min) @ 45% VO2max (85.6BPM) walking evenly spread over 9 h, same speed and incline as EX; 1st walk 15 min after 0 h | Cannula, 16 total: baseline, hourly, and 6 additional 30 and 45 min after meals for glucose, insulin, TAG | a |
| Van Dijk et al. [83] |
T2D patients (ADA criteria) 20 M (mean ± SD); age: 64 ± 1 y; BMI: 29.5 ± 0.9 kg/m2, PA unreported |
SIT: 11 h? sitting; EX: sitting + breakfast + 45 min cycling @ 50% max workload capacity (EE: 350 kcal) + sitting; INT: sitting + 3 × 15 bouts of walking after each 3 meals (EE: 175 kcal) | Glucose CGMS; total 9 venous: 5 min before each meal, 90, 150 after each meal, last sample @ 1930 for glucose, insulin | Hyperglycaemia: EX < INT and SIT;a |
↔ no statistically significant difference between measures, ↑ increase; < statistically significantly less than, e.g. if Glucose: Walk < Stand and Sit, this means AUC for glucose for the WALK condition was less than the STAND condition, and also less than the SIT condition, @ at, D1 day 1, D2 day2, mean ± SD mean ± standard deviation, mean ± SE mean ± standard error, mean ± IQR mean ± interquartile range, RPE rating of perceived exertion, MET metabolic equivalents, CGMS continuous glucose monitoring system, T2D type 2 diabetes, OGTT oral glucose tolerance test, HFTT high fat tolerance test, FPG fasting plasma glucose, CVD cardiovascular disease, IFG impaired fasting glucose, GI Glycaemic Index, CRP c reactive protein, LPL lipoprotein lipase, NEFA non-esterified fatty acids, HDL-C high density lipoprotein cholesterol, LDL-C low density lipoprotein cholesterol, TC total cholesterol, Apo A-I apoliprotein A-I, Apo B-48 apoliprotein B-48, Apo B-100 apolipoprotein B-100, SBP systolic blood pressure, DBP dystolic blood pressure, ABP ambulatory blood pressure, HR heart rate, 3OHB beta-hydroxy-butyrate, BDNF brain-derived neurotrophic factor, IL6 interleukin 6, HbA1c haemoglobin A1c, M men, W women, y years old, min minute
Fig. 9.

Forest plot for the effects of physical activity (PA) breaks vs continuous exercise on TAG measures, multi-day vs 1 day; D1: Day 1, d2: day 2
Fig. 10.

Forest plot for the effects of physical activity (PA) breaks vs continuous exercise on glucose measures
Fig. 11.

Forest plot for the effects of physical activity (PA) breaks on glucose measures, stratified by sex
Fig. 12.

Forest plot for the effects of physical activity (PA) breaks vs continuous exercise on insulin measures
Duvivier et al. [74–76], and Blankenship [70] were not included in the meta-analysis as the PA breaks protocol were not clearly stated, and free-living designs were used; however, they were included in the narrative summary (Table 2). All but one [77] study had participants randomised into crossover trial conditions.
Primary Outcomes
Physical Activity Breaks vs Sitting
Overall, there was a small but statistically significant effect for TAG outcomes, an SMD of − 0.26 (95% CI − 0.44, − 0.09, p = 0.002) (Fig. 2). There were statistically significant moderate effects for PA breaks on glucose [SMD − 0.54 (95% CI − 0.70, − 0.37, p = 0.00001) (Fig. 4)] and insulin [SMD 0.56 (95% CI − 0.74, − 0.38, p = 0.00001) (Fig. 7)].
Meta-regression
BMI was statistically significantly associated with glucose (β = − 0.05, 95% CI − 0. CI − 0.09, − 0.01, p = 0.01) (Fig. 13) and insulin (β = − 0.05, 95% CI − 0.10, − 0.006, p = 0.03) (Fig. 14) responses to PA breaks compared with sitting, suggesting that the observed effects were larger in more obese participants. TAG (β = 0.02, 95% CI − 0.02, 0.06, p = 0.37) responses were not associated with BMI. Bailey et al. [68] and Kim et al. [45] were not included in the meta-regression, as BMI was not reported.
Fig. 13.

Bubble plot illustrating the association between BMI and SMD when PA breaks were compared with sitting on blood glucose measures. A bubble represents a study. A negative value for SMD means that PA breaks resulted in lower blood glucose values, a positive SMD indicates that sitting resulted in lower glucose values
Fig. 14.

Bubble plot illustrating the association between BMI and SMD when PA breaks were compared with sitting on blood glucose measures. A bubble represents a study. A negative value for SMD means that PA breaks resulted in lower blood glucose values, a positive SMD indicates that sitting resulted in lower glucose values
Publication Bias
There was an asymmetrical funnel plot for TAG (Fig. 15) outcomes when PA breaks were compared to sitting, but not for glucose (Fig. 16) or insulin (Fig. 17), suggesting the possible existence of publication bias for TAG outcomes (Table 3).
Fig. 15.
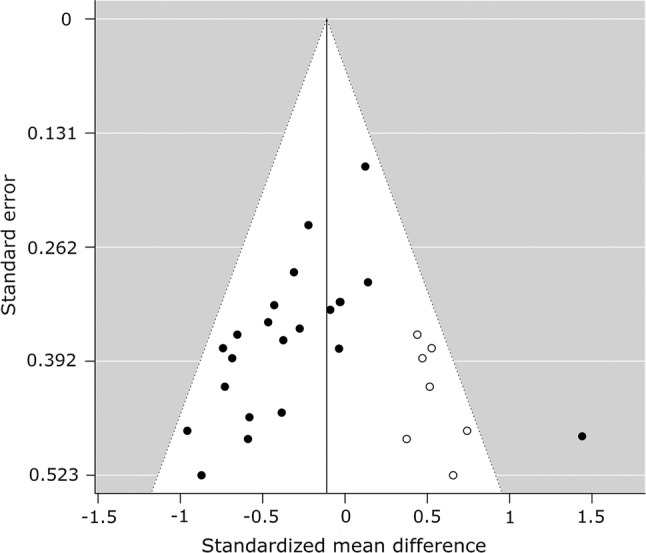
Funnel plot for triacylglycerol measures, random-effects model: physical activity breaks versus sitting. A filled circle represents a study; an empty circle, if present, represents a “missing” study by the trim and fill method
Fig. 16.
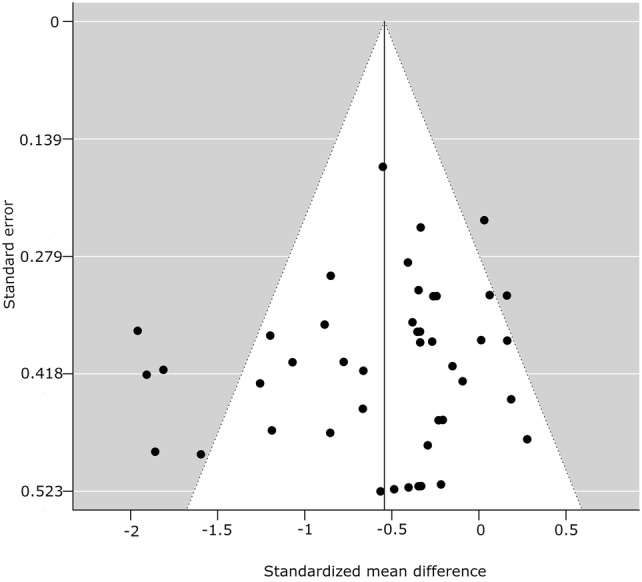
Funnel plot for glucose measures, random-effects model: physical activity breaks versus sitting. A filled circle represents a study; an empty circle, if present, represents a “missing” study by the trim and fill method
Fig. 17.
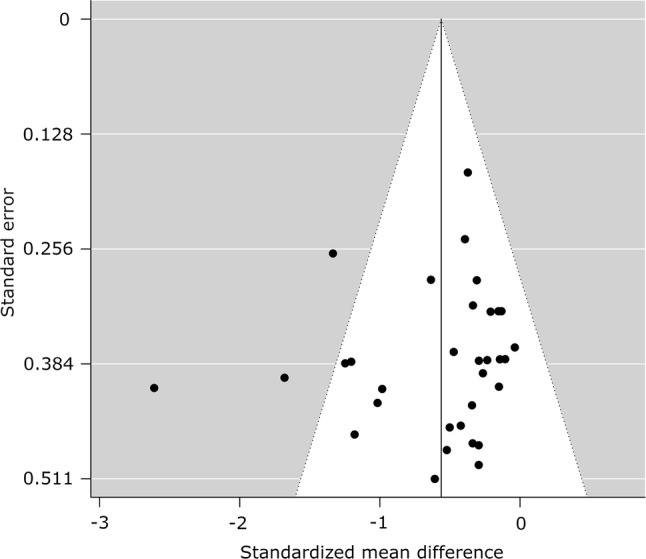
Funnel plot for insulin measures, random-effects model: physical activity breaks versus sitting. A filled circle represents a study; an empty circle, if present, represents a “missing” study by the trim and fill method
Table 3.
Statistical tests for publication bias for the meta-analyses of glucose, insulin, and TAG levels: physical activity breaks vs sitting, physical activity breaks vs continuous exercise
| Metabolic variable | Rosenthal’s fail-safe N | Begg and Mazumdar (p value) | Egger (t value, p value) | SMD, assuming severe 2-tailed selection bias |
|---|---|---|---|---|
| Glucose, breaks vs sitting | 1358 | 0.09 | − 1.25, 0.22 | − 0.41 |
| Insulin, breaks vs sitting | 907 | 0.03 | − 0.80, 0.43 | − 0.43 |
| TAG, breaks vs sitting | 87 | 0.005 | − 2.09, 0.05 | − 0.20 |
SMD standardised mean difference
Secondary Outcomes
Continuous/Prolonged Exercise vs PA Breaks
There were no statistically significant differences for TAG outcomes, with an SMD of 0.08 (95% CI − 0.22, 0.37, p = 0.62) (Fig. 9), or insulin (Fig. 12), with an SMD of 0.35 (95% CI − 0.37, 1.07, p = 0.35), but there was a statistically significant small to moderate effect for glucose with an SMD of − 0.26 (95% CI − 0.50, − 0.02, p = 0.03) (Fig. 10), as a result of intermittent PA breaks compared to one bout of continuous exercise in the context of prolonged sitting. Only two studies [77, 79] compared lipoprotein responses to PA breaks and continuous exercise (Table 2), with PA breaks decreasing high-density lipoprotein (HDL) cholesterol in comparison to sitting [77, 79] and continuous exercise [77].
Meta-regression and Publication Bias
There was no association between BMI and glucose SMD (β = 0.008, 95% CI − 0.06, 0.08, p = 0.81) for PA breaks versus one bout of continuous exercise. No meta-regression was performed for insulin and TAG measures due to the small number of studies [85, 86].
There was a possible publication bias for insulin measures (Table 4).
Table 4.
Statistical tests for publication bias for the meta-analyses of glucose, insulin, and TAG levels, physical activity breaks vs sitting
| Metabolic variable | Rosenthal’s fail-safe N | Begg and Mazumdar (p value) | Egger (t value, p value) | SMD, assuming severe 2-tailed selection bias |
|---|---|---|---|---|
| Glucose, breaks vs continuous | 12 | 0.27 | 1.61, 0.13 | − 0.17 |
| Insulin, breaks vs continuous | 0 | 0.00009 | 1.06, 0.32 | 0.14 |
| TAG, breaks vs continuous | 0 | 1.0000 | − 1.35, 0.21 | 0.02 |
SMD standardized mean difference
Risk of Bias
Other than a few studies [15, 17, 21, 46, 47] most did not utilise or report any form of blinding. All studies included in the meta-analysis, except one [77], were randomised, but only a few reported the randomisation methods clearly [17, 19, 21, 22, 46, 47, 62]. Additionally, with the exception of a few studies [15, 17, 19, 46, 47, 62], most did not report how any possible missing data were handled. Notably, studies with the most rigorous design or reporting [15, 17, 46, 47] appeared to report larger effects, for example, on glucose and insulin (Figs. 4, 7) (Table 5).
Table 5.
Risk of bias summary for included studies
| Study | Random sequence generation (selection bias) | Allocation concealment (selection bias) | Blinding of participants and personnel (performance bias) | Blinding of outcome assessment (detection bias) | Incomplete outcome data (attrition bias) | Selective reporting (reporting bias) | Other bias |
|---|---|---|---|---|---|---|---|
| Bailey et al. [68] | ? | ? | N | N | Y | Y | Y |
| Bailey et al. [13] | ? | ? | N | N | Y | Y | Y |
| Bailey et al. [63] | ? | ? | N | N | Y | Y | Y |
| Bailey et al. [63] | ? | ? | N | N | Y | Y | Y |
| Bhammar et al. [69] | ? | ? | N | N | Y | Y | Y |
| Blakenship et al. [70] | ? | ? | N | N | Y | Y | Y |
| Brocklebank et al. [71] | Y | Y | N | N | Y | Y | Y |
| Champion et al. [72] | ? | ? | N | N | Y | Y | Y |
| Chen et al. [73] | ? | ? | N | N | Y | Y | Y |
| Crespo et al. [14] | ? | ? | N | N | Y | Y | Y |
| Dempsey et al. [15, 47] | Y | Y | ? | Y | Y | Y | Y |
| Di Pietro et al. [12] | ? | ? | N | N | Y | Y | Y |
| Dunstan et al. [46] | Y | Y | ? | Y | Y | Y | Y |
| Duvivier et al. [74] | ? | ? | N | N | Y | Y | Y |
| Duvivier et al. [75] | Y | Y | N | Y | Y | Y | Y |
| Duvivier et al. [76] | Y | Y | N | Y | Y | Y | Y |
| Engeroff et al. [77] | N | N | N | N | Y | N | Y |
| Hansen et al. [16] | ? | ? | N | N | Y | Y | Y |
| Hawari et al. [78] | ? | ? | N | N | Y | Y | Y |
| Henson et al. [17] | ? | ? | ? | Y | Y | Y | Y |
| Holmstrup et al. [60] | ? | ? | N | N | Y | N | ? |
| Homer et al. [65] | ? | ? | N | N | Y | Y | Y |
| Honda et al. [18] | ? | ? | N | N | Y | Y | Y |
| Kashiwabara et al. [64] | ? | ? | N | N | Y | Y | Y |
| Kerr et al. [61] | ? | ? | N | N | Y | Y | Y |
| Kim et al. | ? | ? | N | N | Y | N | Y |
| Larsen et al. [19] | Y | Y | ? | N | Y | N | Y |
| Maylor et al. [79] | ? | ? | N | N | Y | Y | Y |
| McCarthy et al. [80] | ? | ? | N | N | Y | Y | Y |
| McCarthy et al. [81] | ? | ? | N | N | Y | Y | Y |
| Miyashita et al. [7] | ? | ? | N | N | Y | N | Y |
| Miyashita et al. [9] | ? | ? | N | N | Y | Y | Y |
| Miyashita et al. [8] | ? | ? | N | N | Y | N | Y |
| Miyashita et al. [10] | ? | ? | N | N | Y | N | Y |
| Miyashita et al. [11] | ? | ? | N | N | ? | ? | Y |
| Miyashita et al. [20] | ? | ? | N | N | Y | Y | Y |
| Peddie et al. [62] | Y | Y | N | N | Y | N | Y |
| Pulsford et al. [21] | Y | Y | ? | N | Y | N | Y |
| Rodriguez-Hernandez et al. [82] | ? | ? | N | N | Y | N | Y |
| Van Dijk et al. [83] | ? | ? | N | N | Y | N | Y |
| Vincent et al. [87] | ? | ? | N | N | Y | N | Y |
| Wennberg et al. [22] | Y | Y | N | N | Y | N | Y |
Y not at risk of bias for this condition, N at risk of bias for this condition, ? risk of bias for this condition is unknown based on the reported methodology
Discussion
Main Findings
Physical Activity Breaks vs Sitting
Overall, there were statistically significant differences between PA breaks (INT) compared to sitting (SIT) on measures of glucose, insulin and TAG. The effect for TAG was small, SMD of − 0.27 − 0.26 (95% CI − 0.44, − 0.09, p = 0.002), whereas the effects for glucose, SMD of − 0.54 (95% CI − 0.70, − 0.37, p = 0.00001), and insulin, SMD of − 0.56 (95% CI − 0.74, − 0.38, p = 0.00001) were moderate. The observed effects on glucose (β = − 0.05, 95% CI − 0.09, − 0.01, p = 0.01), and insulin (β = − 0.05, 95% CI − 0.10, − 0.006, p =− 0. 0.03) responses were more pronounced in participants with larger BMIs. A negative β coefficient indicates that as BMI increases, the SMD between PA breaks compared to sitting is negative, with a negative SMD indicating an effect in favour of breaks. The small effect of breaks on TAG could be due to the delayed effects of exercise on lipids [39, 40]. Whereas studies using single day designs reported no statistically significant effects, those with two or multi-day designs did (Fig. 2). Heterogeneity in some of the meta-analyses might be explained by differences in study population and design, as discussed in Sect. 4.3.
Continuous/Prolonged Exercise vs Intermittent
Overall, the meta-analysis found no statistically significant differences between prolonged/continuous exercise compared to PA breaks in sitting on postprandial insulin and TAG. Notably, PA breaks had a greater effect on glycaemia in studies that were energy matched (Fig. 10), with a small to moderate effect: − 0.26 (95% CI − 0.50, − 0.02, p = 0.03).
Implications
Several short-term experimental studies have shown that PA breaks attenuate post-prandial increases in glucose (Fig. 4) and insulin (Fig. 7) on the same day, compared to no-exercise sitting. Additionally, these effects persisted overnight [14, 15]. The sustained effects of PA breaks warrant further research, especially with the increasing use and availability of CGMS. The effects of breaks on TAG were weaker, but PA breaks still appear to attenuate TAG somewhat (Fig. 2). Physically inactive or sedentary participants or those with IFG or T2D experienced greater benefits in glycaemic attenuation (Fig. 5), as did those with higher BMI, as revealed by meta-regression (Sect. 3.3.2) (Fig. 13).
To place these results in the wider context of the effects of exercise on markers of metabolic health, in a meta-analysis of non-laboratory based randomised controlled trials of PA interventions lasting from 2 to 6 months in people with type 2 diabetes aged 35–71 years, walking, yoga, tai chi and qigong had a cumulative SMD of − 0.60 (95% CI − 0.83, − 0.37) compared with no exercise on glycaemic control, as indicated by glycated haemoglobin (HbA1c) [88]. High intensity interval training (HIIT) interventions lasting more than 2 weeks, compared to no exercise, reduced insulin resistance by an SMD of − 0.49 (95% CI − 0.87, − 0.12) in all groups, by − 0.38 (95% CI − 1.39, 0.63) in overweight/obese, and by − 0.62 (95% CI − 1.10, − 0.14) in people with type 2 diabetes [89]. Similarly, short term HIIT, lasting less than 12 weeks, reduced fasting glucose by an SMD of − 0.35 (95% CI − 0.62, 0.0.09) in overweight or obese people [90]. Additionally, in people with non-alcoholic fatty liver disease, exercise interventions, whether aerobic, resistance, or combined, lasting more than 1 month, reduced the glucose parameters HbA1c and homeostatic model of assessment of insulin resistance (HOMA-IR) by SMDs of − 0.76 (95% CI − 0.78, − 0.42) and − 0.50 (95% CI − 0.85, − 0.15), respectively [91], compared to normal care. Similarly, exercise reduced postprandial total TAG by Cohen’s d of − 0.60 (95% CI − 0.69, − 0.50), and iAUC TAG by − 0.59 (95% CI − 0.76, − 0.42) in all participants [92]. Since all but one of these meta-analyses [92] were not laboratory based and evaluated acute or longer-term protocols and adherence to the exercise protocols was less easy to confirm, they should be compared with our findings only generally and cautiously. Similarly, a previous meta-analysis [6] of 5 studies [46, 60, 62, 68, 83] reported PA breaks resulted in lower glucose measures than sitting. The effect sizes reported in our current meta-analysis, whether for measures of glucose, insulin, or TAG, can be seen to be generally similar to the effect sizes of diverse exercise modalities in various populations reported in the literature.
Recently, a meta-analysis [93] reported that activity breaks compared to sitting lowered post-prandial glucose by Cohen’s d of − 0.36 (95% CI − 0.50, − 0.21), and postprandial insulin by Cohen’s d of − 0.37 (95% CI − 0.53, − 0.20). The mean postprandial TAG response with breaks was reduced by 0.06 (95% CI − 0.15, 0.26) compared with sitting. The findings of the meta-analysis by Saunders et al. [93] for glucose and insulin outcomes were broadly similar to our findings, but with smaller effect sizes. However, we found that PA breaks lowered post-prandial TAG outcomes, in contrast to Saunders et al. [93]. The differences in results could be explained by differences in inclusion criteria. Saunders et al. included adolescents and teenagers [94–98] in their meta-analysis [93], whereas we did not. Furthermore, whereas we included studies with people with type 2 diabetes in our meta-analysis, Saunders et al. [93] did not. It is possible that we found that PA breaks compared to sitting had greater benefits on glucose, insulin and TAG outcomes than Saunders et al. [93] because participants in their meta-analysis were healthier and younger. This is supported generally by our meta-regression and subgroup analyses, which suggested that people with higher BMI, lower cardiovascular fitness, impaired fasting glucose or type 2 diabetes, experienced greater reductions in post-prandial glucose and insulin, compared to those with lower BMI or who were healthier. However, Saunders et al. [93] reported that neither glucose nor insulin outcomes were associated with BMI. This discrepancy between their findings and ours might again be due to the younger and healthier participants in their analyses, as transport, uptake and metabolism of glucose might be greater in the insulin sensitive compared to the insulin resistant [44]. Additionally, whereas Saunders et al. only included studies involving bouts of light to moderate activity, we did not limit studies based on exercise intensity. Moreover, we also performed meta-analyses of PA breaks in comparison to one continuous bout of exercise, reporting a small effect in favour of PA breaks on post-prandial glucose outcomes.
These post-prandial effects of PA breaks on measures of glucose, insulin and TAG could be relevant to the prevention of type 2 diabetes and atherosclerosis. The post-prandial [99] state is the more common metabolic state during non-sleeping hours for many people in modern society, who consume three large meals a day in addition to snacks and drinks [100]. Post-prandial and nocturnal hyperglycaemic excursions might be an early and undetected aspect of an insulin-resistant state [101]. Hyperglycaemic spikes are more strongly associated with, and might be more predictive of cardiovascular complications, risk and all-cause mortality than fasting plasma glucose or HbA1c levels [102] and should be targeted [103] since HbA1c is an integrative measure of blood glucose and post-prandial hyperglycaemia occurs even when HbA1c control is adequate [104]. Notably, post-load glucose-predicted cardiovascular mortality and diabetes, whereas neither fasting glucose nor HbA1c did [105]. Additionally, elevated 30 min post-load glycaemia is associated with increased risk of type 2 diabetes and all-cause mortality, independent of both fasting and 2 h post-load glucose [106]. Similarly, post-load insulin levels during a glucose tolerance test predict the development of type 2 diabetes [107], as insulin release is pulsatile, resulting in oscillating ultradian periodicity [108, 109]. Similarly, post-prandial excursions in TAG also increase CVD risk [110–114], via atherogenesis [115]. Therefore, the moderate decreases in post-prandial glucose and insulin, and the small decrease in post-prandial TAG, as a result of PA breaks in sitting, if confirmed in longer-term studies, may have implications for the prevention of metabolic disease, at least in comparison with only sitting.
This meta-analysis suggests any differences in metabolic effects between regular PA breaks and one continuous bout of exercise are non-existent for TAG (Fig. 9) and insulin (Fig. 12), or statistically significant but small for glucose (Fig. 10). In a previous meta-analysis [6], MPA breaks were more effective than a single prolonged bout of MPA at regulating glycaemia, even when the study in which the continuous bout resulted in double the amount of energy expended compared to the intermittent bout was included [6]. However, only three studies [60, 62, 83], two of which were energy matched [60, 62], were meta-analysed [6]. In our current meta-analysis, when EE was matched, there was a small and statistically significant effect in favour of regular PA breaks on post-prandial glycaemia (Fig. 10). In the largest meta-analysis of observational studies to date, the increased risk of all-cause and CVD mortality associated with high sitting time, specifically sitting for more than 8 h daily, was entirely eliminated by approximately 60-75 min daily, and reduced by approximately 30 min daily, of self-reported PA [116]. PA breaks in the current meta-analysis totalled approximately 30 min of PA daily, with a small but statistically significant advantage for PA breaks over continuous exercise. Taken together, the observational and experimental research suggest that PA breaks might have a small advantage over continuous exercise, but any such advantages are abolished with high amounts of daily exercise. However, such comparisons between cross-sectional controlled laboratory studies and observational studies need to be interpreted cautiously, as the results of Ekelund et al. cannot rule out possible effects resulting from patterns of accumulated sitting.
The evidence on the effects of sitting on metabolic health generated in our review is supported modestly by epidemiological evidence. Recent prospective studies of total sitting time and incident type 2 diabetes, in contrast to cross-sectional studies of sedentary time and breaks measured by self-report [117], found little evidence for an association [118], or associations, between sitting behaviour or time and incident type 2 diabetes, but were limited to inactive [119] or obese [120] participants only. To resolve the discordant findings of prospective versus cross-sectional epidemiological studies, which do suggest an association between sitting time and type 2 diabetes [117], future prospective studies utilising accelerometer assessed total sitting time need to be conducted. Few prospective epidemiologic studies to date have assessed the links between breaks and metabolic outcomes, and even fewer support any associations. Baseline breaks, independent of total sitting time, did not predict any metabolic outcomes at 6-month follow-up [121]. Breaks were not associated with all-cause mortality over 5 years of follow up in older men [122]. To our knowledge, only one prospective epidemiological study to date has found an association between longer sedentary behaviour bouts, synonymous with infrequent sedentary breaks, and mortality risk [123]. Sedentary breaks here refer to any break in sedentary behaviour, measured in observational studies typically with Actigraph accelerometry. Cross-sectional studies of breaks that report device-measured sedentary time and breaks also present an unclear picture, with Actigraph measured breaks being inversely associated with some metabolic markers [124, 125]. However, there was little evidence for an association between sedentary breaks, quantified by a thigh worn ActivPAL inclinometer, and diabetes or metabolic syndrome [126]. Conversely, using the same device, number of long sitting bouts was deleteriously associated with several glucose and lipid biomarkers, although somewhat ameliorated by MVPA [127]. Thus, there is conflicting cross-sectional observational evidence, perhaps or perhaps not supporting our findings for a small advantage of PA breaks over continuous exercise. It should be noted that in the current meta-analysis breaks were PA breaks, with standing breaks excluded; thus PA breaks in the included experimental studies are not the same as sedentary breaks in observational studies.
As sedentary behaviour and physical activity guidelines development require some relative consistency between different types of evidence (experimental, epidemiological, etc.), it is surprising how sedentary breaks became part of several national guidelines [5, 128–130] given that only one prospective observational study [123] objectively measured sedentary patterns, and none have used inclinometers, in relation to health risk. Additionally, only 1 experimental study [69] has investigated the effects of the patterning of PA breaks, reporting no differences between PA breaks performed every 20 or 60 min. Recently, the United States of America Physical Activity Guidelines Advisory Committee in its Scientific Report to the Secretary of Health and Human Services [24] concluded that there was insufficient evidence that bouts or breaks in SB are important factors in the relationship between SB and all-cause mortality, and incidence of or mortality from CVD, cancer, or incident type 2 diabetes or weight status. Accumulating brief bouts of PA between bouts of sitting throughout the day in a “whole day” approach [131] might be a feasible alternative for a considerable part of the population who do not exercise, a hypothesis that is supported by the results of the current meta-analysis, which found that there was a small advantage for PA breaks compared to one continuous exercise bout, on glucose, and no difference on insulin and TAG measures, especially as those with higher BMI appeared to benefit more. Therefore, given the results of the current meta-analysis of cross-sectional experimental studies, shedding light on the prospective associations between sedentary breaks and metabolic outcomes is an area of absolute priority for future epidemiological research.
In summary, the results of our systematic review and meta-analysis, viewed in the context of the wider literature, suggest that PA breaks, performed for example, throughout a normal working day, might be an alternative, or at worst, complementary for those who are unable to perform one bout of structured exercise training, particularly in those with higher BMIs, for the prevention of type 2 diabetes and atherosclerosis.
Future Research, and Reasons for Divergent Results
There was moderate to substantial heterogeneity (Figs. 4, 7) in the results that might be explained by the PA/health status of participants, sex, and also whether a study utilised single or multi-day designs.
It is unclear if the number, duration, intensity, amount and modality of PA breaks within a period of prolonged sitting, and the total duration of the sitting bout, are mediators in the metabolic responses to sitting, with only one study investigating and reporting that such variables did not affect glucose outcomes [69]. Most currently researched modalities involve light to moderate walking or running [7, 8, 13, 20, 21, 46, 68]. To date, only Dempsey et al. [47] and Hawari et al. [78] have examined metabolic responses to simple resistance activities (SRAs) as a means to interrupt sitting. Interestingly, engaging in own body weight resistance type exercises was associated with similar decreased risk of mortality compared to engaging in aerobic type exercise [132]. Pertinently, the modality of the exercise interrupting sitting, walking or cycling at very low intensity, even when energy matched, might play a role in modulating post-prandial glycaemic responses [14]. Future research should attempt to explore the effects of very light intensity breaks, such as fidgeting [133–135], that can be performed at a low enough intensity, or very short duration HIIT [89, 90, 136, 137] breaks in sitting which constitute, “exercise snacks” [138], so as to address concerns about productivity, impracticality, the habitual nature of sitting [139] and management support [140].
Additionally, different sitting periods were used, along with different patterns of PA breaks. Some used 2 day laboratory designs [7, 8, 11, 45], whereas others used 1 day [20, 60, 62, 77]. A free-living protocol over 1 day [70] or 4 days [74, 75] was also used. Participants sat for bouts between 2.5 [16], 4 [77], and 7–9 h [7, 8, 20, 45–47, 60, 62]. Breaking up sitting with exercise might have different effects depending on the duration of sitting, given that observational findings suggest that extended sitting time negatively affects metabolic health [123–125]. However, this is as yet untested experimentally. Additionally, the duration of individual discrete sitting bouts varied, for example 1.5 min of brisk walking every 15 min [20] or every 30 min [62]. Interestingly, when participants had their sleep restricted, PA breaks did not attenuate post-prandial glucose measures compared to sitting. Therefore, future experimental research could systematically explore the effects of the number, duration and intensity of PA breaks, and also the total duration of the sedentary bout in which PA breaks occurred.
People who were overweight [71] or had lower CRF [81] experienced greater attenuation in post-prandial glucose. Subgroup analysis showed that those who were physically inactive, or had IFG or type 2 diabetes, experienced statistically significant greater glycaemic benefits from PA breaks, and attenuation of insulin also approached significance (Figs. 5, 8). In support of this, meta-regression revealed that PA breaks had a greater effect on glucose in participants with higher BMI.
No or small differences in glycaemia or lipaemia between EX and INT were reported in studies involving highly fit young men with maximal aerobic capacity ( O2max) above 50 ml.kg.min−1 [7, 8, 45], whereas studies involving sedentary or metabolically unhealthy people appeared to find in favour of INT for glycaemia [20, 60, 62, 73] or continuous for lipaemia [62]. Glucose transport, uptake and metabolism might be higher in magnitude in the insulin sensitive compared to the insulin resistant [44]. Moreover, trained [42, 43] or insulin sensitive [41] participants demonstrate a greater response to a glucose or lipid challenge. Differences in glycaemia or lipaemia between sitting and PA breaks possibly would be greater in participants who are not exercise trained. Endurance training might alter lipid metabolite levels, composition and localisation, and thus muscle lipid metabolism and insulin sensitivity [41, 141].
We found a small body of evidence suggesting that sex might mediate glucose responses [13, 15, 47, 69] (Figs. 6, 11). Conversely, 2 studies [46, 72] reported no sex interactions for any outcomes when sitting was interrupted by light or moderate walking. Both sex specific PA break protocols or the underlying mechanisms, such as oestrogen levels [48–51], responsible for any possible sex divergent metabolic responses to PA breaks could be avenues for further research. It would be desirable if future studies recruited more than one sex and were powerful enough to analyse and report sex-specific results, even if this was done only for completeness and subsequent findings were put in the appendices.
Meal timings, type of meals, whether high fat [7, 8, 20, 45], high carbohydrate [60], or mixed meals [62, 77, 83], liquid [60, 62] or solid [7, 8, 20, 77, 83], varied. Liquid meals might lower the magnitude of post-prandial excursions [142], thus the results might be affected by whether liquid or solid meals were used. The macronutrient and amino acid composition [143–146], and the glycaemic index (GI) of meals may also modulate post-prandial metabolic responses.
Recently, Bailey et al. [63] reported that the GI of the breakfast meal and PA breaks both independently affected post-prandial glucose excursions, with little evidence that there were additive effects from combining PA breaks with a low GI meal.
Additionally, participants were fed one meal [46, 77] two meals [20], three meals [62] or six small meals [77]. Moreover, participants consumed their own breakfast prior to arrival in the laboratory for exercise trials [7, 8], whereas breakfast was provided for them as part of the test meal in another trial [20]. Therefore, feeding protocols might explain some of the heterogeneity in post-prandial responses, and should be investigated more comprehensively.
Furthermore, blood was drawn, for example, just before PA breaks [46, 47] or in rested, sedentary conditions, 1 day after PA breaks [7, 8], every 10 min [16], once every 2 h [10, 20] or assessed via CGMS [12, 14, 15, 22, 71, 82, 83]. Thus, results could have been affected by differing blood draw protocols [99, 147]. Notably, PA breaks reduced post-prandial iAUC up to 2 h after a meal, but not up to 4 h after [82], suggesting that meal timing in relation to blood draw schedule can significantly affect results.
Few studies so far have attempted to assess the underlying mechanisms responsible for metabolic responses to PA breaks, even if merely by assessing c-peptide, which would determine whether decreases in insulin are the result of decreased insulin secretion or increased clearance [148–151]. Additionally, only a few studies have assessed lipoproteins [77, 79], adipose tissue gene expression [73], molecular signalling involved in glucose metabolism [152], or used new metabolomics methods [153] to assess lipidomics [154], and none have assessed branched-chain amino acids [153].
Publication Bias
Since visual inspection of funnel plots is subjective and can lead to incorrect interpretations, even by medical researchers [155], a variety of methods were used to assess publication bias [53, 54, 156]. There might have been publication bias, or selective outcome or analysis reporting [56] in TAG measures from comparing PA breaks with sitting especially (Table 3) (Fig. 15). Additionally, there might have been publication bias for insulin measures from PA breaks compared to sitting and PA breaks compared to continuous exercise (Table 3). The Vevea and Woods [58] method estimated that the SMD for TAG measures comparing PA breaks with sitting would be reduced from − 0.27 to − 0.20, assuming severe 2-tailed selection bias (Table 3). Assuming the existence of severe 2-tailed bias, the effects of PA breaks on glucose and insulin would be still moderate, i.e. SMD of − 0.41 and − 0.43, respectively.
Risk of Bias
No subgroup analysis or meta-regression was performed to assess possible moderating effects of risk of bias on effect size because as stated, only a small number of studies reported randomisation, blinding and handling of data attrition clearly [15, 46, 47]. Future research should more clearly report randomisation, blinding and data attrition procedures, and should also more clearly fully report all data collected, even if statistically non-significant.
Strength and Weaknesses
The current work has a number of strengths. Experimental controlled studies that evaluated the metabolic effects of PA breaks and those of continuous or prolonged exercise in the context of prolonged sitting were systematically synthesised. The metabolic effects of PA breaks compared to no exercise sitting were also systematically synthesised. A variety of publication bias analyses were conducted, and effect sizes in the event of severe publication bias were also calculated. A meta-regression identified BMI as a moderator for glucose and insulin responses to PA breaks. When data were not reported in a study, they were obtained from the authors.
Despite this, the limitations of the current work must be mentioned. Selection bias is a possibility, as only published peer-reviewed studies were included. The inclusion criteria for the meta-analysis could be a limitation, as only trials with explicitly controlled PA break protocols were included. The exclusion of studies with “free living” protocols might affect the results. However, when free-living trials that did not use strictly controlled laboratory protocols [70, 74–76] were included in the meta-analyses the results and interpretation were not qualitatively substantively altered. For example when comparing EE matched PA breaks with continuous exercise, the SMD for glucose measures would have changed from − 0.26 (95% CI − 0.49 − 0.03, p = 0.03) to − 0.23 (95% CI − 0.41, − 0.05, p = 0.01). The SMD for insulin measures would have changed from 0.36 (95% CI − 0.45, 1.18, p = 0.38) to 0.24 (95% CI − 0.37, 0.84, p = 0.44), whereas the SMD for TAG would have changed from 0.06 (95% CI − 0.23, 0.36, p = 0.67) to − 0.01 (95% CI − 0.27, 0.26, p = 0.96). Similarly, when PA breaks were compared with sitting, with free-living trials included, the SMD for glucose measures changed from − 0.54 (95% CI − 0.70, − 0.37, p = 0.00001) to − 0.51 (95% CI − 0.67, − 0.35, p = 0.00001), for insulin measures from − 0.56 (95% CI − 0.74, − 0.38, p = 0.00001) to − 0.54 (95% CI:− 0.71, − 0.38, p = 0.00001), and for TAG measures from − 0.26 (95% CI − 0.44, − 0.09, p = 0.004) to − 0.31 (95% CI − 0.48, − 0.15, p = 0.0002).
In studies with more than 2 experimental conditions, the sample size of the control condition, uninterrupted sitting was divided by the number of times it was used as a control. For example, Pulsford et al. [21] had 3 experimental conditions, walking, cycling, and sitting. Therefore, in the meta-analyses, the sample size for the sitting condition was divided in half, as the sitting condition was used twice as the control comparison. When the results of experimental PA breaks conditions were combined instead, the SMD for glucose measures, comparing PA breaks with sitting, changed from − 0.54 (95% CI − 0.70, − 0.37, p = 0.00001) to − 0.52 (95% CI − 0.70, − 0.35, p = 0.00001). The SMD for insulin measures changed from − 0.56 (95% CI − 0.74, − 0.38, p = 0.00001) to − 0.54 (95% CI − 0.73, − 0.35, p = 0.00001) and the SMD for TAG measures changed from − 0.26 (95% CI − 0.44, − 0.09, p = 0.004) to − 0.26 (95% CI − 0.44, − 0.09, p = 0.005). The SMD for glucose measures, comparing PA breaks with continuous exercise, changed from − 0.26 (95% CI − 0.49, − 0.03, p = 0.03) to − 0.26 (95% CI − 0.50, − 0.02, p = 0.04).
Furthermore, the scales used to measure metabolic responses—CGMS, iAUC, tAUC—were heterogeneous. One study collected both CGMS [15] and venous blood [47] measurements. The current meta-analysis utilised the CGMS data from Dempsey et al. [15]. If the venous blood data from Dempsey et al. [47] were utilised instead, the SMD for blood glucose, for PA breaks versus sitting, would have changed from − 0.54 (95% CI − 0.70, − 0.38) to − 0.50 (95% CI − 0.65, − 0.35).
Altenburg et al. [67] was omitted from the meta-analysis, as data were not normally distributed and reported in medians, but inclusion would likely not have altered the main results. The meta-analysis included one study that was not randomised [77]. However, removing it would not have affected the results. TAG SMD for INT compared to SIT changed from − 0.27 (95% CI − 0.45, − 0.08, p = 0.005) to − 0.28 (95% CI − 0.48, − 0.08, p = 0.005). Similarly, TAG for INT compared to EX changed from 0.04 (95% CI − 0.23, 0.31, p = 0.77) to 0.00 (95% CI − 0.30, 0.29, p = 0.98).
Studies that included only interrupted sitting with standing were not included, as standing might not exceed 1.5 METs [29, 30] and heterogeneity in EE during standing might be affected by leg or body displacement [30]. Additionally, normal weight men and women, BMI: 22.5 ± 1.5 kg/m2, had higher leg muscle activity during sitting compared to the overweight, BMI: 28.4 ± 2.9 kg/m2. Conversely, leg muscle activity was higher in overweight adults during standing [31]. However, standing might confer positive [157] or negative [158, 159] physiological effects beyond simply EE, and thus a future meta-analysis should evaluate the effects of using standing to break up sitting.
Only BMI was assessed as a moderator variable in the meta-regression. could not be evaluated, as generally only studies with aerobically fit or physically active participants reported or values [7, 8, 11, 16, 45, 62]. Future experimental work should attempt to assess CRF, as it has been suggested that CRF might modulate responses to PA breaks in sitting [160]. Similarly, exercise intensity could not be assessed in the meta-regression due to intensity being reported either as absolute or relative intensity. Nor could the prior PA levels of participants be assessed as a continuous moderator because some studies merely reported highly aerobically fit participants as “recreationally active” [7, 8] whereas others did not report PA status [63, 68, 77]. Similarly, this meant that in the subgroup analyses (Figs. 3, 5, Electronic Supplementary Material Appendix S2—Figs S3, S5 and S6), studies were grouped such that participants in one subgroup were physically active, or sedentary, or were overweight/obese or had type 2 diabetes or IFG, compared to another subgroup with active people. It should be noted that differences observed in subgroup analyses (Fig. 15) based on summary data are considered observational, and need to be specifically tested in within subjects experimental designs, for example in participants with lower compared to higher BMI. Similarly, even though BMI was identified as a moderator in the meta-regression, this was based on summary data, is observational [86] and needs to be specifically tested in future experimental studies. Similarly, effect sizes were calculated using summary data from individual studies, and not individual participant level data.
Conclusion
Interrupting sitting with PA attenuates post-prandial glucose, insulin, and TAG, with greater glycaemic attenuation in people with high BMI. There was a small benefit for PA breaks compared to one continuous bout of exercise on glucose measures when exercise protocols were energy matched, and the difference was practically non-existent for insulin and TAG. The effect sizes were similar to those observed in meta-analyses of various traditional exercise protocols in diverse populations. Assuming that the acute metabolic effects we detected translate into long term metabolic benefits, PA breaks might be an alternative or adjunct to a single structured aerobic exercise bout, or more specifically, structured walking, running, or cycling, in people with higher BMI.
Electronic supplementary material
Below is the link to the electronic supplementary material.
Forest plot together with risk of bias assessment for the effects of PA breaks vs no-exercise sitting on TAG, stratified by sex (TIFF 992 kb)
Forest plot for the effects of physical activity breaks vs sitting on insulin, stratified by sex (TIFF 1133 kb)
Forest plot for the effects of physical activity breaks vs continuous exercise on triacylglyerol, active vs inactive/unfit/T2D/IFG (TIFF 831 kb)
Forest plot for the effects of PA breaks vs continuous exercise on TAG, stratified by sex (TIFF 772 kb)
Forest plot for the effects of physical activity breaks vs continuous exercise on glucose, active vs inactive/unfit/T2D/IFG (TIFF 1053 kb)
Forest plot for the effects of physical activity breaks vs continuous exercise on insulin, active vs inactive/unfit/T2D/IFG (TIFF 906 kb)
Forest plot for the effects of PA breaks vs continuous exercise on insulin, stratified by sex (TIFF 759 kb)
Compliance with Ethical Standards
Funding
Roland Loh is funded by a Kingston University London PhD Research degree Studentship. Emmanuel Stamatakis is funded by the National Health and Medical Research Council (Australia) through a Senior Research Fellowship, and a University of Sydney SOAR Fellowship. No specific sources of funding were used to assist in the preparation of this article.
Conflicts of interest
Roland Loh, Emmanuel Stamatakis, Dirk Folkerts, Judith E. Allgrove and Hannah Jayne Moir declare that they have no conflicts of interest relevant to the content of this review.
Contributor Information
Roland Loh, Email: rfloh@yahoo.com.
Hannah J. Moir, Email: H.Moir@kingston.ac.uk
References
- 1.Haskell WL, Lee I-M, Pate RR, Powell KE, Blair SN, Franklin BA, et al. Physical activity and public health: updated recommendation for adults from the American College of Sports Medicine and the American Heart Association. Circulation. 2007;116:1081–1093. doi: 10.1161/CIRCULATIONAHA.107.185649. [DOI] [PubMed] [Google Scholar]
- 2.Health matters: getting every adult active every day—GOV.UK. https://www.gov.uk/government/publications/health-matters-getting-every-adult-active-every-day/health-matters-getting-every-adult-active-every-day. Accessed 20 Feb 2018.
- 3.Sedentary Behaviour Research Network Letter to the editor: standardized use of the terms “sedentary” and “sedentary behaviours”. Appl Physiol Nutr Metab. 2012;37:540–542. doi: 10.1139/h2012-024. [DOI] [PubMed] [Google Scholar]
- 4.Tremblay MS, Aubert S, Barnes JD, Saunders TJ, Carson V, Latimer-Cheung AE, et al. Sedentary Behavior Research Network (SBRN)—terminology Consensus Project process and outcome. Int J Behav Nutr Phys Act. 2017;14:75. doi: 10.1186/s12966-017-0525-8. [DOI] [PMC free article] [PubMed] [Google Scholar]
- 5.Department of Health| Australia’s physical activity and sedentary behaviour guidelines: tips and ideas for adults (18–64 years). http://www.health.gov.au/internet/main/publishing.nsf/Content/ti-18-64years. Accessed 11 Jul 2017.
- 6.Chastin SFM, Egerton T, Leask C, Stamatakis E. Meta-analysis of the relationship between breaks in sedentary behavior and cardiometabolic health. Obes Silver Spring Md. 2015;23:1800–1810. doi: 10.1002/oby.21180. [DOI] [PubMed] [Google Scholar]
- 7.Miyashita M, Burns SF, Stensel DJ. Exercise and postprandial lipemia: effect of continuous compared with intermittent activity patterns. Am J Clin Nutr. 2006;83:24–29. doi: 10.1093/ajcn/83.1.24. [DOI] [PubMed] [Google Scholar]
- 8.Miyashita M, Burns SF, Stensel DJ. Accumulating short bouts of brisk walking reduces postprandial plasma triacylglycerol concentrations and resting blood pressure in healthy young men. Am J Clin Nutr. 2008;88:1225–1231. doi: 10.3945/ajcn.2008.26493. [DOI] [PubMed] [Google Scholar]
- 9.Miyashita M, Burns SF, Stensel DJ. Accumulating short bouts of running exercise throughout the day reduces postprandial plasma triacylglycerol concentrations and resting blood pressure in healthy young men. J Phys Act Health. 2006;3(1):112–123. doi: 10.1123/jpah.3.1.112. [DOI] [Google Scholar]
- 10.Miyashita M. Effects of continuous versus accumulated activity patterns on postprandial triacylglycerol concentrations in obese men. Int J Obes. 2005;2008(32):1271–1278. doi: 10.1038/ijo.2008.73. [DOI] [PubMed] [Google Scholar]
- 11.Miyashita M, Burns SF, Stensel DJ. Acute effects of accumulating exercise on postprandial lipemia and C-reactive protein concentrations in young men. Int J Sport Nutr Exerc Metab. 2009;19:569–582. doi: 10.1123/ijsnem.19.6.569. [DOI] [PubMed] [Google Scholar]
- 12.DiPietro L, Gribok A, Stevens MS, Hamm LF, Rumpler W. Three 15-min bouts of moderate postmeal walking significantly improves 24-h glycemic control in older people at risk for impaired glucose tolerance. Diabetes Care. 2013;36:3262–3268. doi: 10.2337/dc13-0084. [DOI] [PMC free article] [PubMed] [Google Scholar]
- 13.Bailey DP, Broom DR, Chrismas BCR, Taylor L, Flynn E, Hough J. Breaking up prolonged sitting time with walking does not affect appetite or gut hormone concentrations but does induce an energy deficit and suppresses postprandial glycaemia in sedentary adults. Appl Physiol Nutr Metab. 2016;41:324–331. doi: 10.1139/apnm-2015-0462. [DOI] [PubMed] [Google Scholar]
- 14.Crespo NC, Mullane SL, Zeigler ZS, Buman MP, Gaesser GA. Effects of standing and light-intensity walking and cycling on 24-h glucose. Med Sci Sports Exerc. 2016;48:2503–2511. doi: 10.1249/MSS.0000000000001062. [DOI] [PubMed] [Google Scholar]
- 15.Dempsey PC, Blankenship JM, Larsen RN, Sacre JW, Sethi P, Straznicky NE, et al. Interrupting prolonged sitting in type 2 diabetes: nocturnal persistence of improved glycaemic control. Diabetologia. 2017;60:499–507. doi: 10.1007/s00125-016-4169-z. [DOI] [PubMed] [Google Scholar]
- 16.Hansen RK, Andersen JB, Vinther AS, Pielmeier U, Larsen RG. Breaking up prolonged sitting does not alter postprandial glycemia in young, normal-weight men and women. Int J Sports Med. 2016;37:1097–1102. doi: 10.1055/s-0042-113466. [DOI] [PubMed] [Google Scholar]
- 17.Henson J, Davies MJ, Bodicoat DH, Edwardson CL, Gill JMR, Stensel DJ, et al. Breaking up prolonged sitting with standing or walking attenuates the postprandial metabolic response in postmenopausal women: a randomized acute study. Diabetes Care. 2016;39:130–138. doi: 10.2337/dc15-1240. [DOI] [PubMed] [Google Scholar]
- 18.Honda H, Igaki M, Hatanaka Y, Komatsu M, Tanaka S-I, Miki T, et al. Stair climbing/descending exercise for a short time decreases blood glucose levels after a meal in people with type 2 diabetes. BMJ Open Diabetes Res Care. 2016;4:e000232. doi: 10.1136/bmjdrc-2016-000232. [DOI] [PMC free article] [PubMed] [Google Scholar]
- 19.Larsen RN, Kingwell BA, Robinson C, Hammond L, Cerin E, Shaw JE, et al. Breaking up of prolonged sitting over three days sustains, but does not enhance, lowering of postprandial plasma glucose and insulin in overweight and obese adults. Clin Sci (Lond). 2015;129:117–127. doi: 10.1042/CS20140790. [DOI] [PubMed] [Google Scholar]
- 20.Miyashita M, Edamoto K, Kidokoro T, Yanaoka T, Kashiwabara K, Takahashi M, et al. Interrupting sitting time with regular walks attenuates postprandial triglycerides. Int J Sports Med. 2016;37:97–103. doi: 10.1055/s-0035-1559791. [DOI] [PubMed] [Google Scholar]
- 21.Pulsford RM, Blackwell J, Hillsdon M, Kos K. Intermittent walking, but not standing, improves postprandial insulin and glucose relative to sustained sitting: a randomised cross-over study in inactive middle-aged men. J Sci Med Sport. 2017;20:278–283. doi: 10.1016/j.jsams.2016.08.012. [DOI] [PubMed] [Google Scholar]
- 22.Wennberg P, Boraxbekk C-J, Wheeler M, Howard B, Dempsey PC, Lambert G, et al. Acute effects of breaking up prolonged sitting on fatigue and cognition: a pilot study. BMJ Open. 2016;6:e009630. doi: 10.1136/bmjopen-2015-009630. [DOI] [PMC free article] [PubMed] [Google Scholar]
- 23.Benatti FB, Ried-Larsen M. The effects of breaking up prolonged sitting time: a review of experimental studies. Med Sci Sports Exerc. 2015;47:2053–2061. doi: 10.1249/MSS.0000000000000654. [DOI] [PubMed] [Google Scholar]
- 24.Advisory Committee Report. https://health.gov/paguidelines/report/. Accessed 15 Mar 2018.
- 25.Liberati A, Altman DG, Tetzlaff J, Mulrow C, Gøtzsche PC, Ioannidis JPA, et al. The PRISMA statement for reporting systematic reviews and meta-analyses of studies that evaluate healthcare interventions: explanation and elaboration. BMJ. 2009;339:b2700. doi: 10.1136/bmj.b2700. [DOI] [PMC free article] [PubMed] [Google Scholar]
- 26.Shamseer L, Moher D, Clarke M, Ghersi D, Liberati A, Petticrew M, et al. Preferred reporting items for systematic review and meta-analysis protocols (PRISMA-P) 2015: elaboration and explanation. BMJ. 2015;349:g7647. doi: 10.1136/bmj.g7647. [DOI] [PubMed] [Google Scholar]
- 27.Riva JJ, Malik KMP, Burnie SJ, Endicott AR, Busse JW. What is your research question? An introduction to the PICOT format for clinicians. J Can Chiropr Assoc. 2012;56:167–171. [PMC free article] [PubMed] [Google Scholar]
- 28.Afshin A, Peñalvo JL, Del Gobbo L, Silva J, Michaelson M, O’Flaherty M, et al. The prospective impact of food pricing on improving dietary consumption: a systematic review and meta-analysis. PLoS ONE. 2017;12:e0172277. doi: 10.1371/journal.pone.0172277. [DOI] [PMC free article] [PubMed] [Google Scholar]
- 29.Mansoubi M, Pearson N, Clemes SA, Biddle SJ, Bodicoat DH, Tolfrey K, et al. Energy expenditure during common sitting and standing tasks: examining the 1.5 MET definition of sedentary behaviour. BMC Public Health. 2015;15:516. [DOI] [PMC free article] [PubMed]
- 30.Miles-Chan JL, Fares E-J, Berkachy R, Jacquet P, Isacco L, Schutz Y, et al. Standing economy: does the heterogeneity in the energy cost of posture maintenance reside in differential patterns of spontaneous weight-shifting? Eur J Appl Physiol. 2017;117:795–807. doi: 10.1007/s00421-017-3563-7. [DOI] [PubMed] [Google Scholar]
- 31.Pesola AJ, Laukkanen A, Tikkanen O, Finni T. Heterogeneity of muscle activity during sedentary behavior. Appl Physiol Nutr Metab. 2016;41:1155–1162. doi: 10.1139/apnm-2016-0170. [DOI] [PubMed] [Google Scholar]
- 32.Higgins JPT, Altman DG, Gøtzsche PC, Jüni P, Moher D, Oxman AD, et al. The Cochrane Collaboration’s tool for assessing risk of bias in randomised trials. BMJ. 2011;343:d5928. doi: 10.1136/bmj.d5928. [DOI] [PMC free article] [PubMed] [Google Scholar]
- 33.Cochrane handbook for systematic reviews of interventions. http://handbook-5-1.cochrane.org/. Accessed 11 Jul 2017.
- 34.Le Floch JP, Escuyer P, Baudin E, Baudon D, Perlemuter L. Blood glucose area under the curve. Methodological aspects. Diabetes Care. 1990;13:172–175. doi: 10.2337/diacare.13.2.172. [DOI] [PubMed] [Google Scholar]
- 35.Carstensen M, Thomsen C, Hermansen K. Incremental area under response curve more accurately describes the triglyceride response to an oral fat load in both healthy and type 2 diabetic subjects. Metabolism. 2003;52:1034–1037. doi: 10.1016/S0026-0495(03)00155-0. [DOI] [PubMed] [Google Scholar]
- 36.Wolever TMS. Effect of blood sampling schedule and method of calculating the area under the curve on validity and precision of glycaemic index values. Br J Nutr. 2004;91:295–301. doi: 10.1079/BJN20031054. [DOI] [PubMed] [Google Scholar]
- 37.Nakagawa S, Noble DWA, Senior AM, Lagisz M. Meta-evaluation of meta-analysis: ten appraisal questions for biologists. BMC Biol. 2017;15:18. doi: 10.1186/s12915-017-0357-7. [DOI] [PMC free article] [PubMed] [Google Scholar]
- 38.Cohen J. Statistical power analysis for the behavioral sciences. London: Routledge; 1988. [Google Scholar]
- 39.Peddie MC, Rehrer NJ, Perry TL. Physical activity and postprandial lipidemia: are energy expenditure and lipoprotein lipase activity the real modulators of the positive effect? Prog Lipid Res. 2012;51:11–22. doi: 10.1016/j.plipres.2011.11.002. [DOI] [PubMed] [Google Scholar]
- 40.Maraki MI, Sidossis LS. The latest on the effect of prior exercise on postprandial lipaemia. Sports Med. 2013;43:463–481. doi: 10.1007/s40279-013-0046-9. [DOI] [PMC free article] [PubMed] [Google Scholar]
- 41.Chow LS, Mashek DG, Austin E, Eberly LE, Persson X-M, Mashek MT, et al. Training status diverges muscle diacylglycerol accumulation during free fatty acid elevation. Am J Physiol Endocrinol Metab. 2014;307:E124–E131. doi: 10.1152/ajpendo.00166.2014. [DOI] [PMC free article] [PubMed] [Google Scholar]
- 42.Iozzo P, Takala T, Oikonen V, Bergman J, Grönroos T, Ferrannini E, et al. Effect of training status on regional disposal of circulating free fatty acids in the liver and skeletal muscle during physiological hyperinsulinemia. Diabetes Care. 2004;27:2172–2177. doi: 10.2337/diacare.27.9.2172. [DOI] [PubMed] [Google Scholar]
- 43.Phielix E, Meex R, Ouwens DM, Sparks L, Hoeks J, Schaart G, et al. High oxidative capacity due to chronic exercise training attenuates lipid-induced insulin resistance. Diabetes. 2012;61:2472–2478. doi: 10.2337/db11-1832. [DOI] [PMC free article] [PubMed] [Google Scholar]
- 44.Sylow L, Kleinert M, Richter EA, Jensen TE. Exercise-stimulated glucose uptake—regulation and implications for glycaemic control. Nat Rev Endocrinol. 2017;13:133–148. doi: 10.1038/nrendo.2016.162. [DOI] [PubMed] [Google Scholar]
- 45.Kim I-Y, Park S, Trombold JR, Coyle EF. Effects of moderate- and intermittent low-intensity exercise on postprandial lipemia. Med Sci Sports Exerc. 2014;46:1882–1890. doi: 10.1249/MSS.0000000000000324. [DOI] [PubMed] [Google Scholar]
- 46.Dunstan DW, Kingwell BA, Larsen R, Healy GN, Cerin E, Hamilton MT, et al. Breaking up prolonged sitting reduces postprandial glucose and insulin responses. Diabetes Care. 2012;35:976–983. doi: 10.2337/dc11-1931. [DOI] [PMC free article] [PubMed] [Google Scholar]
- 47.Dempsey PC, Larsen RN, Sethi P, Sacre JW, Straznicky NE, Cohen ND, et al. Benefits for Type 2 Diabetes of Interrupting Prolonged Sitting With Brief Bouts of Light Walking or Simple Resistance Activities. Diabetes Care. 2016;39:964–972. doi: 10.2337/dc15-2336. [DOI] [PubMed] [Google Scholar]
- 48.Henderson GC. Sexual dimorphism in the effects of exercise on metabolism of lipids to support resting metabolism. Front Endocrinol. 2014;5:162. doi: 10.3389/fendo.2014.00162. [DOI] [PMC free article] [PubMed] [Google Scholar]
- 49.Kautzky-Willer A, Harreiter J, Pacini G. Sex and gender differences in risk, pathophysiology and complications of type 2 diabetes mellitus. Endocrinol Rev. 2016;37:278–316. doi: 10.1210/er.2015-1137. [DOI] [PMC free article] [PubMed] [Google Scholar]
- 50.Lundsgaard A-M, Kiens B. Gender differences in skeletal muscle substrate metabolism—molecular mechanisms and insulin sensitivity. Front Endocrinol. 2014;5:195. doi: 10.3389/fendo.2014.00195. [DOI] [PMC free article] [PubMed] [Google Scholar]
- 51.Morselli E, Frank AP, Santos RS, Fátima LA, Palmer BF, Clegg DJ. Sex and gender: critical variables in pre-clinical and clinical medical research. Cell Metab. 2016;24:203–209. doi: 10.1016/j.cmet.2016.07.017. [DOI] [PubMed] [Google Scholar]
- 52.Spangenburg EE, Geiger PC, Leinwand LA, Lowe DA. Regulation of physiological and metabolic function of muscle by female sex steroids. Med Sci Sports Exerc. 2012;44:1653–1662. doi: 10.1249/MSS.0b013e31825871fa. [DOI] [PMC free article] [PubMed] [Google Scholar]
- 53.Begg CB, Mazumdar M. Operating characteristics of a rank correlation test for publication bias. Biometrics. 1994;50:1088–1101. doi: 10.2307/2533446. [DOI] [PubMed] [Google Scholar]
- 54.Egger M, Davey Smith G, Schneider M, Minder C. Bias in meta-analysis detected by a simple, graphical test. BMJ. 1997;315:629–634. doi: 10.1136/bmj.315.7109.629. [DOI] [PMC free article] [PubMed] [Google Scholar]
- 55.Publication bias.pdf. https://www.meta-analysis.com/downloads/Publication%20bias.pdf. Accessed 11 Jul 2017.
- 56.Sterne JAC, Sutton AJ, Ioannidis JPA, Terrin N, Jones DR, Lau J, et al. Recommendations for examining and interpreting funnel plot asymmetry in meta-analyses of randomised controlled trials. BMJ. 2011;343:d4002. doi: 10.1136/bmj.d4002. [DOI] [PubMed] [Google Scholar]
- 57.Duval S, Tweedie R. Trim and fill: a simple funnel-plot-based method of testing and adjusting for publication bias in meta-analysis. Biometrics. 2000;56:455–463. doi: 10.1111/j.0006-341X.2000.00455.x. [DOI] [PubMed] [Google Scholar]
- 58.Vevea JL, Woods CM. Publication bias in research synthesis: sensitivity analysis using a priori weight functions. Psychol Methods. 2005;10:428–443. doi: 10.1037/1082-989X.10.4.428. [DOI] [PubMed] [Google Scholar]
- 59.Field AP, Gillett R. How to do a meta-analysis. Br J Math Stat Psychol. 2010;63:665–694. doi: 10.1348/000711010X502733. [DOI] [PubMed] [Google Scholar]
- 60.Holmstrup M, Fairchild T, Keslacy S, Weinstock R, Kanaley J. Multiple short bouts of exercise over 12-h period reduce glucose excursions more than an energy-matched single bout of exercise. Metabolism. 2014;63:510–519. doi: 10.1016/j.metabol.2013.12.006. [DOI] [PMC free article] [PubMed] [Google Scholar]
- 61.Kerr J, Crist K, Vital DG, Dillon L, Aden SA, Trivedi M, et al. Acute glucoregulatory and vascular outcomes of three strategies for interrupting prolonged sitting time in postmenopausal women: a pilot, laboratory-based, randomized, controlled, 4-condition, 4-period crossover trial. PLoS One. 2017;12:e0188544. doi: 10.1371/journal.pone.0188544. [DOI] [PMC free article] [PubMed] [Google Scholar]
- 62.Peddie MC, Bone JL, Rehrer NJ, Skeaff CM, Gray AR, Perry TL. Breaking prolonged sitting reduces postprandial glycemia in healthy, normal-weight adults: a randomized crossover trial. Am J Clin Nutr. 2013;98:358–366. doi: 10.3945/ajcn.112.051763. [DOI] [PubMed] [Google Scholar]
- 63.Bailey DP, Maylor BD, Orton CJ, Zakrzewski-Fruer JK. Effects of breaking up prolonged sitting following low and high glycaemic index breakfast consumption on glucose and insulin concentrations. Eur J Appl Physiol. 2017;117:1299–1307. doi: 10.1007/s00421-017-3610-4. [DOI] [PMC free article] [PubMed] [Google Scholar]
- 64.Kashiwabara K, Kidokoro T, Yanaoka T, Burns SF, Stensel DJ, Miyashita M. Different patterns of walking and postprandial triglycerides in older women. Med Sci Sports Exerc. 2018;50:79–87. doi: 10.1249/MSS.0000000000001413. [DOI] [PMC free article] [PubMed] [Google Scholar]
- 65.Homer AR, Fenemor SP, Perry TL, Rehrer NJ, Cameron CM, Skeaff CM, et al. Regular activity breaks combined with physical activity improve postprandial plasma triglyceride, nonesterified fatty acid, and insulin responses in healthy, normal weight adults: a randomized crossover trial. J Clin Lipidol. 2017;11(1268):1279.e1. doi: 10.1016/j.jacl.2017.06.007. [DOI] [PubMed] [Google Scholar]
- 66.Yamaguchi Y, Maruo K, Partlett C, Riley RD. A random effects meta-analysis model with Box-Cox transformation. BMC Med Res Methodol. 2017;17:109. doi: 10.1186/s12874-017-0376-7. [DOI] [PMC free article] [PubMed] [Google Scholar]
- 67.Altenburg TM, Rotteveel J, Dunstan DW, Salmon J, Chinapaw MJM. The effect of interrupting prolonged sitting time with short, hourly, moderate-intensity cycling bouts on cardiometabolic risk factors in healthy, young adults. J Appl Physiol. 2013;115:1751–1756. doi: 10.1152/japplphysiol.00662.2013. [DOI] [PubMed] [Google Scholar]
- 68.Bailey DP, Locke CD. Breaking up prolonged sitting with light-intensity walking improves postprandial glycemia, but breaking up sitting with standing does not. J Sci Med Sport. 2015;18:294–298. doi: 10.1016/j.jsams.2014.03.008. [DOI] [PubMed] [Google Scholar]
- 69.Bhammar DM, Sawyer BJ, Tucker WJ, Gaesser GA. Breaks in sitting time: effects on continuously monitored glucose and blood pressure. Med Sci Sports Exerc. 2017;49:2119–2130. doi: 10.1249/MSS.0000000000001315. [DOI] [PubMed] [Google Scholar]
- 70.Blankenship JM, Granados K, Braun B. Effects of subtracting sitting versus adding exercise on glycemic control and variability in sedentary office workers. Appl Physiol Nutr Metab. 2014;39:1286–1293. doi: 10.1139/apnm-2014-0157. [DOI] [PubMed] [Google Scholar]
- 71.Brocklebank LA, Andrews RC, Page A, Falconer CL, Leary S, Cooper A. The acute effects of breaking up seated office work with standing or light-intensity walking on interstitial glucose concentration: a randomized crossover trial. J Phys Act Health. 2017;14:617–625. doi: 10.1123/jpah.2016-0366. [DOI] [PubMed] [Google Scholar]
- 72.Champion RB, Smith LR, Smith J, Hirlav B, Maylor BD, White SL, et al. Reducing prolonged sedentary time using a treadmill desk acutely improves cardiometabolic risk markers in male and female adults. J Sports Sci. 2018;36:2484–2491. doi: 10.1080/02640414.2018.1464744. [DOI] [PubMed] [Google Scholar]
- 73.Chen Y-C, Betts JA, Walhin J-P, Thompson D. Adipose tissue responses to breaking sitting in men and women with central adiposity. Med Sci Sports Exerc. 2018;50:2049–2057. doi: 10.1249/MSS.0000000000001654. [DOI] [PubMed] [Google Scholar]
- 74.Duvivier BMFM, Schaper NC, Bremers MA, van Crombrugge G, Menheere PPCA, Kars M, et al. Minimal intensity physical activity (standing and walking) of longer duration improves insulin action and plasma lipids more than shorter periods of moderate to vigorous exercise (cycling) in sedentary subjects when energy expenditure is comparable. PLoS One. 2013;8:e55542. doi: 10.1371/journal.pone.0055542. [DOI] [PMC free article] [PubMed] [Google Scholar]
- 75.Duvivier BMFM, Schaper NC, Hesselink MKC, van Kan L, Stienen N, Winkens B, et al. Breaking sitting with light activities vs structured exercise: a randomised crossover study demonstrating benefits for glycaemic control and insulin sensitivity in type 2 diabetes. Diabetologia. 2017;60:490–498. doi: 10.1007/s00125-016-4161-7. [DOI] [PMC free article] [PubMed] [Google Scholar]
- 76.Duvivier BMFM, Schaper NC, Koster A, van Kan L, Peters HPF, Adam JJ, et al. Benefits of substituting sitting with standing and walking in free-living conditions for cardiometabolic risk markers, cognition and mood in overweight adults. Front Physiol. 2017;8:353. doi: 10.3389/fphys.2017.00353. [DOI] [PMC free article] [PubMed] [Google Scholar]
- 77.Engeroff T, Füzéki E, Vogt L, Banzer W. Breaking up sedentary time, physical activity and lipoprotein metabolism. J Sci Med Sport. 2017;20:678–683. doi: 10.1016/j.jsams.2016.11.018. [DOI] [PubMed] [Google Scholar]
- 78.Hawari NSA, Wilson J, Gill JMR. Effects of breaking up sedentary time with “chair squats” on postprandial metabolism. J Sports Sci. 2019;37:331–338. doi: 10.1080/02640414.2018.1500856. [DOI] [PubMed] [Google Scholar]
- 79.Maylor BD, Zakrzewski-Fruer JK, Orton CJ, Bailey DP. Beneficial postprandial lipaemic effects of interrupting sedentary time with high-intensity physical activity versus a continuous moderate-intensity physical activity bout: a randomised crossover trial. J Sci Med Sport. 2018;21:1250–1255. doi: 10.1016/j.jsams.2018.05.022. [DOI] [PubMed] [Google Scholar]
- 80.McCarthy M, Edwardson CL, Davies MJ, Henson J, Rowlands A, King JA, et al. Breaking up sedentary time with seated upper body activity can regulate metabolic health in obese high risk adults: a randomised crossover trial. Diabetes Obes Metab. 2017;19:1732–1739. doi: 10.1111/dom.13016. [DOI] [PubMed] [Google Scholar]
- 81.McCarthy M, Edwardson CL, Davies MJ, Henson J, Bodicoat DH, Khunti K, et al. Fitness moderates glycemic responses to sitting and light activity breaks. Med Sci Sports Exerc. 2017;49:2216–2222. doi: 10.1249/MSS.0000000000001338. [DOI] [PubMed] [Google Scholar]
- 82.Rodriguez-Hernandez M, Martin JS, Pascoe DD, Roberts MD, Wadsworth DW. Multiple short bouts of walking activity attenuate glucose response in obese women. J Phys Act Health. 2018;15:279–286. doi: 10.1123/jpah.2017-0251. [DOI] [PubMed] [Google Scholar]
- 83.van Dijk J-W, Venema M, van Mechelen W, Stehouwer CDA, Hartgens F, van Loon LJC. Effect of moderate-intensity exercise versus activities of daily living on 24-hour blood glucose homeostasis in male patients with type 2 diabetes. Diabetes Care. 2013;36:3448–3453. doi: 10.2337/dc12-2620. [DOI] [PMC free article] [PubMed] [Google Scholar]
- 84.Vincent GE, Jay SM, Sargent C, Kovac K, Vandelanotte C, Ridgers ND, et al. The impact of breaking up prolonged sitting on glucose metabolism and cognitive function when sleep is restricted. Neurobiol Sleep Circadian Rhythms. 2018;4:17–23. doi: 10.1016/j.nbscr.2017.09.001. [DOI] [PMC free article] [PubMed] [Google Scholar]
- 85.Ensure that there are adequate studies. http://handbook-5-1.cochrane.org/chapter_9/9_6_5_1_ensure_that_there_are_adequate_studies_to_justify.htm. Accessed 9 Feb 2018.
- 86.Thompson SG, Higgins JPT. How should meta-regression analyses be undertaken and interpreted? Stat Med. 2002;21:1559–1573. doi: 10.1002/sim.1187. [DOI] [PubMed] [Google Scholar]
- 87.Vincent GE, Jay SM, Sargent C, Kovac K, Lastella M, Vandelanotte C, et al. Does breaking up prolonged sitting when sleep restricted affect postprandial glucose responses and subsequent sleep architecture?—a pilot study. Bartlett C Chennaoui, Clemes, Iber, Kline, Portaluppi, Reutrakul, Roth, Sigal, Vincent, Vincent, Wennberg, Wu, Zeitzer, editor. Chronobiol Int. 2018;No-Specified. [DOI] [PubMed]
- 88.Pai L-W, Li T-C, Hwu Y-J, Chang S-C, Chen L-L, Chang P-Y. The effectiveness of regular leisure-time physical activities on long-term glycemic control in people with type 2 diabetes: a systematic review and meta-analysis. Diabetes Res Clin Pract. 2016;113:77–85. doi: 10.1016/j.diabres.2016.01.011. [DOI] [PubMed] [Google Scholar]
- 89.Jelleyman C, Yates T, O’Donovan G, Gray LJ, King JA, Khunti K, et al. The effects of high-intensity interval training on glucose regulation and insulin resistance: a meta-analysis. Obes Rev. 2015;16:942–961. doi: 10.1111/obr.12317. [DOI] [PubMed] [Google Scholar]
- 90.Batacan RB, Duncan MJ, Dalbo VJ, Tucker PS, Fenning AS. Effects of high-intensity interval training on cardiometabolic health: a systematic review and meta-analysis of intervention studies. Br J Sports Med. 2017;51:494–503. doi: 10.1136/bjsports-2015-095841. [DOI] [PubMed] [Google Scholar]
- 91.Katsagoni CN, Georgoulis M, Papatheodoridis GV, Panagiotakos DB, Kontogianni MD. Effects of lifestyle interventions on clinical characteristics of patients with non-alcoholic fatty liver disease: a meta-analysis. Metabolism. 2017;68:119–132. doi: 10.1016/j.metabol.2016.12.006. [DOI] [PubMed] [Google Scholar]
- 92.Freese EC, Gist NH, Cureton KJ. Effect of prior exercise on postprandial lipemia: an updated quantitative review. J Appl Physiol. 2014;116:67–75. doi: 10.1152/japplphysiol.00623.2013. [DOI] [PubMed] [Google Scholar]
- 93.Saunders TJ, Atkinson HF, Burr J, MacEwen B, Skeaff CM, Peddie MC. The acute metabolic and vascular impact of interrupting prolonged sitting: a systematic review and meta-analysis. Sports Med. 2018;48:2347–2366. doi: 10.1007/s40279-018-0963-8. [DOI] [PubMed] [Google Scholar]
- 94.Tolfrey K, Doggett A, Boyd C, Pinner S, Sharples A, Barrett L. Postprandial triacylglycerol in adolescent boys: a case for moderate exercise. Med Sci Sports Exerc. 2008;40:1049–1056. doi: 10.1249/MSS.0b013e31816770fe. [DOI] [PubMed] [Google Scholar]
- 95.Tolfrey K, Bentley C, Goad M, Varley J, Willis S, Barrett L. Effect of energy expenditure on postprandial triacylglycerol in adolescent boys. Eur J Appl Physiol. 2012;112:23–31. doi: 10.1007/s00421-011-1936-x. [DOI] [PubMed] [Google Scholar]
- 96.Saunders TJ, Chaput J-P, Goldfield GS, Colley RC, Kenny GP, Doucet E, et al. Prolonged sitting and markers of cardiometabolic disease risk in children and youth: a randomized crossover study. Metabolism. 2013;62:1423–1428. doi: 10.1016/j.metabol.2013.05.010. [DOI] [PubMed] [Google Scholar]
- 97.Fletcher EA, Salmon J, McNaughton SA, Orellana L, Wadley GD, Bruce C, et al. Effects of breaking up sitting on adolescents’ postprandial glucose after consuming meals varying in energy: a cross-over randomised trial. J Sci Med Sport. 2018;21:280–285. doi: 10.1016/j.jsams.2017.06.002. [DOI] [PubMed] [Google Scholar]
- 98.Belcher BR, Berrigan D, Papachristopoulou A, Brady SM, Bernstein SB, Brychta RJ, et al. Effects of interrupting children’s sedentary behaviors with activity on metabolic function: a randomized trial. J Clin Endocrinol Metab. 2015;100:3735–3743. doi: 10.1210/jc.2015-2803. [DOI] [PMC free article] [PubMed] [Google Scholar]
- 99.Frayn KN. Metabolic regulation a human perspective third edition. 3. Oxford: Wiley-Blackwell; 2010. [Google Scholar]
- 100.Daenen S, Sola-Gazagnes A, M’Bemba J, Dorange-Breillard C, Defer F, Elgrably F, et al. Peak-time determination of post-meal glucose excursions in insulin-treated diabetic patients. Diabetes Metab. 2010;36:165–169. doi: 10.1016/j.diabet.2009.12.002. [DOI] [PubMed] [Google Scholar]
- 101.Hay LC, Wilmshurst EG, Fulcher G. Unrecognized hypo- and hyperglycemia in well-controlled patients with type 2 diabetes mellitus: the results of continuous glucose monitoring. Diabetes Technol Ther. 2003;5:19–26. doi: 10.1089/152091503763816427. [DOI] [PubMed] [Google Scholar]
- 102.Ceriello A. Acute hyperglycaemia: a “new” risk factor during myocardial infarction. Eur Heart J. 2005;26:328–331. doi: 10.1093/eurheartj/ehi049. [DOI] [PubMed] [Google Scholar]
- 103.Cavalot F, Pagliarino A, Valle M, Di Martino L, Bonomo K, Massucco P, et al. Postprandial blood glucose predicts cardiovascular events and all-cause mortality in type 2 diabetes in a 14-year follow-up: lessons from the San Luigi Gonzaga Diabetes Study. Diabetes Care. 2011;34:2237–2243. doi: 10.2337/dc10-2414. [DOI] [PMC free article] [PubMed] [Google Scholar]
- 104.Bonora E, Corrao G, Bagnardi V, Ceriello A, Comaschi M, Montanari P, et al. Prevalence and correlates of post-prandial hyperglycaemia in a large sample of patients with type 2 diabetes mellitus. Diabetologia. 2006;49:846–854. doi: 10.1007/s00125-006-0203-x. [DOI] [PubMed] [Google Scholar]
- 105.Shahim B, De Bacquer D, De Backer G, Gyberg V, Kotseva K, Mellbin L, et al. The prognostic value of fasting plasma glucose, two-hour postload glucose, and HbA1c in patients with coronary artery disease: a report from EUROASPIRE IV: a survey from the European Society of Cardiology. Diabetes Care. 2017;40:1233–1240. doi: 10.2337/dc17-0245. [DOI] [PMC free article] [PubMed] [Google Scholar]
- 106.Hulman A, Vistisen D, Glümer C, Bergman M, Witte DR, Færch K. Glucose patterns during an oral glucose tolerance test and associations with future diabetes, cardiovascular disease and all-cause mortality rate. Diabetologia. 2018;61:101–107. doi: 10.1007/s00125-017-4468-z. [DOI] [PubMed] [Google Scholar]
- 107.Hayashi T, Boyko EJ, Sato KK, McNeely MJ, Leonetti DL, Kahn SE, et al. Patterns of insulin concentration during the OGTT predict the risk of type 2 diabetes in Japanese Americans. Diabetes Care. 2013;36:1229–1235. doi: 10.2337/dc12-0246. [DOI] [PMC free article] [PubMed] [Google Scholar]
- 108.Hellman B. Pulsatility of insulin release—a clinically important phenomenon. Ups J Med Sci. 2009;114:193–205. doi: 10.3109/03009730903366075. [DOI] [PMC free article] [PubMed] [Google Scholar]
- 109.Schmitz O, Rungby J, Edge L, Juhl CB. On high-frequency insulin oscillations. Ageing Res Rev. 2008;7:301–305. doi: 10.1016/j.arr.2008.04.002. [DOI] [PubMed] [Google Scholar]
- 110.Bansal S, Buring JE, Rifai N, Mora S, Sacks FM, Ridker PM. Fasting compared with nonfasting triglycerides and risk of cardiovascular events in women. JAMA. 2007;298:309–316. doi: 10.1001/jama.298.3.309. [DOI] [PubMed] [Google Scholar]
- 111.Freiberg JJ, Tybjaerg-Hansen A, Jensen JS, Nordestgaard BG. Nonfasting triglycerides and risk of ischemic stroke in the general population. JAMA. 2008;300:2142–2152. doi: 10.1001/jama.2008.621. [DOI] [PubMed] [Google Scholar]
- 112.Langsted A, Freiberg JJ, Nordestgaard BG. Fasting and nonfasting lipid levels: influence of normal food intake on lipids, lipoproteins, apolipoproteins, and cardiovascular risk prediction. Circulation. 2008;118:2047–2056. doi: 10.1161/CIRCULATIONAHA.108.804146. [DOI] [PubMed] [Google Scholar]
- 113.Nordestgaard BG, Benn M, Schnohr P, Tybjaerg-Hansen A. Nonfasting triglycerides and risk of myocardial infarction, ischemic heart disease, and death in men and women. JAMA. 2007;298:299–308. doi: 10.1001/jama.298.3.299. [DOI] [PubMed] [Google Scholar]
- 114.Teno S, Uto Y, Nagashima H, Endoh Y, Iwamoto Y, Omori Y, et al. Association of postprandial hypertriglyceridemia and carotid intima-media thickness in patients with type 2 diabetes. Diabetes Care. 2000;23:1401–1406. doi: 10.2337/diacare.23.9.1401. [DOI] [PubMed] [Google Scholar]
- 115.Zilversmit DB. Atherogenesis: a postprandial phenomenon. Circulation. 1979;60:473–485. doi: 10.1161/01.CIR.60.3.473. [DOI] [PubMed] [Google Scholar]
- 116.Ekelund U, Steene-Johannessen J, Brown WJ, Fagerland MW, Owen N, Powell KE, et al. Does physical activity attenuate, or even eliminate, the detrimental association of sitting time with mortality? A harmonised meta-analysis of data from more than 1 million men and women. Lancet. 2016;388:1302–1310. doi: 10.1016/S0140-6736(16)30370-1. [DOI] [PubMed] [Google Scholar]
- 117.Biswas A, Oh PI, Faulkner GE, Bajaj RR, Silver MA, Mitchell MS, et al. Sedentary time and its association with risk for disease incidence, mortality, and hospitalization in adults: a systematic review and meta-analysis. Ann Intern Med. 2015;162:123–132. doi: 10.7326/M14-1651. [DOI] [PubMed] [Google Scholar]
- 118.Stamatakis E, Pulsford RM, Brunner EJ, Britton AR, Bauman AE, Biddle SJ, et al. Sitting behaviour is not associated with incident diabetes over 13 years: the Whitehall II cohort study. Br J Sports Med. 2017;51:818–823. doi: 10.1136/bjsports-2016-096723. [DOI] [PubMed] [Google Scholar]
- 119.Åsvold BO, Midthjell K, Krokstad S, Rangul V, Bauman A. Prolonged sitting may increase diabetes risk in physically inactive individuals: an 11 year follow-up of the HUNT Study. Norway. Diabetologia. 2017;60:830–835. doi: 10.1007/s00125-016-4193-z. [DOI] [PubMed] [Google Scholar]
- 120.Petersen CB, Bauman A, Tolstrup JS. Total sitting time and the risk of incident diabetes in Danish adults (the DANHES cohort) over 5 years: a prospective study. Br J Sports Med. 2016;50:1382–1387. doi: 10.1136/bjsports-2015-095648. [DOI] [PubMed] [Google Scholar]
- 121.Cooper AR, Sebire S, Montgomery AA, Peters TJ, Sharp DJ, Jackson N, et al. Sedentary time, breaks in sedentary time and metabolic variables in people with newly diagnosed type 2 diabetes. Diabetologia. 2012;55:589–599. doi: 10.1007/s00125-011-2408-x. [DOI] [PubMed] [Google Scholar]
- 122.Jefferis BJ, Parsons TJ, Sartini C, Ash S, Lennon LT, Papacosta O, et al. Objectively measured physical activity, sedentary behaviour and all-cause mortality in older men: Does volume of activity matter more than pattern of accumulation? Br J Sports Med. 2018;53:1013–1020. doi: 10.1136/bjsports-2017-098733. [DOI] [PMC free article] [PubMed] [Google Scholar]
- 123.Diaz KM, Howard VJ, Hutto B, Colabianchi N, Vena JE, Safford MM, et al. Patterns of sedentary behavior and mortality in U.S. middle-aged and older adults: a national cohort study. Ann Intern Med. 2017;167:465–75. [DOI] [PMC free article] [PubMed]
- 124.Healy GN, Dunstan DW, Salmon J, Cerin E, Shaw JE, Zimmet PZ, et al. Breaks in sedentary time: beneficial associations with metabolic risk. Diabetes Care. 2008;31:661–666. doi: 10.2337/dc07-2046. [DOI] [PubMed] [Google Scholar]
- 125.Healy GN, Matthews CE, Dunstan DW, Winkler EAH, Owen N. Sedentary time and cardio-metabolic biomarkers in US adults: NHANES 2003-06. Eur Heart J. 2011;32:590–597. doi: 10.1093/eurheartj/ehq451. [DOI] [PMC free article] [PubMed] [Google Scholar]
- 126.van der Berg JD, Stehouwer CDA, Bosma H, van der Velde JHPM, Willems PJB, Savelberg HHCM, et al. Associations of total amount and patterns of sedentary behaviour with type 2 diabetes and the metabolic syndrome: the Maastricht Study. Diabetologia. 2016;59:709–718. doi: 10.1007/s00125-015-3861-8. [DOI] [PMC free article] [PubMed] [Google Scholar]
- 127.Bellettiere J, Winkler EAH, Chastin SFM, Kerr J, Owen N, Dunstan DW, et al. Associations of sitting accumulation patterns with cardio-metabolic risk biomarkers in Australian adults. PLoS ONE. 2017;12:e0180119. doi: 10.1371/journal.pone.0180119. [DOI] [PMC free article] [PubMed] [Google Scholar]
- 128.Start active, stay active: report on physical activity in the UK—GOV.UK. https://www.gov.uk/government/publications/start-active-stay-active-a-report-on-physical-activity-from-the-four-home-countries-chief-medical-officers#full-history. Accessed 21 Feb 2018.
- 129.Eating and activity guidelines for New Zealand adults. Ministry of Health NZ. https://www.health.govt.nz/publication/eating-and-activity-guidelines-new-zealand-adults. Accessed 21 Feb 2018.
- 130.Füzéki E, Vogt L, Banzer W. German national physical activity recommendations for adults and older adults: methods, database and rationale. Gesundheitswesen Bundesverb Arzte Offentlichen Gesundheitsdienstes Ger. 2017;79:S20–S28. doi: 10.1055/s-0042-123700. [DOI] [PubMed] [Google Scholar]
- 131.Colberg SR, Sigal RJ, Yardley JE, Riddell MC, Dunstan DW, Dempsey PC, et al. Physical activity/exercise and diabetes: a position statement of the American Diabetes Association. Diabetes Care. 2016;39:2065–2079. doi: 10.2337/dc16-1728. [DOI] [PMC free article] [PubMed] [Google Scholar]
- 132.Stamatakis E, Lee I-M, Bennie J, Freeston J, Hamer M, O’Donovan G, et al. Does strength-promoting exercise confer unique health benefits? A pooled analysis of data on 11 population cohorts with all-cause, cancer, and cardiovascular mortality endpoints. Am J Epidemiol. 2018;187:1102–1112. doi: 10.1093/aje/kwx345. [DOI] [PubMed] [Google Scholar]
- 133.Hagger-Johnson G, Gow AJ, Burley V, Greenwood D, Cade JE. Sitting time, fidgeting, and all-cause mortality in the UK Women’s Cohort Study. Am J Prev Med. 2016;50:154–160. doi: 10.1016/j.amepre.2015.06.025. [DOI] [PubMed] [Google Scholar]
- 134.Koepp GA, Moore GK, Levine JA. Chair-based fidgeting and energy expenditure. BMJ Open Sport Exerc Med. 2016;2:e000152. doi: 10.1136/bmjsem-2016-000152. [DOI] [PMC free article] [PubMed] [Google Scholar]
- 135.Koepp GA, Moore G, Levine JA. An under-the-table leg-movement apparatus and changes in energy expenditure. Front Physiol. 2017;8:318. doi: 10.3389/fphys.2017.00318. [DOI] [PMC free article] [PubMed] [Google Scholar]
- 136.Cassidy S, Thoma C, Houghton D, Trenell MI. High-intensity interval training: a review of its impact on glucose control and cardiometabolic health. Diabetologia. 2017;60:7–23. doi: 10.1007/s00125-016-4106-1. [DOI] [PMC free article] [PubMed] [Google Scholar]
- 137.García-Hermoso A, Cerrillo-Urbina AJ, Herrera-Valenzuela T, Cristi-Montero C, Saavedra JM, Martínez-Vizcaíno V. Is high-intensity interval training more effective on improving cardiometabolic risk and aerobic capacity than other forms of exercise in overweight and obese youth? A meta-analysis. Obes Rev. 2016;17:531–540. doi: 10.1111/obr.12395. [DOI] [PubMed] [Google Scholar]
- 138.Francois ME, Baldi JC, Manning PJ, Lucas SJE, Hawley JA, Williams MJA, et al. “Exercise snacks” before meals: a novel strategy to improve glycaemic control in individuals with insulin resistance. Diabetologia. 2014;57:1437–1445. doi: 10.1007/s00125-014-3244-6. [DOI] [PubMed] [Google Scholar]
- 139.De Cocker K, Veldeman C, De Bacquer D, Braeckman L, Owen N, Cardon G, et al. Acceptability and feasibility of potential intervention strategies for influencing sedentary time at work: focus group interviews in executives and employees. Int J Behav Nutr Phys Act. 2015;12:22. doi: 10.1186/s12966-015-0177-5. [DOI] [PMC free article] [PubMed] [Google Scholar]
- 140.Taylor WC, King KE, Shegog R, Paxton RJ, Evans-Hudnall GL, Rempel DM, et al. Booster Breaks in the workplace: participants’ perspectives on health-promoting work breaks. Health Educ Res. 2013;28:414–425. doi: 10.1093/her/cyt001. [DOI] [PMC free article] [PubMed] [Google Scholar]
- 141.Devries MC, Samjoo IA, Hamadeh MJ, McCready C, Raha S, Watt MJ, et al. Endurance training modulates intramyocellular lipid compartmentalization and morphology in skeletal muscle of lean and obese women. J Clin Endocrinol Metab. 2013;98:4852–4862. doi: 10.1210/jc.2013-2044. [DOI] [PubMed] [Google Scholar]
- 142.Habas ME, Macdonald IA. Metabolic and cardiovascular responses to liquid and solid test meals. Br J Nutr. 1998;79:241–247. doi: 10.1079/BJN19980041. [DOI] [PubMed] [Google Scholar]
- 143.Churchward-Venne TA, Burd NA, Mitchell CJ, West DWD, Philp A, Marcotte GR, et al. Supplementation of a suboptimal protein dose with leucine or essential amino acids: effects on myofibrillar protein synthesis at rest and following resistance exercise in men. J Physiol. 2012;590:2751–2765. doi: 10.1113/jphysiol.2012.228833. [DOI] [PMC free article] [PubMed] [Google Scholar]
- 144.Churchward-Venne TA, Cotie LM, MacDonald MJ, Mitchell CJ, Prior T, Baker SK, et al. Citrulline does not enhance blood flow, microvascular circulation, or myofibrillar protein synthesis in elderly men at rest or following exercise. Am J Physiol Endocrinol Metab. 2014;307:E71–E83. doi: 10.1152/ajpendo.00096.2014. [DOI] [PubMed] [Google Scholar]
- 145.Moberg M, Apró W, Ohlsson I, Pontén M, Villanueva A, Ekblom B, et al. Absence of leucine in an essential amino acid supplement reduces activation of mTORC1 signalling following resistance exercise in young females. Appl Physiol Nutr Metab. 2014;39:183–194. doi: 10.1139/apnm-2013-0244. [DOI] [PubMed] [Google Scholar]
- 146.Reitelseder S, Agergaard J, Doessing S, Helmark IC, Lund P, Kristensen NB, et al. Whey and casein labeled with L-[1-13C]leucine and muscle protein synthesis: effect of resistance exercise and protein ingestion. Am J Physiol Endocrinol Metab. 2011;300:E231–E242. doi: 10.1152/ajpendo.00513.2010. [DOI] [PubMed] [Google Scholar]
- 147.Frayn KN, Coppack SW, Humphreys SM, Clark ML, Evans RD. Periprandial regulation of lipid metabolism in insulin-treated diabetes mellitus. Metabolism. 1993;42:504–510. doi: 10.1016/0026-0495(93)90110-A. [DOI] [PubMed] [Google Scholar]
- 148.Palmer JP, Fleming GA, Greenbaum CJ, Herold KC, Jansa LD, Kolb H, et al. C-peptide is the appropriate outcome measure for type 1 diabetes clinical trials to preserve beta-cell function: report of an ADA workshop, 21-22 October 2001. Diabetes. 2004;53:250–264. doi: 10.2337/diabetes.53.1.250. [DOI] [PubMed] [Google Scholar]
- 149.Kruszynska YT, Home PD, Hanning I, Alberti KG. Basal and 24-h C-peptide and insulin secretion rate in normal man. Diabetologia. 1987;30:16–21. doi: 10.1007/BF01788901. [DOI] [PubMed] [Google Scholar]
- 150.Van Cauter E, Mestrez F, Sturis J, Polonsky KS. Estimation of insulin secretion rates from C-peptide levels. Comparison of individual and standard kinetic parameters for C-peptide clearance. Diabetes. 1992;41:368–77. [DOI] [PubMed]
- 151.Polonsky KS, Licinio-Paixao J, Given BD, Pugh W, Rue P, Galloway J, et al. Use of biosynthetic human C-peptide in the measurement of insulin secretion rates in normal volunteers and type I diabetic patients. J Clin Invest. 1986;77:98–105. doi: 10.1172/JCI112308. [DOI] [PMC free article] [PubMed] [Google Scholar]
- 152.Bergouignan A, Latouche C, Heywood S, Grace MS, Reddy-Luthmoodoo M, Natoli AK, et al. Frequent interruptions of sedentary time modulates contraction- and insulin-stimulated glucose uptake pathways in muscle: ancillary analysis from randomized clinical trials. Sci Rep. 2016;6:32044. doi: 10.1038/srep32044. [DOI] [PMC free article] [PubMed] [Google Scholar]
- 153.Newgard CB. Metabolomics and metabolic diseases: where do we stand? Cell Metab. 2017;25:43–56. doi: 10.1016/j.cmet.2016.09.018. [DOI] [PMC free article] [PubMed] [Google Scholar]
- 154.Grace MS, Dempsey PC, Sethi P, Mundra PA, Mellett NA, Weir JM, et al. Breaking up prolonged sitting alters the postprandial plasma lipidomic profile of adults with type 2 diabetes. J Clin Endocrinol Metab. 2017;102:1991–1999. doi: 10.1210/jc.2016-3926. [DOI] [PubMed] [Google Scholar]
- 155.Terrin N, Schmid CH, Lau J. In an empirical evaluation of the funnel plot, researchers could not visually identify publication bias. J Clin Epidemiol. 2005;58:894–901. doi: 10.1016/j.jclinepi.2005.01.006. [DOI] [PubMed] [Google Scholar]
- 156.Lau J, Ioannidis JPA, Terrin N, Schmid CH, Olkin I. The case of the misleading funnel plot. BMJ. 2006;333:597–600. doi: 10.1136/bmj.333.7568.597. [DOI] [PMC free article] [PubMed] [Google Scholar]
- 157.Vernikos J, Ludwig DA, Ertl AC, Wade CE, Keil L, O’Hara D. Effect of standing or walking on physiological changes induced by head down bed rest: implications for spaceflight. Aviat Space Environ Med. 1996;67:1069–1079. [PubMed] [Google Scholar]
- 158.Coenen P, Parry S, Willenberg L, Shi JW, Romero L, Blackwood DM, et al. Associations of prolonged standing with musculoskeletal symptoms-A systematic review of laboratory studies. Gait Posture. 2017;58:310–318. doi: 10.1016/j.gaitpost.2017.08.024. [DOI] [PubMed] [Google Scholar]
- 159.Waters TR, Dick RB. Evidence of health risks associated with prolonged standing at work and intervention effectiveness. Rehabil Nurs. 2015;40:148–165. doi: 10.1002/rnj.166. [DOI] [PMC free article] [PubMed] [Google Scholar]
- 160.Sardinha LB, Santos DA, Silva AM, Baptista F, Owen N. Breaking-up sedentary time is associated with physical function in older adults. J Gerontol A Biol Sci Med Sci. 2015;70:119–124. doi: 10.1093/gerona/glu193. [DOI] [PubMed] [Google Scholar]
Associated Data
This section collects any data citations, data availability statements, or supplementary materials included in this article.
Supplementary Materials
Forest plot together with risk of bias assessment for the effects of PA breaks vs no-exercise sitting on TAG, stratified by sex (TIFF 992 kb)
Forest plot for the effects of physical activity breaks vs sitting on insulin, stratified by sex (TIFF 1133 kb)
Forest plot for the effects of physical activity breaks vs continuous exercise on triacylglyerol, active vs inactive/unfit/T2D/IFG (TIFF 831 kb)
Forest plot for the effects of PA breaks vs continuous exercise on TAG, stratified by sex (TIFF 772 kb)
Forest plot for the effects of physical activity breaks vs continuous exercise on glucose, active vs inactive/unfit/T2D/IFG (TIFF 1053 kb)
Forest plot for the effects of physical activity breaks vs continuous exercise on insulin, active vs inactive/unfit/T2D/IFG (TIFF 906 kb)
Forest plot for the effects of PA breaks vs continuous exercise on insulin, stratified by sex (TIFF 759 kb)