

Abstract
Milk and dairy products can be exposed to potential dangers such as aflatoxin M1 (AFM1). Various factors affect the formation of aflatoxin, which can be due to environmental changes and the lack of suitable substrate for healthy livestock feeding. The goal of this study is to reduce the toxin in pasteurized milk to a level below the European Codex Alimentarius Commission standard. For this purpose, the proper structure of the radioactive granite stone was first designed as a low level gamma irradiation (LLGI) without contact with pasteurized milk, and and the pasteurized milk containing AFM1 that placed in this structure is measured and compared with the control sample values using Association of Official Analytical Chemists (AOAC) method. Then, the reduction of the resulting aflatoxin in the milk and the LLGI dose rate are obtained. The LLGI dose rate is calculated using the Monte Carlo N-Particle Transport Code (MCNP). For simulation, in addition to the spectrum of gamma radiation emitted by radioactive granites, weight percent of each composition of the pasteurized milk and its component elements are also calculated. The results showed a 51.5% reduction of aflatoxin in pasteurized milk after 4 days and 99% reduction after 8 days compared to the control sample. The LLGI dose rate in milk is 0.39 mGy per day. According to the international atomic energy agency (IAEA) report and pervious results, this dose rate level does not significantly affect chemical and sensory quality of milk, but can extend the shelf-life and provide a safer milk. Therefore, the structure constructed using radioactive granite in this study can be considered as one of the suitable methods for reducing aflatoxin.
Keywords: Aflatoxin M1, Milk, Radioactive granite, Gamma irradiation, MCNP code
Introduction
Dairy products such as milk are among the most popular foods around the world. Among the dairy products, cow’s milk is the most commonly used all over the world. Milk is a mixture of water, protein, fat, lactose, minerals, carbohydrate, and nitrate. The people’s health is very closely related to milk safety. Unfortunately, it is possible for this product to be contaminated with aflatoxin M1 (AFM1) which makes its consumption really dangerous. The aflatoxin level contained in milk and dairy products produced by developing countries exceeds 50 ng L−1, which is the maximum level of aflatoxin authorized by the European Communities (EC). Some of the most important reasons for this high level of aflatoxin can be the lack of regulation and monitoring of the quality of livestock feed and the wet and hot climates of these countries [1]. Due to severe dangers such as liver cancer for human health, caused by aflatoxin in milk and dairy products [2–4], many researchers have investigated the levels of aflatoxin in milk and dairy products in their countries.
Unusan [5] evaluates the level of aflatoxin in 129 commercially available pasteurized milk bottles in Turkey. The results showed that 47% of samples with an average of 108.17 ng L−1 exceeded the European standard in terms of being infiltrated into AFM1, and even four samples were beyond From the American standard. Also, Tekinşen et al. [6] collected 100 samples of milk produced in Kashar, Turkey, and examined the level of their aflatoxin. The results showed that 67% of the samples were infected with AFM1, 31% of which were reported to be between 10 and 630 ng kg−1 beyond the EC and the Turkish Food Codex (TFC). Sadia et al. [7] examined the level of aflatoxin in pasteurized milk in the Punjab province of Pakistan, which is the largest dairy producing province in Pakistan. Their results showed that 76.3% of the pasteurized millks were infected with aflatoxin, of which 75 samples out of 232 tested samples exceeded the codex standard (50 ng L−1). In India, Siddappa et al. [8] examined aflatoxin levels in 42 well-known pasteurized milk samples and found that 36% of the samples had an aflatoxin content greater than 50 ng L−1 (Codex Alimentarius limit). Nadira et al. [9] bought 53 different types of milk and dairy products in Malaysia and examined the levels of AFM1 in them. Their results showed that 35.8% of the samples were infected with aflatoxin, an average infectivity of 100 ng L−1 was reported. Xiong et al. [10] evaluated the aflatoxin in the milk products distributed in central China. Their results showed that 73.6% of the samples were infected with aflatoxin and the mean aflatoxin content of the samples was reported to be 100 ng L−1. In a large study, Rahmani et al. [11] reported the results of various studies by researchers on the concentration of aflatoxin in cow milk produced in the Middle East from 1995 to 2017. The report shows that 85% of raw milk produced in Palestine,76% in Iran, 67% in Lebanon, 38% in Egypt, 14% in Syria, and 12% in Turkey are contaminated with aflatoxin, also 77% of pasteurized milk produced in Iran contain aflatoxin.
There are also several reports for contamination of pasteurized milk and dairy products produced in Iran with aflatoxin [12–16]. Examining 111 samples of raw milk samples in Sarab city in Iran, Kamkar [17] found that 76.6% of these samples were contaminated with aflatoxin, which the contamination rate was reported between 15 and 280 ng L−1. Also, 40% of the samples had aflatoxin levels beyond the permissible codex standard (50 ng L−1). Alborzi et al. [18] examined 624 samples of pasteurized milk distributed in supermarkets in Shiraz, Iran, and found that 100% of the samples were contained AFM1. Of which 17.8% of these samples were above the European standard for aflatoxin toxicity. Tajkarimi et al. [19] examined the levels of aflatoxin in milk produced in 14 different centers in Iran. The measurements performed on 319 raw milk samples showed 54% contamination of them. Ghazani [20] evaluated 50 samples of pasteurized milk distributed in the city of Tabriz over a period of 6 months and evaluated the level of aflatoxin. Its findings showed that all samples were contaminated with aflatoxin, 62% of which exceeded from the EC limit. Heshmati & Milani [21] examined 210 milk samples purchased from supermarkets in Tehran, in which 70 samples contained aflatoxin levels beyond the standard codex. In another study, Bahrami et al. [1] examined 64 cow’s milk samples in Iran and found that 84.3% of these samples contained AFM1.
The reports highlight undesirable and alarming conditions of milk products in Middle Eastern countries, especially Iran. Therefore, it is highly recommended that the level of AFM1 in milk should be reduced to EC limit.
Various methods (chemical, physical and biological) have been used to detoxification of AFM1 in milk [22–24]. One of the physical methods has been ultraviolet irradiation in the recent years. The ultraviolet energy can be inactivate AFM1 in milk. It happens because aflatoxin is a photosensitive [25, 26]. Permitted food additives such as hydrogen peroxide, sulfites and bisulfites have been chemical ways that degrade AFM1 [27, 28]. Sorption and enzymatic degradation have been main Biological processes that degrade aflatoxin [29–31]. For control and elimination of aflatoxins, microorganisms has been an effective [32]. For example Lactic acid bacteria and bifidobacteria are of particular interest for reducing the bioavailability of aflatoxins [33, 34].
Economic and logistic considerations limit the use of conventional techniques to detoxification of aflatoxin. These methods because of the need for special facilities, loss of important nutrients, high costs have not been used on a commercial scale. In this paper a new method based on application of low level gamma irradiation (LLGI) by radioactive granite (RG) for reduction of AFM1 in pasteurized milk is introduced. In this method, due to the high half-life of RG, the LLGI source has been radiating for many years and does not need to be replaced. Unlike other methods, this method does not require the provision of specific chemicals and equipment and can be easily utilized by following the principles of health physics and the use of trained personnel. The previous results of other researchers show that the LLGI is not trouble affected the food and dairy component and suggest that irradiation of milk and their products (M&P) does not significantly affect the chemical and sensory quality of them, but can extend the shelf-life and provide a safer M&P [35–40]. The obtained results indicate that the gamma doses range 0.5–8 kGy in almonds, the content of alpha-tocopherol is gradually decreased from 86.7% to 12.6% respectively and no significant change is observed in fatty acid composition [41]. Therefore, low gamma irradiation can be regarded as an appropriate way to prevent form the formation of –tocpherol which is the main vitamin-E active compound, and the amount of fatty acids in almonds simultaneously [41]. The other results indicate that LLGI don’t produce any toxin in M&P and food [39, 40, 42]. Therefore the toxin level in irradiated food is not increased due to radiation effects [43].
Granite usually is a natural source of radiation. The granite radioactive elements emit gamma rays that can be affected the AFM1 in milk since gamma dose remain in it. The activity of some granites are higher than others. The 40K, 232Th, and 238U are the radioactive elements in granite that 40K activity is almost ten order larger than others [44]. 232Th can be produce 222Rn with the same of 232Th activity (almost 0.1 total granite activity). For no concerns in reduction of AFM1 by granite, the radon elimination is an important matter. Therefore for personal health, the radon gas must be eliminated from the active volume. This elimination can be down by radon filter [45].
The RG gamma dose in milk and components are a suitable parameter to examine the changing of the AFM1 level in milk. The Monte Carlo N-Particle Transport Code (MCNP) was used for calculation of the RG gamma dose. This code is presented in various versions based on Monte Carlo method and FORTRAN’s language, and is one of the most powerful software available for nuclear calculations with high accuracy. The user must introduce the input text file containing the problem information to the code and receive the output text file with the simulation process by the MCNP code. The input file contains the important parts of the cell card, surface card, and data card. The definition of each card is one of the requirements of the input file [46].
For MCNP simulation, the RG spectrum was needed that measured by experimental method. The Association of Official Analytical Chemists (AOAC) method [47] was used for determination of the AFM1 level in milk before and after RG irradiation. This details are given in next sections.
Material and methods
Simulation: Description of the MCNP input file
Monte Carlo simulation is usually used for dose calculation by written an input file. This file contains various parts such as Data, Surface, and Cell cards which they descript at the below.
Source definition
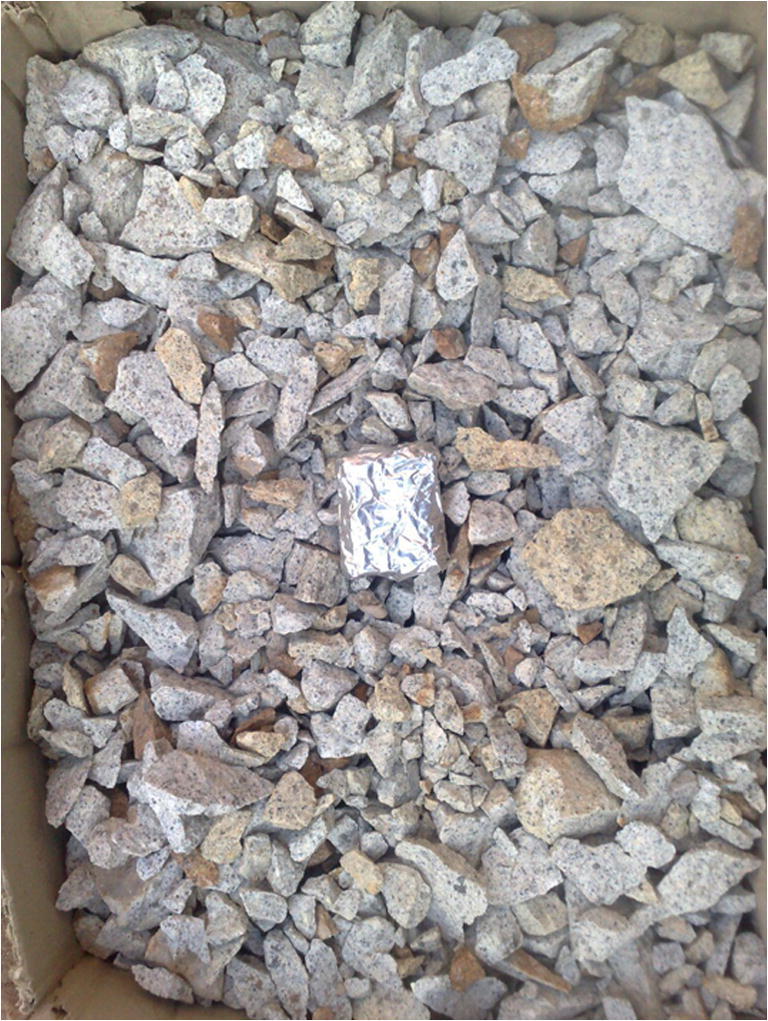
The RG samples were collected from the Mount Gabry (30.37 N, 56.41 E) in Kerman province. The samples were broken in small pieces (Fig. 1). The RG special activity and pulse height spectrum of the RG gamma radiation were measured with the NaI (Tl) spectrometer. After normalization of the pulse height spectrum, the gamma spectrum of RG was calculated (Fig. 2). The measured gamma spectrum was used as source in MCNP input file.
Fig. 1.

The RG samples: a before, b after broken
Fig. 2.

Gamma-ray spectrum obtained with NaI (Tl) detector, from the Gabry Mountain in Kerman province of Iran
Geometry
To calculate the best geometry for the RG around the milk packet, two shapes (rectangular and cylindrical) with fixed mass were considered (Fig. 3).
Fig. 3.

Geometries containing a rectangular hole in center that simulated by MCNP
Symbols of this dimensions are as follows:
For rectangular a (width) × b (length) × c (height), for cylinder r (radius) × h (height).
The geometries containing a rectangular hole in center with 4.44 (width) × 5.44(length) × 10.44(height) cm3 that are the milk packet dimensions with the 206.1 cm3 volume and assume to make with 2 mm paper sheet, 0.1 mm aluminum sheet and 0.1 mm plastic rectangular.
Material definition
Milk is a combination of water, fat, lactose, proteins, carbohydrates, nitrates, and minerals. The weight percent of each milk compositions and its chemical formula were evaluated by the researchers [48–55].
To define the milk in the MCNP code, the weight percent and the elements of each of the milk producing constituents are defined by ZAID. For photon sources, ZAID represents the atomic number of each element multiplied by 1000 [56]. Accordingly, ZAID and the weight percent of milk compositions containing 62.94 ng L−1 of aflatoxin were calculated and applied to the MCNP code input card (Tables 1 and 2).
Table 1.
The elements weight percent of the milk and constituent
| Constituent | O | H | C | P | Co | N | S | CL |
|---|---|---|---|---|---|---|---|---|
| ZAID | 8000 | 1000 | 6000 | 15,000 | 27,000 | 7000 | 16,000 | 17,000 |
| Vitamins | 4.56E-05 | 3.05E-05 | 0.000252 | 1E-08 | 1.91E-08 | 7.11E-05 | 2.33E-05 | 2.5816E-05 |
| Amino Acids | 0.980369 | 0.224883 | 1.422436 | – | – | 0.371532 | 0.020564 | – |
| Fatty Acid | 0.469102 | 0.425536 | 2.59173 | 0.00011 | – | – | – | – |
| Water | 78.07773 | 9.837544 | – | – | – | – | – | – |
| Carbohydrates | 2.692672 | 0.339269 | 2.205142 | – | – | – | – | – |
| Nitrates | 0.000478 | – | – | – | – | 0.000139 | – | – |
| Aflatoxin | 2.08E-09 | 2.24E-10 | 3.79E-09 | – | – | – | – | – |
Table 2.
Weight percent of mineral ingredients in milk
| Minerals | ZAID | Wt% | Elements | ZAID | Wt% | Elements | ZAID | Wt% |
|---|---|---|---|---|---|---|---|---|
| Elements | ||||||||
| Cr | 24,000 | 2.79E-06 | Si | 14,000 | 4.38E-05 | Na | 11,000 | 0.042813 |
| Cu | 29,000 | 1.3E-05 | Sb | 51,000 | 9.96E-06 | K | 19,000 | 0.142377 |
| Fe | 26,000 | 5.7E-05 | Sn | 50,000 | 1.99E-07 | Mg | 12,000 | 0.009956 |
| Zn | 30,000 | 0.000282 | Ti | 22,000 | 3.98E-06 | Ca | 20,000 | 0.112508 |
| Al | 13,000 | 4.58E-05 | Pb | 82,000 | 7.97E-06 | I | 53,000 | 3.98E-06 |
| B | 5000 | 5.97E-05 | Cd | 48,000 | 1.39E-05 | Se | 34,000 | 1.49E-06 |
| Mn | 25,000 | 4.68E-06 | Mo | 42,000 | 4.18E-06 | F | 9000 | 1.49E-05 |
| Ni | 28,000 | 3.98E-07 | Br | 35,000 | 0.000229 | p | 15,000 | 0.031861 |
| Co | 27,000 | 9.96E-08 |
Calculation of the RG gamma dose in milk and constituent
Alpha and beta particles emitted from RG activity can be stopped by aluminum sheet, so they can’t pass through the milk packet and gamma rays appear in all over the milk and remain some energy when passing through it. Aftatoxins produce by microorganisms of the Aspergillus Flavus group [57]. Previous Result was show that the gamma dose can be affect the microorganism in milk and food [58–63] and don’t effect the milk component [35–38].
The tally *F8 in MCNP code was used to calculate the RG energy deposition in milk and constituent versus mega electron volt (MeV = 1.6 × 10⁻¹³ J). In tally *F8, the energy deposition was calculated for one photon. For convert the energy deposition vs J (E) to gamma dose vs Gy (D) by all photons that emits by RG, it must be multiply to activity of RG vs Bq (A), irradiation time vs day (t) and divided by milk or constituent mass vs Kg (m) (Eq. (1)).
| 1 |
The activity of RG is A = a × M that (a) is specific activity of RG (Bq kg−1) that was calculated by NaI (Tl) as 1750 (Bq kg−1) and M is the RG mass vs Kg.
Also, the tally F6 was used to calculate kerma (K). In this research, kerma is the energy transmitted from the spectrum of photons emitted from RG to the initial Charged particles formed in milk mass units and its constituent compounds, while the absorbed dose is the amount of energy remaining per unit mass of milk and its constituents. The tally F6 output unit used to calculate kerma is mega-electron volts per gram (MeV g−1 = 1.6 × 10⁻¹⁰ Gy) for one particle from the source decay. The total kerema (KT) obtained from all particles emitted from RG with activity A at the time irradiation t is obtained according to eq. (2).
| 2 |
Experimental
Milk samples and irradiation
12 pasteurized milk samples produced by Pegah Kerman Milk Factory (Pegah Products Co., Kerman, Iran) provided. The samples were divided into three groups. The first group consists of 6 milk samples as the control group. For measuring the initial amount of AFM1, the first group (as control group) contain six milk samples (each 200 cc) were sent to the laboratory. According to the result (section 4), the rectangular box was chosen as the suitable geometry for experimental step. Afterwards for measuring the variation of the AFM1 level in milk by the LLGI of RG, the two and three groups (each group contain 3 milk bags) were placed in the center of a suitable geometry for 4 and 8 days respectively (Fig. 4). The milk bags were chosen randomly from a Dairy Milk industry (Pegah Products Co., Kerman, Iran). The milk bags was separated from the RG box by a thin aluminum sheet.
Fig. 4.
Milk irradiation process by RG box
Measurement of AFM1 level by AOAC method
There are many methods for measuring of AFM1 in milk and milk products [64, 65]. In this work, the AOAC method was used for determination of AFM1 in the milk test samples. In the current work, a HPLC system (Agilent 1100 series, USA), accompanied with an auto sampler LAS G1313A and a fluorescence detector FLD G1321A with excitation and emission wavelength of 360 and 450 nm was implemented to determine AFM1. Acetonitrile in ratio of 25% with 75% water was used as mobile phase. The flow rate is 0.8 mL min-1. The retention time for AFM1 was in the range of 6.1–6.5 min. Measuring AFM1 was carried out applying a calibration curve. A set of standard solutions for AFM1 in acetonitrile were used to obtain calibration curve.
Before determination of AFM1 in milk, milk samples were first centrifuged at 2000 g.min at controlled temperature of 43.7 °C to separate the fat layer. Then, 50 mL of fat free centrifuged milk was transferred into syringe barrel and was passed through the immonoaffinity column (IAC) at flow rate of 2 mL min−1. The column was washed with 20 mL distilled water and then it was blown to dryness and afterwards AFM1 was eluted with 4 mL pure acetonitrile by allowing it to be in contact with the column at least for 60 s. The elution solution was heated to dryness using gentle stream of N2 gas flow.
Results and discussion
The results obtained through numerical and experimental steps. At the simulation step, the energy and dose in milk and constituent were calculated using MCNP code. Before this calculation, the suitable geometry for RG bed was chosen. To this aim, energy deposition was investigated through rectangular and cylindrical geometries in milk. This operation was repeated in eight structures geometries for rectangular with dimension ranging from 9.44 × 10.44 × 15.44 (cm3) to 44.44 × 45.44 × 50.44 (cm3) and cylindrical geometries with dimension ranging from 5.22 × 15.44 (cm2) to 22.72 × 50.44 (cm2). Each geometry define by 5 cm step length increasing in dimension from first to end. According to the Fig. 5, the results shown that energy deposition there was a negligible change in radius larger than 25 cm.
Fig. 5.

RG Geometry optimization by different dimension with 5 to 40 (cm) variation thickness
Therefore, with above 25 cm shielding thickness, the optimized dimension of rectangular and cylinder ((a (width) × b (length) × c (height)) for rectangular and (r (radius) × h (height)) for cylinder) were as 29.44 × 30.44 × 35.44 (cm3) and 17.94 × 35.44 (cm2) respectively. The mass of RG in above rectangular and cylindrical geometry are about 85.1 (kg) and 97.9 (kg) respectively. For this calculation the RG density was calculated 2.75 g cm−3. The ratio of energy with rectangular and cylinder RG geometry in Milk were calculated by Monte Carlo simulation as 0.91 were near one. Therefore because of the rectangular geometry had a less than dissipation in storage from cylinder geometry, the suitable geometry for simulation and experimental investigations was chosen to be rectangular shape.
Therefore a rectangular geometry was defined in input file with dimensions of 29.44 × 30.44 × 35.44 (cm3) containing a hole with dimensions of 4.44 × 5.44 × 10.44 (cm3) in order to put the milk packet (Fig. 6).
Fig. 6.

A simple diagram of RG box contain a rectangular hole for placing milk packet sample
Before gamma irradiation the mean level of AFM1 in test sample was measured by AOAC method as 62.94 (ng L−1). In simulation step, the milk sample and constituent were exposed to LLGI from the RG source. The purpose of this study is to compare the received dose in each compounds. The amounts of kerama and the remained dose for one particle in milk and its compounds (nitrate, minerals, carbohydrates, vitamins, fat, proteins, and water) were calculated using the MCNP code with precision of two decimal places (Table 3).
Table 3.
The remained dose and kerma in milk and its compositions per particle from a RG
| MCNP tally | F6(p) | F6(e) | *F8(p)/m | *F8(e)/m | Free radicals |
|---|---|---|---|---|---|
| Dimension | Mev g−1 | Mev g−1 | Mev g−1 | Mev g−1 | # |
| Milk | 9.43E-05 | 9.46E-05 | 9.45E-05 | 9.45E-05 | 163,796 |
| Vitamins | 9.72E-05 | 1.30E-04 | 1.30E-04 | 1.30E-04 | 175 |
| Amino Acids | 9.74E-05 | 1.02E-04 | 1.02E-04 | 1.02E-04 | 5456 |
| Fatty Acid | 1.01E-04 | 1.12E-04 | 1.12E-04 | 1.12E-04 | 6708 |
| Water | 9.52E-05 | 9.54E-05 | 9.54E-05 | 9.54E-05 | 145,306 |
| Carbohydrates | 9.64E-05 | 1.03E-04 | 1.03E-04 | 1.03E-04 | 9346 |
| Nitrates | 9.10E-05 | 1.23E-04 | 1.23E-04 | 1.23E-04 | 176 |
| Aflatoxin | 9.41E-05 | 9.78E-05 | 1.13E-04 | 1.13E-04 | 173 |
| Minerals | 9.67E-05 | 7.49E-05 | 7.49E-05 | 7.49E-05 | 726 |
With MCNP result and using Eq. 1 and 2, the gamma dose (D) and Kerma (KT) remaining in “Milk with AFM1” were calculated for all particle decay from RG after 4 and 8 days (Table 4). The percentage error in all calculate were less than 0.01%.
Table 4.
The gamma dose in “Milk with AFM1” after 4 and 8 days by RG irradiation
| Milkwith AFM1 (62.94 ng L−1) | D(mGy) (t = 4 days) | D(mGy) (t = 8 days) | KT(mGy) (t = 4 days) | KT(mGy) (t = 8 days) |
|---|---|---|---|---|
| Photon | 0.777 | 1.555 | 0.776 | 1.552 |
| Electron | 0.777 | 1.555 | 0.779 | 1.558 |
| Total | 1.555 | 3.111 | 1.555 | 3.110 |
In order to check the uniformity of the received dose, using the meshing technique in the MCNP code, the internal volume of the milk pack by 100 × 100 × 100 mesh was divided by its length, width and height, and the remaining energy in each mesh was drawn as a three-dimensional image (Fig. 7).
Fig. 7.

The results obtained from the mesh tally a) the milk pasteurized before the radiation b) the remained energy in the milk after the radiation
The remaining energy index is a color change. To evaluate the uniformity of each mesh, PEDEP and DOSE commands can be used to calculate remaining energy and dose.
In experimental step, 6 milk samples in second and third groups (every group contain 3 samples) were put in center of RG box. The AFM1 level in second group after 4 days and third groups after 8 days were measured as 30.51 and 0.70 ng L−1, respectively. As a result, the AFM1 level in milk samples due to LLGI of RG after 4 and 8 days were reduced about (51.5–99.0)% relative to its level in test sample. According to result, the means of AFM1 reduction rate due to 0.39 mGy dose per day in milk (by LLGI of RG) was reported as 7.95 ng L−1 per day. The means of AFM1 reduction per unique dose due to LLGI of RG was 20.38 ng L−1/mGy. The storage time for AFM1 reduction until codex standard level was depended on its level in milk samples.
Review aflatoxin reduction by gamma and ultraviolet irradiation in food productions
Food irradiation by Gamma ray, in recent years, is internationally recognized as an effective processing technique for disinfect in food and feed. The changes created through irradiated foods are totally accepted with regard to their appearance and nutritional effects [66]. World health organization (WHO), Food and Agriculture Organization (FAO) and International Atomic Energy Agency (IAEA) have recommended that irradiation is a suitable physical process for treating food and food products [66]. Ihsanullah & Rashid [67] reported that 50 countries have adopted food irradiation for over 60 foods and feeds.
Gamma radiation can greatly reduce the biological activity of aflatoxins. In food, such as milk that a high percentage of its components is water, there is a more suitable substrate for aflatoxin degradation. Because radiolysis of water leads to the formation of free radicals [68].
One of the physical methods for degradation of AFM1 has been ultraviolet irradiation. The ultraviolet energy can be inactivate AFM1 in milk when environmental conditions are appropriate. It happens because aflatoxin is a photosensitive [25].
There are different reports in the effect of gamma ray and ultraviolet irradiation on aflatoxin in diverse foods. A list of some of the recent studies using gamma and ultraviolet radiations are summarized in Table 5.
Table 5.
Some recent studies on the aflatoxin reduction in diverse foods by gamma dose irradiation and ultraviolet exposure
| Samples type | Absorbed dose or Time of ultraviolet exposure | Percentage of reduction | Reference |
|---|---|---|---|
| Peanut | 1 kGy | 75% AFB1 | [69] |
| Date | 3.5 KGy | 100% AFB1 | [70] |
| Plum | 3.5 KGy | >80% AFB1 | [70] |
| Brazil nut | 5 kGy | 70.6% AFB1 | [71] |
| Red chili | 6 KGy | >80% AFB1 | [72] |
| Wheat | 8 kGy | 69.3% AFB1 | [73] |
| Rice | 8 kGy | 64.7% AFB1 | [74] |
| Corn | 8 kGy | 60.3% AFB1 | [73] |
| Corn | 10 kGy | 100% AFB1 & AFB2 | [75] |
| Rice | 10 kGy | 87.8% AFB1 | [74] |
| Unpeeled pistachio | 10 kGy | 84.6% AFB1 | [74] |
| Peeled pistachio | 10 kGy | 68.8% AFB1 | [74] |
| Milk | 2 to 60 min | 3.6 to 100% AFM1 | [76] |
| Raw or Heated Milk | 30 min | 56.2% AFM1 | [25] |
| Pasteurized Canned | 15 & 30 min | 65 to 100% | [77] |
| Milk |
AFB1: Aflatoxin B1; AFB2: Aflatoxin B2; AFM1: Aflatoxin M1
Conclusion
The present study is a research effort to develop a suitable method for the further removal of AFM1 in pasteurized milk. The biggest concern for the presence of aflatoxin in pasteurized milk and dairy products refers to the countries in the Middle East region with a focus on Iran. The basis of this method is to place milk packs in a hole that is embedded in the center of a rectangular cube made of RG stones. Therefore, 12 samples of pasteurized milk were prepared simultaneously from the Pegah factory in Kerman, Iran for field studies. The average amount of aflatoxin was measured as 62.94 ng L-1 using the AOAC method in the six samples as the control group. The other six samples were classified as two triplex classes under 4 and 8-day irradiation with optimized RG bed. The mean rate of aflatoxin in each group is reduced by 55.1% and 99% after 4 and 8 days, respectively. The MCNP result show that the gamma dose in milk and its compounds by RG bed is 0.39 mGy per day. The gamma dose in 4 and 8 days will be 1.56 and 3.11 mGy that is in order of low level gamma irradiation. According to the above reports, an appropriate perspective on the application of the plan and the necessary framework for industrialization of the plan is drawn up.
Acknowledgements
The authors would like to sincerely thank Mr. Majid Hassanpour for kind help and support received during the course of this work. Also the authors would like to express their sincere appreciation to Mr. Mohammad Hassanpour and Mrs. Mehri Sabour, for financial support.
Compliance with ethical standards
Conflict of interest
The authors declare that they have no conflict of interest.
Footnotes
Publisher’s note
Springer Nature remains neutral with regard to jurisdictional claims in published maps and institutional affiliations.
References
- 1.Bahrami R, Shahbazi Y, Nikousefat Z. Aflatoxin M1 in milk and traditional dairy products from west part of Iran: occurrence and seasonal variation with an emphasis on risk assessment of human exposure. Food Control. 2016;62:250–256. doi: 10.1016/j.foodcont.2015.10.039. [DOI] [Google Scholar]
- 2.Prandini A, Tansini GI, Sigolo S, Filippi LA, Laporta M, Piva GI. On the occurrence of aflatoxin M1 in milk and dairy products. Food Chem Toxicol. 2009;47(5):984–991. doi: 10.1016/j.fct.2007.10.005. [DOI] [PubMed] [Google Scholar]
- 3.Galvano F, Galofaro V, Galvano G. Occurrence and stability of aflatoxin M1 in milk and milk products: a worldwide review. J Food Prot. 1996;59(10):1079–1090. doi: 10.4315/0362-028X-59.10.1079. [DOI] [PubMed] [Google Scholar]
- 4.Giovati L, Magliani W, Ciociola T, Santinoli C, Conti S, Polonelli L. AFM1 in milk: physical, biological, and prophylactic methods to mitigate contamination. Toxins. 2015;23(10):4330–4349. doi: 10.3390/toxins7104330. [DOI] [PMC free article] [PubMed] [Google Scholar]
- 5.Unusan N. Occurrence of aflatoxin M1 in UHT milk in Turkey. Food Chem Toxicol. 2006;44(11):1897–1900. doi: 10.1016/j.fct.2006.06.010. [DOI] [PubMed] [Google Scholar]
- 6.Tekinşen KK, Eken HS. Aflatoxin M1 levels in UHT milk and kashar cheese consumed in Turkey. Food Chem Toxicol. 2008;46(10):3287–3289. doi: 10.1016/j.fct.2008.07.014. [DOI] [PubMed] [Google Scholar]
- 7.Sadia A, Jabbar MA, Deng Y, Hussain EA, Riffat S, Naveed S, Arif M. A survey of aflatoxin M1 in milk and sweets of Punjab, Pakistan. Food Control. 2012;26(2):235–240. doi: 10.1016/j.foodcont.2012.01.055. [DOI] [Google Scholar]
- 8.Siddappa V, Nanjegowda DK, Viswanath P. Occurrence of aflatoxin M1 in some samples of UHT, raw & pasteurized milk from Indian states of Karnataka and Tamilnadu. Food Chem Toxicol. 2012;50(11):4158–4162. doi: 10.1016/j.fct.2012.08.034. [DOI] [PubMed] [Google Scholar]
- 9.Nadira AF, Rosita J, Norhaizan ME, Redzwan SM. Screening of aflatoxin M1 occurrence in selected milk and dairy products in Terengganu, Malaysia. Food Control. 2017;73:209–214. doi: 10.1016/j.foodcont.2016.08.004. [DOI] [Google Scholar]
- 10.Xiong J, Xiong L, Zhou H, Liu Y, Wu L. Occurrence of aflatoxin B1 in dairy cow feedstuff and aflatoxin M1 in UHT and pasteurized milk in Central China. Food Control. 2018;92:386–390. doi: 10.1016/j.foodcont.2018.05.022. [DOI] [Google Scholar]
- 11.Rahmani J, Alipour S, Miri A, Fakhri Y, Riahi SM, Keramati H, Moradi M, Amanidaz N, Pouya RH, Bahmani Z, Khaneghah AM. The prevalence of aflatoxin M1 in milk of Middle East region: a systematic review, meta-analysis and probabilistic health risk assessment. Food Chem Toxicol. 2018;118:653–666. doi: 10.1016/j.fct.2018.06.016. [DOI] [PubMed] [Google Scholar]
- 12.Oveisi MR, Jannat B, Sadeghi N, Hajimahmoodi M, Nikzad A. Presence of aflatoxin M1 in milk and infant milk products in Tehran, Iran. Food Control. 2007;18(10):1216–1218. doi: 10.1016/j.foodcont.2006.07.021. [DOI] [Google Scholar]
- 13.Tajkarimi M, Aliabadi FS, Nejad MS, Pursoltani H, Motallebi AA, Mahdavi H. Seasonal study of aflatoxin M1 contamination in milk in five regions in Iran. Int J Food Microbiol. 2007;116(3):346–349. doi: 10.1016/j.ijfoodmicro.2007.02.008. [DOI] [PubMed] [Google Scholar]
- 14.Fallah AA, Jafari T, Fallah A, Rahnama M. Determination of aflatoxin M1 levels in Iranian white and cream cheese. Food Chem Toxicol. 2009;47(8):1872–1875. doi: 10.1016/j.fct.2009.04.042. [DOI] [PubMed] [Google Scholar]
- 15.Kamkar A. The study of aflatoxin M 1 in UHT milk samples by ELISA. Iranian Journal of Veterinary Medicine. 2008;2(1):7–12. [Google Scholar]
- 16.Shahbazi Y, Nikousefat Z, Karami N. Occurrence, seasonal variation and risk assessment of exposure to aflatoxin M1 in Iranian traditional cheeses. Food Control. 2017;79:356–362. doi: 10.1016/j.foodcont.2017.04.021. [DOI] [Google Scholar]
- 17.Kamkar A. A study on the occurrence of aflatoxin M1 in raw milk produced in Sarab city of Iran. Food Control. 2005;16(7):593–599. doi: 10.1016/j.foodcont.2004.06.021. [DOI] [Google Scholar]
- 18.Alborzi S, Rashidi M, Astaneh B. Aflatoxin M1 contamination in pasteurized milk in shiraz (south of Iran) Food Control. 2006;17(7):582–584. doi: 10.1016/j.foodcont.2005.03.009. [DOI] [Google Scholar]
- 19.Tajkarimi M, Aliabadi-Sh F, Nejad AS, Poursoltani H, Motallebi AA, Mahdavi H. Aflatoxin M1 contamination in winter and summer milk in 14 states in Iran. Food Control. 2008;19(11):1033–1036. doi: 10.1016/j.foodcont.2007.10.011. [DOI] [Google Scholar]
- 20.Ghazani MH. Aflatoxin M1 contamination in pasteurized milk in Tabriz (northwest of Iran) Food Chem Toxicol. 2009;47(7):1624–1625. doi: 10.1016/j.fct.2009.04.011. [DOI] [PubMed] [Google Scholar]
- 21.Heshmati A, Milani JM. Contamination of UHT milk by aflatoxin M1 in Iran. Food Control. 2010;21(1):19–22. doi: 10.1016/j.foodcont.2009.03.013. [DOI] [Google Scholar]
- 22.Samarajeewa U, Sen AC, Cohen MD, Wei CI. Detoxification of aflatoxins in foods and feeds by physical and chemical methods. J Food Prot. 1990;53(6):489–501. doi: 10.4315/0362-028X-53.6.489. [DOI] [PubMed] [Google Scholar]
- 23.Piva G, Galvano F, Pietri A, Piva A. Detoxification methods of aflatoxins. Zootecnica International. 2000;23(7/8):48–53. [Google Scholar]
- 24.Wu Q, Jezkova A, Yuan Z, Pavlikova L, Dohnal V, Kuca K. Biological degradation of aflatoxins. Drug Metab Rev. 2009;41(1):1–7. doi: 10.1080/03602530802563850. [DOI] [PubMed] [Google Scholar]
- 25.Yousef AE, Marth EH. Use of ultraviolet energy to degrade aflatoxin M1 in raw or heated milk with and without added peroxide. J Dairy Sci. 1986;69(9):2243–2247. doi: 10.3168/jds.S0022-0302(86)80663-4. [DOI] [PubMed] [Google Scholar]
- 26.Liu R, Jin Q, Tao G, Shan L, Huang J, Liu Y, Wang X, Mao W, Wang S. Photodegradation kinetics and byproducts identification of the aflatoxin B1 in aqueous medium by ultra-performance liquid chromatography–quadrupole time-of-flight mass spectrometry. J Mass Spectrom. 2010;45(5):553–559. doi: 10.1002/jms.1741. [DOI] [PubMed] [Google Scholar]
- 27.Applebaum RS, Marth EH. Use of sulphite or bentonite to eliminate aflatoxin M 1 from naturally contaminated raw whole milk. Z Lebensm Unters Forsch. 1982;174(4):303–305. doi: 10.1007/BF01042964. [DOI] [Google Scholar]
- 28.APPLEBAUM RS, MARTH EH. Inactivation of aflatoxin M1 in milk using hydrogen peroxide and hydrogen peroxide plus riboflavin or lactoperoxidase. J Food Prot. 1982;45(6):557–560. doi: 10.4315/0362-028X-45.6.557. [DOI] [PubMed] [Google Scholar]
- 29.Halasz A, Lasztity R, Abonyi T, Bata A. Decontamination of mycotoxin-containing food and feed by biodegradation. Food Reviews International. 2009;25(4):284–298. doi: 10.1080/87559120903155750. [DOI] [Google Scholar]
- 30.Yin YN, Yan LY, Jiang JH, Ma ZH. Biological control of aflatoxin contamination of crops. J Zhejiang Univ Sci B. 2008;9(10):787–792. doi: 10.1631/jzus.B0860003. [DOI] [PMC free article] [PubMed] [Google Scholar]
- 31.Mishra HN, Das C. A review on biological control and metabolism of aflatoxin. [DOI] [PubMed]
- 32.Alberts JF, Gelderblom WC, Botha A, Van Zyl WH. Degradation of aflatoxin B1 by fungal laccase enzymes. Int J Food Microbiol. 2009;135(1):47–52. doi: 10.1016/j.ijfoodmicro.2009.07.022. [DOI] [PubMed] [Google Scholar]
- 33.Bovo F, Corassin CH, Rosim RE, de Oliveira CA. Efficiency of lactic acid bacteria strains for decontamination of aflatoxin M 1 in phosphate buffer saline solution and in skimmed milk. Food Bioprocess Technol. 2013;6(8):2230–2234. doi: 10.1007/s11947-011-0770-9. [DOI] [Google Scholar]
- 34.Bolognani F, Rumney CJ, Rowland IR. Influence of carcinogen binding by lactic acid-producing bacteria on tissue distribution and in vivo mutagenicity of dietary carcinogens. Food Chem Toxicol. 1997;35(6):535–545. doi: 10.1016/S0278-6915(97)00029-X. [DOI] [PubMed] [Google Scholar]
- 35.de Oliveira Silva AC, De Oliveira LA, De Jesus EF, Cortez MA, Alves CC, Monteiro ML, Conte Junior CA. Effect of gamma irradiation on the bacteriological and sensory analysis of raw whole milk under refrigeration. Journal of food processing and preservation. 2015;39(6):2404–2411. doi: 10.1111/jfpp.12490. [DOI] [Google Scholar]
- 36.Rady AH, Badr HM. Keeping the quality of cows’ butter by γ-irradiation. Grasas Aceites. 2003;54(4):410–418. doi: 10.3989/gya.2003.v54.i4.229. [DOI] [Google Scholar]
- 37.Ham JS, Jeong SG, Lee SG, Han GS, Jang A, Yoo YM, Chae HS, Kim DH, Kim HJ, Lee WK, Jo C. Quality of irradiated plain yogurt during storage at different temperatures. Asian Australas J Anim Sci. 2009;22(2):289–295. doi: 10.5713/ajas.2009.80329. [DOI] [Google Scholar]
- 38.Harding F. Milk quality. London: Blackie Academic & Professional; 1995. [Google Scholar]
- 39.Behere AG, Sharma A, Padwaldesai SR, Nadkarni GB. Production of aflatoxins during storage of gamma-irradiated wheat [Humidity, Aspergillus flavus, Fungi]. Journal of Food Science (USA). 1978.
- 40.Roberts T. Cold pasteurization of food by irradiation. Virginia Polytechnic Institute and State University; 1999.
- 41.Di Stefano V, Pitonzo R, Bartolotta A, D'Oca MC, Fuochi P. Effects of γ-irradiation on the α-tocopherol and fatty acids content of raw unpeeled almond kernels (Prunus dulcis) LWT-Food Science and Technology. 2014;59(1):572–576. doi: 10.1016/j.lwt.2014.04.055. [DOI] [Google Scholar]
- 42.Grant IR, Nixon CR, Patterson MF. Effect of low-dose irradiation on growth of and toxin production by Staphylococcus aureus and Bacillus cereus in roast beef and gravy. Int J Food Microbiol. 1993;18(1):25–36. doi: 10.1016/0168-1605(93)90004-Z. [DOI] [PubMed] [Google Scholar]
- 43.Farkas J. Microbiological safety of irradiated foods. Int J Food Microbiol. 1989;9(1):1–5. doi: 10.1016/0168-1605(89)90032-9. [DOI] [PubMed] [Google Scholar]
- 44.Pavlidou S, Koroneos A, Papastefanou C, Christofides G, Stoulos S, Vavelides M. Natural radioactivity of granites used as building materials. J Environ Radioact. 2006;89(1):48–60. doi: 10.1016/j.jenvrad.2006.03.005. [DOI] [PubMed] [Google Scholar]
- 45.Rost KL, Radon removal system U.S. Patent. 1983;4:371–383.
- 46.Forster RA, Godfrey TN. MCNP-a general Monte Carlo code for neutron and photon transport. InMonte-Carlo Methods and Applications in Neutronics, Photonics and Statistical Physics 1985 (pp. 33–55). Springer, Berlin, Heidelberg.
- 47.Cunniff P. Official methods of analysis of AOAC International. Association of Official Analytical Chemists.; 1996.
- 48.Sowls LK, Smith VR, Jenness R, Sloan RE, Regehr E. Chemical composition and physical properties of the milk of the collared peccary. J Mammal. 1961;42(2):245–251. doi: 10.2307/1376835. [DOI] [Google Scholar]
- 49.Murthy GK, Thomas JW. Trace elements in milk. Crit Rev Environ Sci Technol. 1974;4(1–4):1–37. [Google Scholar]
- 50.Luinge HJ, Hop E, Lutz ET, Van Hemert JA, De Jong EA. Determination of the fat, protein and lactose content of milk using Fourier transform infrared spectrometry. Anal Chim Acta. 1993;284(2):419–433. doi: 10.1016/0003-2670(93)85328-H. [DOI] [Google Scholar]
- 51.Lindmark-Månsson H, Fondén R, Pettersson HE. Composition of Swedish dairy milk. Int Dairy J. 2003;13(6):409–425. doi: 10.1016/S0958-6946(03)00032-3. [DOI] [Google Scholar]
- 52.Lindmark MH. Fatty acids in bovine milk fat. Food Nutr Res. 2008;52(1):1821. doi: 10.3402/fnr.v52i0.1821. [DOI] [PMC free article] [PubMed] [Google Scholar]
- 53.Playne MJ, Crittenden RG, Fox PF, McSweeney P. Advanced dairy chemistry volume 3: lactose, water, salts and minor constituents. Galacto-oligosaccharides and other products derived from lactose. 2009:121–88.
- 54.Górska A, Oprządek K. Concentration of trace elements in raw milk depending on the lactation period and age of cows. Acta Vet Brno. 2011;80(2):203–206. doi: 10.2754/avb201180020203. [DOI] [Google Scholar]
- 55.Vaclavik VA, Christian EW. Milk and milk products In Essent. Food. Sci. Springer, New York, NY. 2014;201–229.
- 56.McConn RJ, Gesh CJ, Pagh RT, Rucker RA, Williams III R. Compendium of material composition data for radiation transport modeling. Pacific Northwest National Lab.(PNNL), Richland, WA (United States); 2011.
- 57.Ito H, Ghen H, Bunnak J. Aflatoxin production by microorganisms of the Aspergillus flavus group in spices and the effect of irradiation. J Sci Food Agric. 1994;65(2):141–142. doi: 10.1002/jsfa.2740650203. [DOI] [Google Scholar]
- 58.Naghmoush MR, Shehata TE, Girgis ES, Kamal TH, Ibrahim MK. Gamma irradiation effect on some bacteriological and other properties of cow's, buffaloe's and goat's milk. Egyptian journal of dairy science. 1983.
- 59.Nathawat NS, Joshi P, Chhipa BG, Hajare S, Goyal M, Sahu MP, Singh G. Effect of gamma radiation on microbial safety and nutritional quality of kachri (Cucumis callosus) J Food Sci Technol. 2013;50(4):723–730. doi: 10.1007/s13197-011-0380-6. [DOI] [PMC free article] [PubMed] [Google Scholar]
- 60.Chen Y, Grodner RM, Andrews LS. Effects of Low-Dose Gamma Irradiation on the Bacterial Microflora of freshly Picked Crabmeat. InProceedings, 19th Annual Tropical and Subtropical Fisheries Technology Conference, Fla. Sea Grant, SGR115, Gainesville, FL 1995 (pp. 46–58).
- 61.Searle AJ, McAthey P. Treatment of milk by gamma irradiation—effect of anoxia on lipid peroxidation and the survival of Pseudomonas aeruginosa. J Sci Food Agric. 1989;48(3):361–367. doi: 10.1002/jsfa.2740480311. [DOI] [Google Scholar]
- 62.Watanabe W. Effect of gamma-ray upon food microorganisms: part VI. Studies on the effect of gamma-ray upon E. coli in components of varied meats part VII. Studies on the effect of gamma-ray upon food Bacteria under some conditions. Journal of the Agricultural Chemical Society of Japan. 1960;24(7):673–684. [Google Scholar]
- 63.Watanabe W. Effect of gamma-ray upon food microorganisms: studies concerning gamma-ray resistivity of Escherichia coli (I) Journal of the Agricultural Chemical Society of Japan. 1958;22(2):68–77. [Google Scholar]
- 64.Rauch P, Fukal L, Prošek J, Březina P, Káš J. Radioimmunoassay of aflatoxin M 1. J Radioanal Nucl Chem. 1987;117(3):163–169. doi: 10.1007/BF02165370. [DOI] [Google Scholar]
- 65.Scott PM. Methods for determination of aflatoxin M1 in milk and milk products—a review of performance characteristics. Food Additives & Contaminants. 1989;6(3):283–305. doi: 10.1080/02652038909373784. [DOI] [PubMed] [Google Scholar]
- 66.Ravindran R, Jaiswal AK. Wholesomeness and safety aspects of irradiated foods. Food chemistry. 2019 6. [DOI] [PubMed]
- 67.Ihsanullah I, Rashid A. Current activities in food irradiation as a sanitary and phytosanitary treatment in the Asia and the Pacific region and a comparison with advanced countries. Food Control. 2017;72:345–359. doi: 10.1016/j.foodcont.2016.03.011. [DOI] [Google Scholar]
- 68.Rustom IY. Aflatoxin in food and feed: occurrence, legislation and inactivation by physical methods. Food Chem. 1997;59(1):57–67. doi: 10.1016/S0308-8146(96)00096-9. [DOI] [Google Scholar]
- 69.Temcharoen P, THILLY WG. Removal of aflatoxin B1 toxicity but not mutagenicity by 1 megarad gamma radiation of peanut meal. J Food Saf. 1982;4(4):199–205. doi: 10.1111/j.1745-4565.1982.tb00445.x. [DOI] [Google Scholar]
- 70.Aziz NH, Moussa LA. Influence of gamma-radiation on mycotoxin producing moulds and mycotoxins in fruits. Food Control. 2002;13(4–5):281–288. doi: 10.1016/S0956-7135(02)00028-2. [DOI] [Google Scholar]
- 71.Assuncao E, Reis TA, Baquiao AC, Correa B. Effects of gamma and electron beam radiation on Brazil nuts artificially inoculated with Aspergillus flavus. J Food Prot. 2015;78(7):1397–1401. doi: 10.4315/0362-028X.JFP-14-595. [DOI] [PubMed] [Google Scholar]
- 72.Iqbal SZ, Bhatti IA, Asi MR, Zuber M, Shahid M, Parveen I. Effect of γ irradiation on fungal load and aflatoxins reduction in red chillies. Radiat Phys Chem. 2013;82:80–84. doi: 10.1016/j.radphyschem.2012.09.015. [DOI] [Google Scholar]
- 73.Mohamed NF, El-Dine RS, Kotb MA, Saber A. Assessing the possible effect of gamma irradiation on the reduction of aflatoxin B1, and on the moisture content in some cereal grains. Am J Biomed Sci. 2015;7(1):33–39. doi: 10.5099/aj150100033. [DOI] [Google Scholar]
- 74.Ghanem I, Orfi M, Shamma M. Effect of gamma radiation on the inactivation of aflatoxin B1 in food and feed crops. Braz J Microbiol. 2008;39(4):787–791. doi: 10.1590/S1517-83822008000400035. [DOI] [PMC free article] [PubMed] [Google Scholar]
- 75.Aquino S, Ferreira F, Ribeiro DH, Corrêa B, Greiner R, Villavicencio AL. Evaluation of viability of Aspergillus flavus and aflatoxins degradation in irradiated samples of maize. Braz J Microbiol. 2005;36(4):352–356. doi: 10.1590/S1517-83822005000400009. [DOI] [Google Scholar]
- 76.Yousef AE, Marth EH. Degradation of aflatoxin M1 in milk by ultraviolet energy. J Food Prot. 1985;48(8):697–698. doi: 10.4315/0362-028X-48.8.697. [DOI] [PubMed] [Google Scholar]
- 77.Fadia F, Halima ZH. Detection of aflatoxin M1 in pasteurized canned Milk and using of UV radiation for detoxification. Int’l Journal of Advances in Chemical Engg and Biological Sciences. 2017;4(1):130–133. [Google Scholar]