

Abstract
Background
Azo group dyes are the largest group of synthetics dyes that widely used in industries, especially in textile industry. The presence of these organic compounds in wastewaters and their discharge into environment without efficient treatment may cause adverse effect on human, living and aquatic environment. The purpose of this study was to optimize the adsorption of azo dye of Direct Red 81 (anionic dye) and Basic Blue 41 (cationic dye) from aqueous solution onto magnetic NiFe2O4/RGO nanocomposite.
Methods
In this study the response surface methodology (RSM) based on the central composite design (CCD), was used to optimization and modeling of adsorption process DR81 and BB41 dye on NiFe2O4/RGO. in order to investigating the effect of the operating parameters on the adsorption efficiency DR81 and BB41, four influential factors were chosen that includes of pH (3–9), contact time (5–25 min), adsorbent amount (0.02–0.05 g) and initial dye concentration (40–200 mg/L). A total of 30 experiments were performed for each dye in this study. The concentration of dye in solution was measured by spectrophotometer. The structure of synthesized adsorbent was investigated using Scanning Electron Microscope (SEM), X-ray diffraction (XRD), Fourier transform irradiation (FTIR), transmission electron microscope (TEM) and vibrating sample magnetometer (VSM).
Results
Analysis of variance (ANOVA) showed that regression model for both dye adsorption with value of P value <0.001 is significant statistically. The correlation coefficient (R2) for DR81 (R2 = 0.9968) and BB41 (R2 = 0.9948) indicated which there is a good agreement between predicted values and the results of the experiments and the model also well predict the adsorption efficiency. Furthermore, the factors of pH, dye concentration and adsorbent dose, have the greatest effect on adsorption, respectively, while contact time have the lowest effect on adsorption of both dyes. The adsorption behavior of the DR81 and BB41 onto NiFe2O4/RGO was best described by the Langmuir and Freundlich isotherm, respectively. The optimum conditions for maximum removal of DR81 (96.41%) was found to be at pH 3, contact time 19.68 min, adsorbent dose 0.02 g and initial dye concentration 40 mg/L. However, the optimum conditions for maximum removal of BB41 (97.87%) was found to be at pH 9 contact time 18.16 min, adsorbent dose 0.02 g and initial dye concentration 40 mg/L.
Conclusion
The present study shows that magnetic NiFe2O4/RGO nanocomposite have much potential as a powerful adsorbent for the rapid adsorption of anionic (DR81) and cationic dyes (BB41) from aqueous solution.
Keywords: Adsorption, Azo dyes, Direct red 81, Basic blue 41, NiFe2O4/RGO, Response surface methodology
Introduction
Dye are organic compounds which are used extensively in industries such as textiles, printing, paper, leather, rubber, food, cosmetics, plastics, pharmaceuticals, photography and etc. [1]. It is estimate that more than 100,000 various dye types and 700,000 tons of dyes are used annually in different industries which during dyeing operation about 10 to 15% of the total applied dyes discharge into sewer. Azo group dyes which are characterized with one or more azo bonds (–N=N–), is the largest group of dyes used in industries in the world, especially in textile industry [2, 3]. These dyes are known as pollutants in the environment and they are non- degradable, toxic, carcinogenic, teratogenic or mutagenic to human and living due to the presence of benzene rings in their aromatic structure [4], and have adverse effect on aquatic environment because of preventing the penetration of sunlight into water, precluding the photosynthetic activity of aquatic plants and decrease dissolved oxygen [5].
Many methods have been used for the treatment of dye contaminated industrial wastewater including chemical oxidation [6], photocatalytic degradation [7], biological treatment [8], Chemical coagulation/flocculation [9], ozonation [10], enzymatic treatment [11–13], ion exchange [14] and adsorption process [15]. Adsorption is an economic and effective technique for removal of dye pollutants from wastewater and in comparison, with other processes have several advantages such as low cost, simplicity in design, easy operation, insensitivity to toxic material, high efficiency, and ability to treat concentrated effluents [16, 17] .In general wide range of adsorbents such as activated carbon [18], agricultural waste [19], chitosan [20], zeolites [21], clays [22], polymeric adsorbents [23], perlite [24], kaolin [25] and etc. have been used for the removal of dyes from industrial effluents. However, researches always try to find a novel adsorbent with high performance for removal of dye from wastewater. Nowadays, nanostructured adsorbents due to large specific surface and high adsorption capacity have been much attention for wastewater treatment. Graphene as one of the carbon allotropes is a flat single-layer from graphite with sp2 hybridized carbon atoms covalently bonded, that atoms arranged in a two-dimensional honeycomb network [26]. In recent years the graphene have attracted much attention in science owing to its unique properties such as electrical, optical, mechanical, high thermal conductivity and large specific surface area [27, 28]. Because of this extraordinary properties, it has wide applications in environmental pollution purification and various of industries such as electronic devices, solar cells, sensors, batteries, supercapacitors, hydrogen storage [29, 30] .Graphene, with high specific surface area, the large delocalized π-electron system and good chemical stability can make a strong π–π interactions with the benzene rings present in aromatic structure of dyes [31], therefore, it can be used as an effective and high-performance absorbent for removal of colored pollutant from aqueous solutions. One of the best ways to producing graphene in large scale, low cost and high-yield production is reduction of graphene oxide (GO) to reduced graphene oxide (RGO) by chemical method [32]. The mechanism of dye molecules adsorption on RGO surface is using of electrostatic forces, oxygen functional groups, vacancy defects and π–π interactions [33]. The separation of graphene-based absorbents from solution after adsorption process is very difficult due to their small particle size. Therefore, in order to solve this problem, recently many researchers have been focused on the magnetic graphene-based material that facilitate separation from solution rapidly and effectively by magnetic field [34]. For example Hou Wang and et al. reported the facile synthesis of polypyrrole decorated reduced graphene oxide-Fe3O4 magnetic composites as absorbent for the removal of Cr(VI) [35]. Yonrapach and et al. investigated the enhanced sonocatalytic degradation of organic dyes from aqueous solutions by novel synthesis of mesoporous Fe3O4-graphene/ZnO@SiO2 nanocomposites [36].
In recent years, magnetic ferrite nanocrystals with the general formula MFe2O4 (M = Fe, Co, Cu, Mn, Ni, etc.) have attracted much attention in fields of technology and environmental remediation owing to considerably sized and shape magnetic nanostructures properties. Nickel ferrite (NiFe2O4) with an inverse spinel structure is one of the important ferrites which used as a soft magnetic material and has a ferromagnetic behavior that originates from a magnetic moment of antiparallel spins between Fe3+ ions at tetrahedral sites and Ni2+ ions at octahedral sites [37, 38]. this ferrite is a magnetic material with high-electrical resistivity, high surface area high-Curie temperature and environmental stability that widely used in power and signal transformation, storage devices, microwave devices, gas sensors, ferrofluids, and catalysts [38, 39]. Considering the unique properties of graphene and superparamagnetic property of NiFe2O4, the combination of them, can be used in form of magnetic NiFe2O4/RGO nanocomposite as an efficient and recoverable adsorbent to removal of contaminants, such as synthetic dyes in wastewater treatment. The separation this nanocomposite of solution during the adsorption process is easy by a magnet due to it magnetic property.
The response surface methodology (RSM) is a combination of statistical and mathematical techniques which widely used in analytical chemistry for determine of main and interaction effects of independent variables (input) on the response variable (output) in the any process and also determine of factors that have more effect on process [40, 41]. This statistical method establishes an empirical models based on the data obtained from experimental results in order to evaluate the relationship between independent factors and responses as well as the to optimize the optimum condition [42]. Another objective of this method is determine optimal levels of operating parameters in order to achieve the best performance in process [43]. Among several matrix designs in RSM, central composite design (CCD) due to the simple structure and high efficiency is most commonly method applied to investigate individual and combined effects of independent parameters on response with least number of experiments [44, 45]. The present work was to investigate the adsorption of Direct Red 81 (anionic dye) and Basic Blue 41(cationic dye) as a model of azo dyes from aqueous solutions using magnetic NiFe2O4/RGO nanocomposite as an adsorbent by applying response surface methodology (RSM).
Materials and methods
Materials
Direct red 81 (C29H19N5Na2O8S2) is a diazo dye with molecular weight of 675.59 g/mol and the Basic blue 41 (C20H26N4O6S2) is a mono azo dye with molecular weight of 482.57 g/mol. Both synthetic dyes were of analytical grade and were provided by Alvan Sabet Co. (Tehran, Iran). All other chemicals were purchased from Sigma-Aldrich and used without further purification.
Adsorbent characterization
XRD patterns were recorded on a Philips X’pert diffractometer with mono chromatized Cu Kα radiation at 40 kV in the range of 2θ 10-80o. SEM imaging was performed on an EM-3200 scanning electron microscope. FT-IR spectra were recorded in KBr disks on an ALPHA Bruker instrument. TEM images were recorded on a MC 10 transmission electron microscope from PHILIPS with an acceleration voltage of 80 kV. VSM magnetization curves were recorded on a LBKFB instrument from Meghnatis Daghigh Kavir Company, Iran.
Preparation of magnetic NiFe2O4/RGO nanocomposite
The approach of the preparation of NiFe2O4/RGO includes four steps comprising the preparation of the GO, the preparation of the NiFe2O4 nanoparticles, anchoring the NiFe2O4 nanoparticles onto the GO structures and finally reducing the NiFe2O4/GO to NiFe2O4/RGO [46].
Graphene oxide was prepared according to the method of Marcano et al. [47]. In brief, graphite (3.0 g) was added to a mixture of concentrated H2SO4/H3PO4 (360:40 mL), and then 18.0 g of KMnO4 was added. The reaction was then stirred at 50 °C for 12 h. After cooling to room temperature, the mixture was poured into a mixture of ice (400 g) and hydrogen peroxide (3.0 mL, 30%). The solid was then filtered through polyester fiber (Carpenter Co.) and the filtrate centrifuged at 4000 rpm for 4 h. The precipitate was then washed with water, HCl (30%), and ethanol (200 mL of each), and vacuum-dried overnight.
Nickel ferrite (NiFe2O4) nanoparticles were synthesized via a modified co-precipitation method [48]. An aqueous solution of Fe (NO3)3.9H2O and Ni (NO3)2.6H2O was prepared in 2:1 M ratio. A specified amount of oleic acid was added to the solution as the surfactant. The solution was heated to 90 °C. In the following, the pH was adjusted to 10 by 28% ammonia solution while vigorously stirred. The liquid precipitate was then brought to a reaction temperature of 80 °C and stirred for 30 min. The product was cooled to the room temperature and then washed twice with distilled water and ethanol to eliminate the unwanted impurities and the residual surfactant from the prepared sample. To the next step, this product was re-dispersed in distilled water using bath sonication for 15 min. In the following steps: at first, 5 g of GO was dispersed in 200 mL distilled water using an ultrasonic probe (FAPAN 400UT- FAPAN Ultrasound Technology, Iran) for 1 h, leading to the formation of a GO brown suspension. This suspension was added to the ferrite nanoparticles’ suspension in a 1:1 mass ratio while vigorously stirred. Resulting suspension was sonicated for 30 min using probe sonicator. Finally, the suspension was heated to 90 °C. The hydrazine hydrate was added with vigorous stirring to the mentioned suspension. After stirring for 2 h, the dark-brown suspension was centrifuged, washed with water and ethanol several times.
Batch adsorption studies
The stock solution of Direct Red81 and Basic Blue 41 was prepared at a concentration of 1000 mg/L by dissolving in deionized water. The required dye concentration was prepared from the stock solution by dilution. In order to study the adsorption process by NiFe2O4/RGO the adsorption experiments were carried out by batch method. The influence of various operating variables on the adsorption including pH, contact time, dye initial concentration and adsorbent dose were investigated. The experiments were performed by mixing various amounts of NiFe2O4/RGO in a 100 mL beaker containing 50 mL dye solution (DR81 and 41) of known concentration. The pH of the solution was adjusted to the desired value using 0.1 N NaOH and 0.1 N HCl and was measured by a pH meter (met Rohm, 827 pH lab). Then the mixture was agitated at a speed of 180 rpm by a stirrer for a predefined time. The chemical structure of mentioned dyes is shown in Fig. 1.
Fig. 1.

Chemical structure of dyes DR81 (a) and BB41 (b)
At the end of adsorption process, the NiFe2O4/RGO was separated from the solution using a magnetic field and the residual concentration of the dye in the solution was measured by a spectrophotometer (UV DR5000) at a maximum absorbency wavelength (λmax) of 510 nm for DR81 and 609 nm for BB41. The adsorption percentage of dye was calculated using the following equation:
| 1 |
Where, Co (mg/L) and Ct (mg/L) are the initial and equilibrium concentration of dyes in aqueous solution, respectively.
Experimental design with response surface methodology (RSM)
In this study, the response surface methodology (RSM) based on the central composite design (CCD), one of the most popular methods of designs, was used for the optimization and modeling of the adsorption process of DR81 and BB41 dye on NiFe2O4/RGO. Therefore, in order to investigate the effect of the operating parameters on the adsorption efficiency of DR81 and BB41, as shown in Table 1, four main and influential factors were chosen, which included pH, contact time, adsorbent amount and initial dye concentration in three coded levels (−1, 0, +1,). A total of 30 experiments were performed for each dye in this study including, 16 cube points, 6 replicates at the center point and 8 axial points. The number of experimental runs was determined by the following equation:
| 2 |
Table 1.
Independent variables and levels used for response surface design
| Independent Factors | Coded symbol | Level | ||
|---|---|---|---|---|
| Low (−1) | Central (0) | High (+1) | ||
| pH | A | 3 | 6 | 9 |
| Contact time (minute) | B | 5 | 15 | 25 |
| Adsorbent dose (g) | C | 0.02 | 0.035 | 0.05 |
| Initial dye concentration(mg/L) | D | 40 | 120 | 200 |
Where N is the total number of experiments, n is the number of operational factors, and nc is the number of replications in central points.
An empirical second order quadratic equation a model was used to evaluate the interaction between the independent (input) and the dependent (output) variables expressed with the following equation:
| 3 |
Where y expresses the response or adsorption percentage, β0 indicates the intercept constant, Xi and Xj represent independent variables, βi shows the coefficients of linear terms, βii represents the coefficients of quadratic terms, βij shows the coefficients of interaction terms, ε indicates experimental error and k represents the number of independent variables.
The analysis of variance (ANOVA) was used in order to evaluate the validity, significance and accuracy of model and also statistical significance of effect of each variable. Statistical significance of quadratic model is determined using lack-of-fit, correlation coefficient (R2), adjusted correlation coefficient (R2 adj) between predicted and experimental results. The Design Expert software version 7.0.0 (Stat-Ease, trial version) was utilized to analyse and interpret the results of the experimental design.
Results and discussion
Characterization of the NiFe2O4/RGO
XRD patterns of GO, NiFe2O4, and NiFe2O4/RGO are compared in Fig. 2. In the XRD pattern of the composite, corresponding reflections of single phase cubic NiFe2O4 nanoparticles are clearly visible at 2θ 30.5, 35.9, 43.4, 53.7, 57.4, 62.9, 74.4, and 75.7 according to standard values in the card (JCPDS card No. 074–2081). The index peak of GO at 2θ 12, was eliminated in the XRD pattern of the composite which can be an evidence of reduction to RGO.
Fig. 2.

XRD patterns of GO (a), NiFe2O4 (b), and NiFe2O4/RGO (c)
FTIR spectra of NiFe2O4, GO and NiFe2O4/RGO are shown in Fig. 3. It is clear that in the FTIR spectrum of NiFe2O4/RGO, the characteristic vibration of C=O functional groups of GO at 1740 cm-1 has been disappeared. Broad band at about 3450 cm-1 is attributable to the O-H stretching of the adsorbed water molecules, and C=C stretching vibrations are located at about 1640 cm-1. Metal-oxygen vibrations are also clearly visible at about 600 cm-1.
Fig. 3.

FTIR spectra of NiFe2O4 (a), GO (b) and NiFe2O4/ RGO (c)
In order to gain an insight to the morphology of the synthesized materials, scanning electron microscopy (SEM) was used. Figure 4 shows the micrographs obtained for GO, NiFe2O4 and NiFe2O4/RGO. GO was appeared as non-geometric sheets. Nickel ferrite nanoparticles were appeared as many ultrafine spherical particles which were aggregated due to their intrinsic magnetic properties. Interestingly, NiFe2O4/RGO composite was formed as an almost uniform dispersion of NiFe2O4 nano-spheres over the surface of reduced graphene oxide sheets.
Fig. 4.

SEM images of GO (a), NiFe2O4 (b) and NiFe2O4/ RGO (c)
To make graphene sheets appear more clearly, TEM imaging was performed. In Fig. 5, part of an uncoated sheet is seen at the bottom. However, at the top of the image, the dense nanoparticles aggregated on the graphene sheet prevent it from being seen.
Fig. 5.
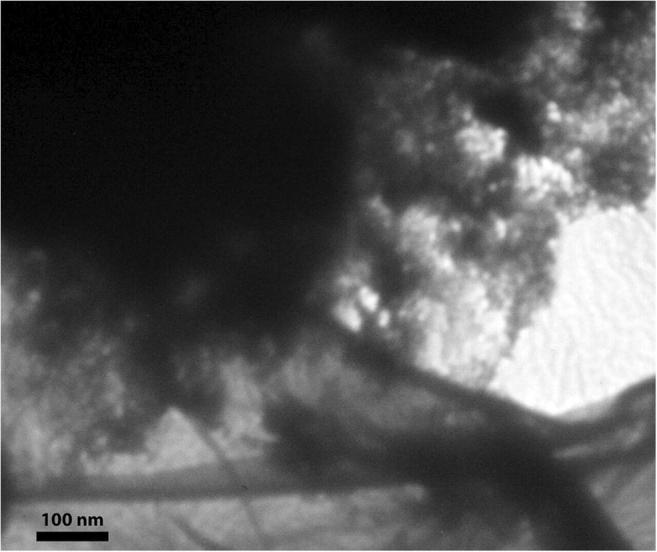
TEM image of NiFe2O4/ RGO
Figure 6 Shows photographs of dye solution DR81 and BB41 before and after adsorption using NiFe2O4/RGO and effect of magnetic separation. As shown, after shaking the mixture of NiFe2O4/RGO and dye solution, nanocomposite can be good dispersed in the aqueous solution and forming black suspension. After adsorption, NiFe2O4/RGO nanocomposites can be easily separated from the solution in a short time (30s) by placing an external magnetic close to beaker and at the result the solution became transparent. This demonstrated that the NiFe2O4/RGO nanocomposite with having the properties of adsorption capacity and magnetism, could be used as a magnetic and effective adsorbent to remove organic pollutants in aqueous solution. Magnetic behavior of NiFe2O4/ RGO as a function of applied magnetic field at 298 K is shown in Fig. 7. The NiFe2O4/ RGO sample exhibited superparamagnetic behavior with a large saturation magnetization of 31.0 emu.g−1
Fig. 6.
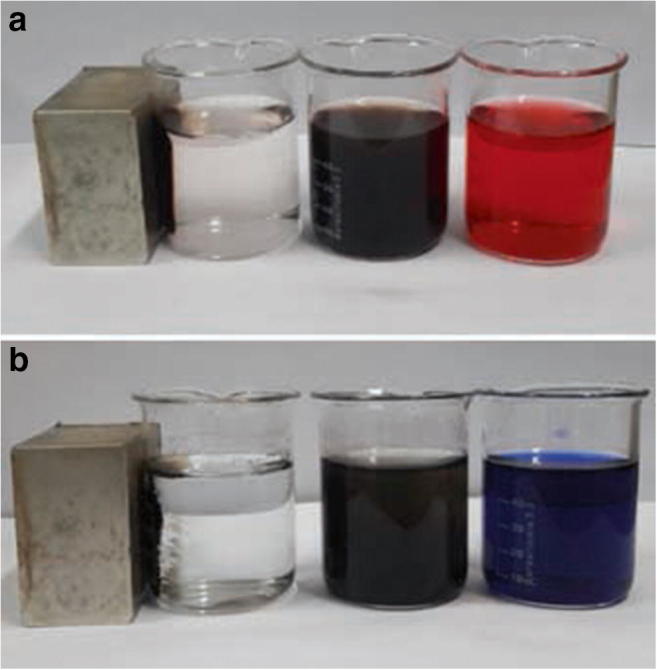
Photographs of magnetic separation of NiFe2O4/ RGO adsorbent from solution with external magnetic field (a; DR81 and b; BB41)
Fig. 7.
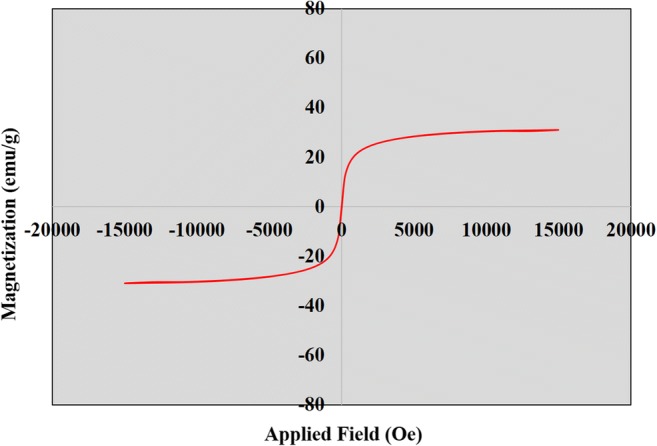
VSM magnetization cure for NiFe2O4/ RGO measured at 298 K
Statistical analysis and analysis of variance (ANOVA)
By applying the analysis of multivariable regression on experimental data (Table 2), the relation of response (adsorption efficiency) and the investigated variables was obtained using the quadratic equation (Eq.1) according to the following equations for DR81 and BB41 respectively:
| 4 |
| 5 |
Table 2.
Experimental and predicted results and variable matrix from CCD for DR81 and BB41
| Independent factors | Adsorption efficiency (%) | |||||||
|---|---|---|---|---|---|---|---|---|
| DR81 | BB41 | |||||||
| Run | A | B | C | D | Experimental | Predict | Experimental | Predict |
| 1 | 9 | 25 | 0.05 | 200 | 39.67 | 40.76 | 86.86 | 85.03 |
| 2 | 6 | 5 | 0.035 | 120 | 40.88 | 41.50 | 61.70 | 61.80 |
| 3 | 9 | 5 | 0.05 | 200 | 35.24 | 36.97 | 82.07 | 81.36 |
| 4 | 9 | 5 | 0.02 | 200 | 18.55 | 15.87 | 58.41 | 60 |
| 5 | 3 | 5 | 0.02 | 40 | 96.12 | 94.86 | 42.25 | 44.23 |
| 6 | 6 | 15 | 0.035 | 120 | 43.50 | 43.62 | 65.69 | 65.36 |
| 7 | 6 | 15 | 0.035 | 120 | 44.80 | 43.62 | 64.50 | 65.36 |
| 8 | 6 | 15 | 0.035 | 120 | 42.06 | 43.62 | 65.03 | 65.36 |
| 9 | 3 | 5 | 0.05 | 200 | 81.04 | 80.35 | 37.62 | 39.01 |
| 10 | 6 | 15 | 0.02 | 120 | 32.79 | 34.67 | 58.06 | 57.36 |
| 11 | 3 | 25 | 0.02 | 200 | 59.62 | 61 | 24.67 | 24.17 |
| 12 | 9 | 25 | 0.02 | 200 | 20.24 | 19.26 | 62.09 | 64.48 |
| 13 | 6 | 15 | 0.035 | 40 | 53.83 | 53.31 | 74.80 | 74.63 |
| 14 | 3 | 25 | 0.05 | 40 | 99.40 | 101.90 | 52.17 | 50.73 |
| 15 | 9 | 5 | 0.02 | 40 | 40.12 | 41.81 | 94.23 | 92.37 |
| 16 | 6 | 15 | 0.05 | 120 | 49.89 | 48.15 | 71.41 | 70.12 |
| 17 | 3 | 5 | 0.05 | 40 | 99.20 | 100.32 | 50.45 | 49.22 |
| 18 | 6 | 15 | 0.035 | 120 | 44.22 | 43.62 | 64.05 | 65.36 |
| 19 | 9 | 25 | 0.02 | 40 | 43.78 | 44.30 | 96.23 | 94.99 |
| 20 | 3 | 25 | 0.02 | 40 | 97.64 | 96.05 | 45.50 | 46.56 |
| 21 | 9 | 15 | 0.035 | 120 | 40.52 | 41.61 | 89.96 | 89.53 |
| 22 | 6 | 15 | 0.035 | 120 | 43.11 | 43.62 | 64.73 | 65.36 |
| 23 | 6 | 25 | 0.035 | 120 | 44.48 | 43.99 | 66.88 | 64.79 |
| 24 | 3 | 5 | 0.02 | 200 | 57.87 | 58.91 | 21.87 | 19.97 |
| 25 | 6 | 15 | 0.035 | 120 | 44.45 | 43.62 | 62.2 | 65.36 |
| 26 | 9 | 25 | 0.05 | 40 | 50.71 | 49.81 | 99.24 | 101.49 |
| 27 | 3 | 15 | 0.035 | 120 | 90.13 | 89.18 | 45.70 | 44.14 |
| 28 | 9 | 5 | 0.05 | 40 | 48.49 | 46.93 | 99.04 | 99.69 |
| 29 | 3 | 25 | 0.05 | 200 | 84.38 | 82.84 | 40.17 | 42.38 |
| 30 | 6 | 15 | 0.035 | 200 | 30.16 | 30.81 | 56.09 | 54.27 |
In these eqs. R is the adsorption efficiency percent, A, B, C and D are the independent variables pH, contact time (minute), adsorbent dosage (g/l) and initial dye concentration (mg/l), respectively.
Analysis of variance (ANOVA) was used to investigate the accuracy and significance of the statistical model and also statistical significance of individual and interaction effects of each variable on adsorption process. Statistical significance of the model was checked by P- value, lack of fit and R2. A P- value less than 0.05 demonstrates the effect of parameters and model items are significant (at 95% confidence level) [49].
According to the results presented in Tables 3 and 4, the quadratic model with P value <0.0001, F-value = 337.32 for DR81 and P value <0.0001, F-value = 204.41 for BB41 is statistically significant. The lack of fit of the model for both dyes was insignificant (p value = 0.0551, F-value = 4.51 for DR81 and p value = 0.0696, F-value = 4 for BB41), it implies that the proposed model has a good fit to the experimental data and the independent variables have significant effects on the response. The R2 values of model for DR81 (0.9968) and BB41 (0.9948) that indicated suitability more than 99.68% and 99.48% of the data obtained from the experiments with the predict data by the model for DR81 and BB41, respectively. On the other hand, the adjusted R2 (0.9939) for DR81 and (0.9899) BB41 was close to R2 (0.9968 and 0.9948) that confirmed there is good agreement between the predicted values by the model and results of the experiments for both dye and implied that the proposed model can well predict experimental results. Also, the low value of the Coefficient of Variation (3.43 and 3.26% for DR81and BB41, respectively) indicates the accuracy of the measurements and the reliability of the experiments. The adequate precision measures signal to noise ratio and a ratio greater than 4 is desirable. Adequate precision for adsorption model of DR81 (65.790) and BB41 (55.709) demonstrating an adequate signal, therefore model can be used to navigate the design space.
Table 3.
ANOVA for adsorption of DR81
| Source | Sum of squares | Degree of freedom | Mean square | F-Value | Prob > F |
|---|---|---|---|---|---|
| Model | 16,151.68 | 14 | 1153.69 | 337.32 | <0.0001 |
| A | 10,180.69 | 1 | 10,180.69 | 2976.65 | <0.0001 |
| B | 27.90 | 1 | 27.90 | 8.16 | 0.0120 |
| C | 817.29 | 1 | 817.29 | 238.96 | <0.0001 |
| D | 2278.58 | 1 | 2278.58 | 666.21 | <0.0001 |
| AB | 1.68 | 1 | 1.68 | 0.049 | 0.4937 |
| AC | 0.11 | 1 | 0.11 | 0.033 | 0.8576 |
| AD | 100.25 | 1 | 100.25 | 29.31 | <0.0001 |
| BC | 0.15 | 1 | 0.15 | 0.045 | 0.8348 |
| BD | 0.81 | 1 | 0.81 | 0.24 | 0.6326 |
| CD | 255.28 | 1 | 255.28 | 74.64 | <0.0001 |
| A2 | 1228.03 | 1 | 1228.03 | 359.05 | <0.0001 |
| B2 | 1.98 | 1 | 1.98 | 0.58 | 0.4585 |
| C2 | 12.70 | 1 | 12.70 | 3.71 | 0.0731 |
| D2 | 6.30 | 1 | 6.30 | 1.84 | 0.1949 |
| residual | 51.30 | 15 | 3.42 | ||
| Lack of fit | 46.18 | 10 | 4.62 | 4.51 | 0.0551 |
| Pure error | 5.12 | 5 | 1.02 |
SD 1.85, Mean 53.90, CV 3.43, AP 65.79, Press 354.35, R2 0.9968, R2(adj.) 0.9939
Table 4.
ANOVA for adsorption of BB41
| Source | Sum of squares | Degree of freedom | Mean square | F-Value | Prob > F |
|---|---|---|---|---|---|
| Model | 12,255.74 | 14 | 875.41 | 204.41 | <0.0001 |
| A | 9272.50 | 1 | 9272.50 | 2165.16 | <0.0001 |
| B | 40.44 | 1 | 40.44 | 9.44 | 0.0077 |
| C | 733.57 | 1 | 733.57 | 171.29 | <0.0001 |
| D | 1865.59 | 1 | 1865.59 | 435.62 | <0.0001 |
| AB | 0.084 | 1 | 0.084 | 0.020 | 0.8904 |
| AC | 5.43 | 1 | 5.43 | 1.27 | 0.2779 |
| AD | 65.85 | 1 | 65.85 | 15.38 | 0.0014 |
| BC | 0.67 | 1 | 0.67 | 0.16 | 0.6975 |
| BD | 3.48 | 1 | 3.48 | 0.81 | 0.3817 |
| CD | 197.26 | 1 | 197.26 | 46.06 | <0.0001 |
| A2 | 5.61 | 1 | 5.61 | 1.31 | 0.2703 |
| B2 | 11.08 | 1 | 11.08 | 2.59 | 0.1285 |
| C2 | 6.83 | 1 | 6.83 | 1.59 | 0.2260 |
| D2 | 2.16 | 1 | 2.16 | 0.50 | 0.4884 |
| Residuals | 64.24 | 15 | 4.28 | ||
| Lack of fit | 57.10 | 10 | 5.71 | 4 | 0.0696 |
| Pure error | 7.14 | 5 | 1.43 |
SD 2.07, Mean 63.48, CV 3.26, AP 55.709, Press 394.97, R2 0.9948, R2(adj.) 0.9899
As shown in Tables 3 and 4, according to statistical analysis of studied variables on adsorption process, it can be realized that all variables have significant effects on the adsorption efficiency of both dye by NiFe2O4/RGO (P value <0.05), with the explanation that pH have the greatest effect on the adsorption efficiency of both dye (F-value of 2976.65 and 2165.16 for DR81 and BB41 adsorption, respectively). Although, the contact time with the less value of F-value has the less effect than three other variables on the adsorption efficiency (F-value of 8.16 and 9.44 for DR81 and BB41 adsorption, respectively). On the other hand, the interaction effects of variables of AD and CD for both dye are statistically significant.
To evaluate the accuracy and adequacy of the model, the difference between predicted and residual values was used to check the accuracy of the model graphically. The residuals are considered as non-fitted changes by the model. Figure 8a and b, depicts the normal probability plot versus residuals with a 95% confidence for adsorption of studied dyes. Normal probability plot is a graphical tool for testing whether the data follows a normal distribution or not. If the data points on the normal probability plot of the residues form an approximate straight line, indicated that the data are normally distributed and departure from this straight line indicates departure from normality. From this figure, it is confirmed that the data points form the approximately straight line, thus indicating the data set is approximately normally distributed and data are reliable [19].
Fig. 8.

Normal plots of residuals for DR81 (a) and BB41 (b), Plot of the experimental versus predicted data of DR81(c) and BB41 (d) adsorption
The plot of relationship and correlation between predicted values by model with actual values of the dye adsorption percentages at 95% confidence interval was shown in Fig. 8 (c) and (d), for DR81 and BB41, respectively. It is obvious from the plot that the predicted data for both dye adsorption processes were close to the actual data. On the other hand, the values of R2 and adjusted R2 for plot of DR81 (R2; 0.9968, Adj. R2; 0.9939) and BB41 (R2; 0.9948, Adj. R2; 0.9899), indicated there is a good agreement between the predicted values and the results of the experiments and also significance of the model was applied for the adsorption of DR81 and BB41 on NiFe2O4/RGO. Therefor the quadratic model is suitable for predicting the adsorption efficiency of both dye in the studied conditions.
Effect of interactive variables and 3D response surface plot
Figures 9a–f and 10a–f shows the three-dimensional (3D) plots of the effect of the all independent variables on the adsorption efficiency of DR81 and BB41 dyes, respectively. In the case of pH effect on the adsorption efficiency of DR81, (Fig. 9a–c), can be realized that with decreasing of pH from 9 to 3 the adsorption efficiency has increased significantly. This is due to that in highly acidic conditions (pH = 3), H+ ions increases in the solution as well as the adsorbent surface is protonated and positively charged. Consequently, anionic molecules of DR81 with negatively charge is adsorbed on the positive surface of NiFe2O4/RGO through electrostatic force. On the other hand, in alkaline conditions with the increasing of pH up to 9, OH− ions increased in the solution so the adsorbent surface is negatively charged and consequently the electrostatic force and adsorption efficiency decreased. In the case of BB41 adsorption efficiency, it is noticeable that with increasing of pH from 3 to 9, the adsorption efficiency has increased significantly. This increases trend for adsorption is due to the increasing of OH− ions in the solution, which causes the surface negatively charged of adsorbent consequently the cationic molecules of BB41 with positively charge is adsorbed on the negative surface of NiFe2O4-rGO through electrostatic gravitation force. Further, with decreasing pH from 9 to 3, increasing H+ ions in the solution, and increasing of electrostatic repulsion between positive surface of NiFe2O4/RGO and positive charge of BB41, adsorption efficiency is decreased (Fig. 10a–c).
Fig. 9.

3-D surface plot for the combined effect of pH and contact time (a) pH and adsorbent dose (b) pH and initial concentration of dye (c), contact time and adsorbent dose (d) contact time and initial concentration of dye (e) adsorbent dose and initial concentration of dye (f) on adsorption of DR81
Fig. 10.

3-D surface plot for the combined effect of pH and contact time (a) pH and adsorbent dose (b) pH and initial concentration of dye (c), contact time and adsorbent dose (d) contact time and initial concentration of dye (e) adsorbent dose and initial concentration of dye (f) on adsorption of BB41
Figures 9b, d, f and 10b, d, f show the increase of adsorption efficiency for the DR81 and BB41 with increasing of NiFe2O4/RGO dose at different concentrations and different contact time, this increase in adsorption is due to the increasing of available active sites on the NiFe2O4/RGO surface for dye molecules. Although, adsorption efficiency has been increased with increasing adsorbent dose, but the amount of adsorbed dye per unit mass of adsorbent is decreased due to the saturation of sites on the adsorbent. Similar trend has been reported for Modeling of arsenic removal from aqueous solution by means of MWCNT/alumina nanocomposite [50].
The effect of the contact time on the adsorption dye of DR81and BB41 is shown in Figs. 9a, d, e and 10a, d, e. These figures show that with increasing contact time the adsorption of dye on NiFe2O4/RGO increased, but this increasing trend is not considerable. Due to the large number of active sites adsorption on the NiFe2O4/RGO, the maximum adsorption rate occurs during the initial stages of the reaction up to first 5 min, and then with gradual occupancy of these sites the adsorption rate significantly becomes slow. After a lapse of time, the occupation of the remaining vacant sites adsorption on the adsorbent is more difficult for the dye molecules due to the repulsive force between the dye molecules and bulk solution [51].
The plot of the effect of dye concentration on adsorption efficiency is shown in Fig. 9c, f for DR81 and Fig. 10c, f for BB41. As can be observed with increasing dye concentration, the adsorption efficiency is decreased for both dyes. The reasons for the decreasing trend of the DR81dye adsorption by increasing concentration of dye may be explain by this point that in high concentration of dye, the ratio of the molecules of dye to the active sites of adsorption on NiFe2O4/RGO is high, and with the saturation of active sites on adsorbent, there will not be enough capacity for adsorption of further molecules and thus the chance of dye molecules are decreased for binding on the adsorbent surface. However, in high concentration of dye, despite the reduction in adsorption efficiency, adsorption capacity has increased. The similar trends have been reported for the adsorption of anionic dye Reactive Blue 19 onto Fe3O4 functionalized with hyperbranched polyethylenimine (Fe@HPEI) [49].
Optimization
The main purpose of the optimization process was to find a combination of variables levels in which the maximum adsorption efficiency of dyes of DR81 and BB41 is occurred by magnetic NiFe2O4/RGO nanocomposite. For this purpose, software Design-expert version 7.0.0 (Stat-Ease, trial version), and numerical technique, the best operating conditions accessible were obtained in the range of studied variables to achieve the specific point that maximizes the efficiency (Fig. 11). In numerical optimization approaches, response was set in maximize, adsorbent dose was set in minimize, contact time and initial dye concentration was set in the studied range. According to the obtained results, under optimum condition, the maximum adsorption for DR81 (anionic dye) and BB41 (cationic dye) were observed selectively at pH value of 3, 9 Contact time of 19.68, 18.16 min, adsorbent dose of 0.02 g and dye concentration of 40 mg/L. maximum efficiency by the model at this condition was found to be 96.41% for DR81and 97.87% for BB41.
Fig. 11.

Numerical optimization of four independent variables, contact time, adsorbent dosage and dye concentration for adsorption DR81 (a) and BB41 (b) onto NiFe2O4/RGO
Adsorption isotherms
The adsorption isotherm models were used to investigate the adsorption behavior of the DR81 and BB41 dyes onto the NiFe2O4/RGO. For this purpose the experimental data were fitted with two of the most commonly used isotherm models, including the Langmuir and Freundlich isotherms. Langmuir isotherm assumes that, only monolayer adsorption occurs on adsorbent surface with a fixed number of adsorption sites and adsorbed molecules do not interact with each other. Also the Freundlich isotherm assumes that adsorption is multilayer reversible and adsorption energy decreases exponentially with the completion of adsorption sites. The plots of Langmuir and Freundlich isotherms are shown in Fig. 12. As observed from this figure, the Langmuir model is more suitable in the description of the adsorption behavior of DR81 dye on the NiFe2O4/RGO with higher values of R2 of 0.9759, while in the case of BB41 dye the adsorption can be best described by the Langmuir model with the higher value of R 2 0.9753.the various parameters of the isotherm models are shown in Table 5.
Fig. 12.

Langmuir and Freundlich isotherm plots for adsorption of DR81, BB41onto the NiFe2o4 / RGO
Table 5.
Langmuir and Freundlich isotherm constants for DR81, BB41
| Dye | Langmuir isotherm coefficient | Freundlich isotherm coefficient | ||||
|---|---|---|---|---|---|---|
| qm (mg/g) | KL (L/mg) | R2 | KF (mg/g) | 1/n | R2 | |
| DR81 | 3762.935 | 1.116362 | 0.9759 | 23.5933 | 0.2929 | 0.9164 |
| BB41 | 3449.23 | 0.96827 | 0.9538 | 22.0298 | 0.3548 | 0.9753 |
Conclusions
The present study shows that the magnetic NiFe2O4/RGO nanocomposite has much potential as a powerful adsorbent for the rapid adsorption of anionic (DR81) and cationic dyes (BB41) from aqueous solution. RSM based on CCD was applied in order to evaluate the effect of main and interactive of influential variables on the adsorption of DR81, BB41 including pH, contact time, adsorbent dose and dye concentration and also to determine the optimum conditions of adsorption. The result of analyses of variance (ANOVA) demonstrated that the quadratic models developed for adsorption of both dye on NiFe2O4/RGO was statistically significant. Furthermore, the factors of pH, dye concentration and adsorbent dose, have the greatest effect on adsorption, respectively, while contact time have the lowest effect on adsorption of both dye. The process was optimized and maximum adsorption efficiency at optimum conditions was found to be 96.41% by model for DR81 at value of pH 3, contact time of 19.68 min, adsorbent dose of 0.02 g, and dye concentration of 40 mg/L, also in the case of BB41, the optimum conditions were obtained 97.87% at value of pH 9 contact time of 18.16 min, adsorbent dose of 0.02 g, and dye concentration of 40 mg/L. also the adsorption behavior of the DR81 and BB41 onto NiFe2O4/RGO was best described by the Langmuir and Freundlich isotherm, respectively.
Acknowledgments
This article was a part of master science dissertation of the first author that has been registered in Ethics Committee under ID no: IR.GUMS.REC.1397.053 and supported financially by a grant (No. 97021515) from the Guilan University of Medical Sciences, Rasht, Iran.
Compliance with ethical standards
Conflict of interest
The authors declare that they have no conflict of interest.
Footnotes
Publisher’s note
Springer Nature remains neutral with regard to jurisdictional claims in published maps and institutional affiliations.
References
- 1.Dalvand A, Nabizadeh R, Ganjali MR, Khoobi M, Nazmara S, Mahvi AH. Modeling of Reactive Blue 19 azo dye removal from colored textile wastewater using L-arginine-functionalized Fe3O4 nanoparticles: optimization, reusability, kinetic and equilibrium studies. J. Magn. Magn. Mater. 2016;404:179–189. doi: 10.1016/j.jmmm.2015.12.040. [DOI] [Google Scholar]
- 2.Almeida E, Corso C. Decolorization and removal of toxicity of textile azo dyes using fungal biomass pelletized. Int. J. Environ. Sci. Technol. 2019;16(3):1319–28.
- 3.Shirmardi M, Mesdaghinia A, Mahvi AH, Nasseri S, Nabizadeh R. Kinetics and equilibrium studies on adsorption of acid red 18 (Azo-Dye) using multiwall carbon nanotubes (MWCNTs) from aqueous solution. E-J. Chem. 2012;9(4):2371–2383. doi: 10.1155/2012/541909. [DOI] [Google Scholar]
- 4.Ashrafi S, Kamani H, Soheil Arezomand H, Yousefi N, Mahvi A. Optimization and modeling of process variables for adsorption of Basic Blue 41 on NaOH-modified rice husk using response surface methodology. Desalin. Water Treat. 2016;57(30):14051–14059. doi: 10.1080/19443994.2015.1060903. [DOI] [Google Scholar]
- 5.Mirzadeh S-S, Khezri S-M, Rezaei S, Forootanfar H, Mahvi AH, Faramarzi MA. Decolorization of two synthetic dyes using the purified laccase of Paraconiothyrium variabile immobilized on porous silica beads. J. Environ. Health Sci. Eng. 2014;12(1):6. doi: 10.1186/2052-336X-12-6. [DOI] [PMC free article] [PubMed] [Google Scholar]
- 6.Bazrafshan E, Alipour MR, Mahvi AH. Textile wastewater treatment by application of combined chemical coagulation, electrocoagulation, and adsorption processes. Desalin. Water Treat. 2016;57(20):9203–9215. doi: 10.1080/19443994.2015.1027960. [DOI] [Google Scholar]
- 7.Panahian Y, Arsalani N. Synthesis of hedgehoglike F-TiO2 (B)/CNT nanocomposites for sonophotocatalytic and photocatalytic degradation of malachite green (MG) under visible light: kinetic study. J. Phys. Chem. A. 2017;121(30):5614–5624. doi: 10.1021/acs.jpca.7b02580. [DOI] [PubMed] [Google Scholar]
- 8.Ashrafi M, Chamjangali MA, Bagherian G, Goudarzi N. Application of linear and non-linear methods for modeling removal efficiency of textile dyes from aqueous solutions using magnetic Fe3O4 impregnated onto walnut shell. Spectrochim. Acta A. 2017;171:268–279. doi: 10.1016/j.saa.2016.07.049. [DOI] [PubMed] [Google Scholar]
- 9.Dalvand A, Gholibegloo E, Ganjali MR, Golchinpoor N, Khazaei M, Kamani H, Hosseini SS, Mahvi AH. Comparison of Moringa stenopetala seed extract as a clean coagulant with Alum and Moringa stenopetala-Alum hybrid coagulant to remove direct dye from textile wastewater. Environ. Sci. Pollut. Res. 2016;23(16):16396–16405. doi: 10.1007/s11356-016-6708-z. [DOI] [PubMed] [Google Scholar]
- 10.Paździor K, Wrębiak J, Klepacz-Smółka A, Gmurek M, Bilińska L, Kos L, Sójka-Ledakowicz J, Ledakowicz S. Influence of ozonation and biodegradation on toxicity of industrial textile wastewater. J. Environ. Manage. 2017;195:166–173. doi: 10.1016/j.jenvman.2016.06.055. [DOI] [PubMed] [Google Scholar]
- 11.Ashrafi SD, Rezaei S, Forootanfar H, Mahvi AH, Faramarzi MA. The enzymatic decolorization and detoxification of synthetic dyes by the laccase from a soil-isolated ascomycete, Paraconiothyrium variabile. Int. Biodeter. Biodegr. 2013;85:173–181. doi: 10.1016/j.ibiod.2013.07.006. [DOI] [Google Scholar]
- 12.Mehrabian F, Kamani H, Safari GH, Asgari G, Ashrafi SD. Direct Blue 71 removal from aqueous solution by laccase-mediated system; A dataset. Data Br. 2018;19:437–443. doi: 10.1016/j.dib.2018.05.056. [DOI] [PMC free article] [PubMed] [Google Scholar]
- 13.Kamani H, Safari GH, Asgari G, Ashrafi SD. Data on modeling of enzymatic elimination of direct red 81 using response surface methodology. Data Br. 2018;18:80–86. doi: 10.1016/j.dib.2018.03.012. [DOI] [PMC free article] [PubMed] [Google Scholar]
- 14.Cechinel MAP, Mayer DA, Mazur LP, Silva LG, Girardi A, Vilar VJ, et al. Application of ecofriendly cation exchangers (Gracilaria caudata and Gracilaria cervicornis) for metal ions separation and recovery from a synthetic petrochemical wastewater: batch and fixed bed studies. J. Clean. Prod. 2018;172:1928–1945. doi: 10.1016/j.jclepro.2017.11.235. [DOI] [Google Scholar]
- 15.Zhou Z, Liu R. Fe3O4@ polydopamine and derived Fe3O4@ carbon core–shell nanoparticles: comparison in adsorption for cationic and anionic dyes. Colloids Surf. A Physicochem. Eng. Asp. 2017;522:260–265. doi: 10.1016/j.colsurfa.2017.02.063. [DOI] [Google Scholar]
- 16.Shirmardi M, Alavi N, Lima EC, Takdastan A, Mahvi AH, Babaei AA. Removal of atrazine as an organic micro-pollutant from aqueous solutions: a comparative study. Process Saf. Environ. Prot. 2016;103:23–35. doi: 10.1016/j.psep.2016.06.014. [DOI] [Google Scholar]
- 17.Wang W, Huang G, An C, Zhao S, Chen X, Zhang P. Adsorption of anionic azo dyes from aqueous solution on cationic gemini surfactant-modified flax shives: synchrotron infrared, optimization and modeling studies. J. Clean. Prod. 2018;172:1986–1997. doi: 10.1016/j.jclepro.2017.11.227. [DOI] [Google Scholar]
- 18.Menya E, Olupot P, Storz H, Lubwama M, Kiros Y. Production and performance of activated carbon from rice husks for removal of natural organic matter from water: a review. Chem. Eng. Res. Des. 2018;129:271–96.
- 19.Ashrafi S, Kamani H, Mahvi A. The optimization study of direct red 81 and methylene blue adsorption on NaOH-modified rice husk. Desalin. Water Treat. 2016;57(2):738–746. doi: 10.1080/19443994.2014.979329. [DOI] [Google Scholar]
- 20.Prola LD, Acayanka E, Lima EC, Umpierres CS, Vaghetti JC, Santos WO, et al. Comparison of Jatropha curcas shells in natural form and treated by non-thermal plasma as biosorbents for removal of Reactive Red 120 textile dye from aqueous solution. Ind. Crop Prod. 2013;46:328–340. doi: 10.1016/j.indcrop.2013.02.018. [DOI] [Google Scholar]
- 21.Brião G, Jahn S, Foletto E, Dotto G. Adsorption of crystal violet dye onto a mesoporous ZSM-5 zeolite synthetized using chitin as template. J. Colloid Interface Sci. 2017;508:313–322. doi: 10.1016/j.jcis.2017.08.070. [DOI] [PubMed] [Google Scholar]
- 22.Thue PS, Sophia AC, Lima EC, Wamba AG, de Alencar WS, dos Reis GS, et al. Synthesis and characterization of a novel organic-inorganic hybrid clay adsorbent for the removal of acid red 1 and acid green 25 from aqueous solutions. J. Clean. Prod. 2018;171:30–44. doi: 10.1016/j.jclepro.2017.09.278. [DOI] [Google Scholar]
- 23.Wang Y, Xie Y, Zhang Y, Tang S, Guo C, Wu J, et al. Anionic and cationic dyes adsorption on porous poly-melamine-formaldehyde polymer. Chem. Eng. Res. Des. 2016;114:258–267. doi: 10.1016/j.cherd.2016.08.027. [DOI] [Google Scholar]
- 24.Damiyine B, Guenbour A, Boussen R. Adsorption of rhodamine B dye onto expanded perlite from aqueous solution: kinetics, equilibrium and thermodynamics. J. Mater. Environ. Sci. 2017;8:345–355. [Google Scholar]
- 25.Magdy A, Fouad Y, Abdel-Aziz M, Konsowa A. Synthesis and characterization of Fe3O4/kaolin magnetic nanocomposite and its application in wastewater treatment. J. Ind. Eng. Chem. 2017;56:299–311. doi: 10.1016/j.jiec.2017.07.023. [DOI] [Google Scholar]
- 26.Li M-F, Liu Y-G, Liu S-B, Zeng G-M, Hu X-J, Tan X-f, et al. Performance of magnetic graphene oxide/diethylenetriaminepentaacetic acid nanocomposite for the tetracycline and ciprofloxacin adsorption in single and binary systems. J. Colloid Interface Sci. 2018;521:150–159. doi: 10.1016/j.jcis.2018.03.003. [DOI] [PubMed] [Google Scholar]
- 27.Badri MAS, Salleh MM, Noor NFM, Rahman MYA, Umar AA. Green synthesis of few-layered graphene from aqueous processed graphite exfoliation for graphene thin film preparation. Mater. Chem. Phys. 2017;193:212–219. doi: 10.1016/j.matchemphys.2017.02.029. [DOI] [Google Scholar]
- 28.Martin A, Escarpa A. Graphene: the cutting–edge interaction between chemistry and electrochemistry. TrAC Trends Anal. Chem. 2014;56:13–26. doi: 10.1016/j.trac.2013.12.008. [DOI] [Google Scholar]
- 29.Xie G, Xi P, Liu H, Chen F, Huang L, Shi Y, et al. A facile chemical method to produce superparamagnetic graphene oxide–Fe 3 O 4 hybrid composite and its application in the removal of dyes from aqueous solution. J. Mater. Chem. 2012;22(3):1033–1039. doi: 10.1039/C1JM13433G. [DOI] [Google Scholar]
- 30.Zhao G, Wen T, Chen C, Wang X. Synthesis of graphene-based nanomaterials and their application in energy-related and environmental-related areas. RSC Adv. 2012;2(25):9286–9303. doi: 10.1039/c2ra20990j. [DOI] [Google Scholar]
- 31.Sun H, Cao L, Lu L. Magnetite/reduced graphene oxide nanocomposites: one step solvothermal synthesis and use as a novel platform for removal of dye pollutants. Nano Res. 2011;4(6):550–562. doi: 10.1007/s12274-011-0111-3. [DOI] [Google Scholar]
- 32.Joung D, Singh V, Park S, Schulte A, Seal S, Khondaker SI. Anchoring ceria nanoparticles on reduced graphene oxide and their electronic transport properties. J. Phys. Chem. C. 2011;115(50):24494–24500. doi: 10.1021/jp206485v. [DOI] [Google Scholar]
- 33.Minitha C, Lalitha M, Jeyachandran Y, Senthilkumar L. Adsorption behaviour of reduced graphene oxide towards cationic and anionic dyes: co-action of electrostatic and π–π interactions. Mater. Chem. Phys. 2017;194:243–252. doi: 10.1016/j.matchemphys.2017.03.048. [DOI] [Google Scholar]
- 34.Liu M, Wen T, Wu X, Chen C, Hu J, Li J, Wang X. Synthesis of porous Fe 3 O 4 hollow microspheres/graphene oxide composite for Cr (VI) removal. Dalton Trans. 2013;42(41):14710–14717. doi: 10.1039/c3dt50955a. [DOI] [PubMed] [Google Scholar]
- 35.Wang H, Yuan X, Wu Y, Chen X, Leng L, Wang H, et al. Facile synthesis of polypyrrole decorated reduced graphene oxide–Fe3O4 magnetic composites and its application for the Cr (VI) removal. Chem. Eng. J. 2015;262:597–606. doi: 10.1016/j.cej.2014.10.020. [DOI] [Google Scholar]
- 36.Areerob Y, Cho JY, Jang WK, Oh W-C. Enhanced sonocatalytic degradation of organic dyes from aqueous solutions by novel synthesis of mesoporous Fe3O4-graphene/ZnO@ SiO2 nanocomposites. Ultrason. Sonochem. 2018;41:267–278. doi: 10.1016/j.ultsonch.2017.09.034. [DOI] [PubMed] [Google Scholar]
- 37.Tran T, Nguyen U, Nguyen T, Hoang B, Tran H, Nguyen N, et al., editors. Synthesis and magnetic properties of graphene oxide-decorated cobalt, manganese and nickel ferrite nanoparticles prepared by polymerized route. In Proceedings of the IOP Conference Series: Materials Science and Engineering, Nice, France, 22–24 February 2019; IOP Publishing: Bristol, UK, 2019; p. 12114.
- 38.Fu Y, Chen H, Sun X, Wang X. Graphene-supported nickel ferrite: a magnetically separable photocatalyst with high activity under visible light. AICHE J. 2012;58(11):3298–3305. doi: 10.1002/aic.13716. [DOI] [Google Scholar]
- 39.Shen J, Li X, Huang W, Li N, Ye M. One-pot polyelectrolyte assisted hydrothermal synthesis of NiFe 2 O 4-reduced graphene oxide nanocomposites with improved electrochemical and photocatalytic properties. J. Mater. Res. 2014;29(18):2211–2219. doi: 10.1557/jmr.2014.250. [DOI] [Google Scholar]
- 40.Ashrafi S, Nasseri S, Alimohammadi M, Mahvi A, Faramarzi M. Optimization of the enzymatic elimination of flumequine by laccase-mediated system using response surface methodology. Desalin. Water Treat. 2016;57(31):14478–14487. doi: 10.1080/19443994.2015.1063462. [DOI] [Google Scholar]
- 41.Ashrafi SD, Kamani H, Jaafari J, Mahvi AH. Experimental design and response surface modeling for optimization of fluoroquinolone removal from aqueous solution by NaOH-modified rice husk. Desalin. Water Treat. 2016;57(35):16456–16465. doi: 10.1080/19443994.2015.1080188. [DOI] [Google Scholar]
- 42.Mourabet M, El Rhilassi A, El Boujaady H, Bennani-Ziatni M, El Hamri R, Taitai A. Removal of fluoride from aqueous solution by adsorption on hydroxyapatite (HAp) using response surface methodology. J. Saudi Chem. Soc. 2015;19(6):603–615. doi: 10.1016/j.jscs.2012.03.003. [DOI] [Google Scholar]
- 43.Roosta M, Ghaedi M, Daneshfar A, Sahraei R. Experimental design based response surface methodology optimization of ultrasonic assisted adsorption of safaranin O by tin sulfide nanoparticle loaded on activated carbon. Spectrochim. Acta A. 2014;122:223–231. doi: 10.1016/j.saa.2013.10.116. [DOI] [PubMed] [Google Scholar]
- 44.Roosta M, Ghaedi M, Sahraei R, Purkait M. Ultrasonic assisted removal of sunset yellow from aqueous solution by zinc hydroxide nanoparticle loaded activated carbon: optimized experimental design. Mater. Sci. Eng. C. 2015;52:82–89. doi: 10.1016/j.msec.2015.03.036. [DOI] [PubMed] [Google Scholar]
- 45.Ghaedi M, Khafri HZ, Asfaram A, Goudarzi A. Response surface methodology approach for optimization of adsorption of Janus Green B from aqueous solution onto ZnO/Zn (OH) 2-NP-AC: kinetic and isotherm study. Spectrochim. Acta A. 2016;152:233–240. doi: 10.1016/j.saa.2015.06.128. [DOI] [PubMed] [Google Scholar]
- 46.Dezfuli AS, Ganjali MR, Jafari H, Faridbod F. Samaria/reduced graphene oxide nanocomposites; sonochemical synthesis and electrochemical evaluation. J. Mater. Sci. Mater. Electron. 2017;28(8):6176–6185. doi: 10.1007/s10854-016-6296-1. [DOI] [Google Scholar]
- 47.Marcano DC, Kosynkin DV, Berlin JM, Sinitskii A, Sun Z, Slesarev A, Alemany LB, Lu W, Tour JM. Improved synthesis of graphene oxide. ACS Nano. 2010;4(8):4806–4814. doi: 10.1021/nn1006368. [DOI] [PubMed] [Google Scholar]
- 48.Sagadevan S, Chowdhury ZZ, Rafique RF. Preparation and characterization of nickel ferrite nanoparticles via co-precipitation method. Mater. Res. 2018;21(2):e20160533.
- 49.Dalvand A, Khoobi M, Nabizadeh R, Ganjali MR, Gholibegloo E, Mahvi AH. Reactive dye adsorption from aqueous solution on HPEI-modified Fe3O4 nanoparticle as a superadsorbent: characterization, modeling, and optimization. J. Polym. Environ. 2018;26(8):3470–3483. doi: 10.1007/s10924-018-1231-6. [DOI] [Google Scholar]
- 50.Zarei H, Nasseri S, Nabizadeh R, Shemirani F, Dalvand A, Mahvi AH. Modeling of arsenic removal from aqueous solution by means of MWCNT/alumina nanocomposite. Desalin. Water Treat. 2017;67:196–205. doi: 10.5004/dwt.2017.20402. [DOI] [Google Scholar]
- 51.Shirmardi M, Mahvi AH, Hashemzadeh B, Naeimabadi A, Hassani G, Niri MV. The adsorption of malachite green (MG) as a cationic dye onto functionalized multi walled carbon nanotubes. Korean J. Chem. Eng. 2013;30(8):1603–1608. doi: 10.1007/s11814-013-0080-1. [DOI] [Google Scholar]