

Abstract
Intrathoracic pressure influences cardiac output and may affect cerebral blood flow (CBF). We aimed to quantify the cerebral hemodynamic response to intrathoracic pressure reduction in patients with acute ischemic stroke using a noninvasive respiratory impedance (RI) device. We assessed low-level (6 cm H2O) and high-level (12 cm H2O) RI in 17 spontaneously breathing patients within 72 h of anterior circulation acute ischemic stroke. Average age was 65 years, and 35% were female. Frontal lobe tissue perfusion and middle cerebral artery velocity (MCAv) were continuously monitored with optical diffuse correlation spectroscopy (DCS) and transcranial Doppler ultrasound, respectively. High-level RI resulted in a 7% increase in MCAv (p = 0.004). MCAv varied across all studied levels (baseline vs low-level vs high-level, p = 0.006), with a significant test of trend (p = 0.002). Changes were not seen in DCS measured tissue perfusion by nonparametric pairwise comparison. Mixed effects regression analysis identified a small increase in both MCAv (low-level RI: β 2.1, p < 0.001; high-level RI: β 5.0, p < 0.001) and tissue-level flow (low-level RI: β 5.4, p < 0.001; high-level RI: β 5.9, p < 0.001). There was a small increase in mean arterial pressure during low-level and high-level RI, 4% (p = 0.013) and 4% (p = 0.017), respectively. End-tidal CO2 remained stable throughout the protocol. RI was well tolerated. Manipulating intrathoracic pressure via noninvasive RI was safe and produced a small but measurable increase in cerebral perfusion in acute ischemic stroke patients. Future studies are warranted to assess whether RI is feasible and tolerable for prolonged use in hyperacute stroke management.
Electronic supplementary material
The online version of this article (10.1007/s13311-019-00744-1) contains supplementary material, which is available to authorized users.
Key Words: Cerebral blood flow, stroke, cerebral hemodynamics, diffuse correlation spectroscopy, intrathoracic pressure, near-infrared spectroscopy.
Introduction
Optimization of cerebral blood flow (CBF) is a cornerstone of the clinical management of acute ischemic stroke patients. In a variety of settings outside of stroke, it has been demonstrated that a decrease in intrathoracic pressure leads to an increase in CBF [1–5]. Mechanistically, this is likely caused by an increase in systemic venous return [6, 7], which increases cardiac output [7, 8] and blood pressure [2, 4, 8]. In healthy volunteers, we recently identified a small increase in cerebral perfusion during noninvasive reduction in intrathoracic pressure [4]. Ischemic stroke is the consequence of regional reduction in CBF, so a maneuver that augments CBF holds potential therapeutic value.
Intrathoracic pressure can be manipulated with the use of a noninvasive respiratory device incorporating a one-way valve. Air flow is restricted only during the inspiratory component of the respiratory cycle, referred to as respiratory impedance (RI). RI leads to augmentation of the inspiratory effort, which in turn leads to greater negative intrathoracic pressure to overcome the impedance. This respiratory maneuver is used for respiratory muscle training, but data pertaining to its effect on cerebral perfusion in humans is limited. In the context of orthostatic hypotension, RI increases middle cerebral artery velocity (MCAv) and reduces symptoms of orthostasis [9].
Transcranial Doppler ultrasonography (TCD) provides a measure of flow velocity through proximal intracranial vessels, but does not directly assess tissue-level perfusion. Diffuse correlation spectroscopy (DCS) is an optical technique that uses transcranial near-infrared light to measure deep tissue-level CBF at the bedside. This technique and underlying theory have been reviewed in detail [10–12]. Light in the near-infrared range (650–950 nm) is heavily scattered, yet experiences minimal absorption in tissue, permitting measurement of organs centimeters under the skin. Temporal fluctuations of the scattered light reflect changes in red blood cell concentration and movement (i.e., flow) [13]. The DCS signal is ultimately a weighted average of flow through arterioles, capillaries, and venules. The signal is more strongly weighted to arterioles due to higher blood cell velocity in these vessels [14, 15].
DCS holds promise for monitoring cerebral hemodynamics [14, 16–18] and has been validated against other measures of CBF such as ASL-MRI [19], Xenon CT [20], TCD [21], phase-encoded velocity mapping MRI [22], and fluorescent microspheres [23]. This technology has been used to study acute stroke physiology and the hemodynamic response of bedside interventions, including thrombolysis and mechanical thrombectomy [24–27]. In the current study, we use both DCS and TCD to measure changes in cerebral hemodynamics that occur during low-level and high-level RI in acute ischemic stroke patients.
Methods
Subjects
We prospectively recruited 20 acute ischemic stroke patients at the Hospital of the University of Pennsylvania between September 2016 and March 2017. Subjects were eligible for the study if they were over 18 years of age with neuroimaging confirming acute ischemic stroke affecting the ACA or MCA territory. Enrollment occurred within 72 h of stroke onset. Patients were excluded if any of the following were present: history of prior stroke or transient ischemic attack, congestive heart failure, chronic obstructive pulmonary disease, brain tumor, prior neurosurgical procedure, or active pregnancy. The DCS data from 3 subjects had a signal-to-noise ratio that precluded analysis, leaving 17 subjects in the final analysis. The protocol was approved by the University of Pennsylvania institutional review board. All study procedures were in accordance with the ethical standards of Helsinki Declaration. Written informed consent was signed by each participant prior to enrollment in the experimental protocol. The study was registered with clinicaltrials.gov (Unique Identifier: NCT03476954).
CBF Monitoring
DCS provides a transcranial measurement of relative CBF. Briefly, the temporal fluctuations of near-infrared light scattered by moving red blood cells in tissue are detected. These fluctuations are quantified by the light intensity temporal autocorrelation, which can be fitted to a semi-infinite model of the head to obtain changes in CBF [26]. Our custom instrument employs a long-coherence-length laser operating at 785 nm and 4 single-photon counting avalanche photodiode detectors for each hemisphere (i.e., a total of 2 lasers and 8 detectors). Optical fibers were used to couple sources and detectors to the head via 2 cm × 5 cm rubber optical probes that were placed bilaterally at the temporal margin of the forehead, superior to the frontal sinuses; this configuration enabled measurement of cortical parenchyma in the proximity of the border zone of the anterior cerebral artery (ACA) and middle cerebral artery (MCA). With a light source and detector separation of 2.5 cm, DCS is sensitive to cortical blood flow changes [11, 14]. An elastic headband was placed over the optical probes to maintain secure contact during the course of the protocol (Fig. 1). Data were collected from both hemispheres at a sampling frequency of 20 Hz [28]. In order to minimize spurious motion-induced signal fluctuations and allow for stabilization of the signal after each transition, the mean CBF was calculated for each segment of the protocol, excluding the 10 s preceding and 20 s following each RI transition.
Fig. 1.

Protocol setup: a Transcutaneous cortical cerebral blood flow monitoring by diffuse correlation spectroscopy (DCS) and middle cerebral artery insonation by transcranial Doppler ultrasonography (TCD). b An example of an individual with all monitoring in place, prepared for the experimental protocol
Blood Flow Velocity Monitoring
Velocity within the middle cerebral arteries was assessed using a Compumetics DWL TCD System (Compumetics Ltd.; Singen, Germany). Probes were secured using a DiaMon® adjustable headframe. The MCA trunk was insonated via transtemporal windows at a depth of 40–65 mm. MCAv waveforms were sampled at a rate of 20 Hz, time-synchronized and recorded on the same computer used to collect the DCS measured CBF. Average values were calculated for each segment of the protocol, excluding 10 s preceding and 20 s following each RI transition.
Cardiopulmonary Monitoring
A Finometer® Pro (Finapres Medical Systems; Arnhem, Netherlands) was placed on the wrist and third digit of either hand and provided continuous measurement of mean arterial pressure (MAP), systolic blood pressure, heart rate (HR), and cardiac output (CO). A transcutaneous pulse oximeter was placed on the second digit of the right hand for continuous measurement of oxygen saturation. The RI device was coupled with a sensor that provided continuous measurements of both end-tidal CO2 and respiratory rate. A pressure sensor was fixed inside the face-mask to monitor the change in pressure that occurred during RI, as a surrogate for the changes in intrathoracic pressure. All physiological waveforms were digitized, time-synchronized, and recorded on the same computer used to collect the DCS measured CBF, at a sampling frequency of 20 Hz. Average values were calculated for each segment of the protocol after excluding 10 s preceding and 20 s following each RI transition.
Respiratory Impedance Protocol
The Philips Inspiratory Muscle Trainer (IMT; Philips Respironics Andover, MA 01810) was utilized to noninvasively augment RI. The device has a one-way, spring-loaded valve, which provides an adjustable resistance during inspiration only. No resistance is imposed during expiration. When the device is in place, inspiratory effort must increase in order to generate sufficient negative intrathoracic pressure to overcome the selected resistance. Two discrete levels of resistance were tested (6 cm H2O and 12 cm H2O) in a prespecified random order for each subject.
Subjects were positioned in a hospital bed, with the head-of-bed at 45°. The optical device was placed on the forehead at least 5 min prior to protocol initiation to ensure signal stability, after which baseline hemodynamic data were collected for 5 min, while the subject was breathing through a respiratory face-mask (King Mask®, Ambu Inc.) providing no resistance. The IMT was then mounted to the back of the respiratory mask for a 5-min RI segment, during which the subject was instructed to breathe comfortably. After 5 min of RI, the IMT was removed from the mask for 5 min. This 10-min cycle was repeated for the other level of resistance. Patients were blinded to the level of resistance. At the completion of the study protocol, subjects were asked if they experienced shortness of breath, chest pain, fatigue, and lightheadedness.
Statistical Analyses
All data processing was performed while blinded to the level of RI. Mean CBF and MCAv values for each RI segment were compared to the preceding 5 min of normal breathing. Pairwise comparisons were completed using the Wilcoxon signed ranks test. Kruskal–Wallis test and nonparametric test of trend were used to compare perfusion measures across each protocol segment (baseline vs low-level vs high-level). Additionally, mixed effects linear regression was employed to better quantify and model the relationship between cerebral hemodynamics and RI, using a maximum likelihood to model changes across levels of RI. Levels of RI were considered categorical, models incorporated a random slope, and the covariance was modeled as unstructured. This approach was used in prior studies using DCS, including a study of RI in healthy volunteers [4, 24]. End-tidal CO2 was included in the model in order to account for possible device-related effects, which may influence perfusion, independent of the proposed mechanism. Because patients may not respond homogeneously to RI, a Wald test was used to determine if individual variability was present in the TCD and DCS response to RI.
The sample size was derived from prior TCD data in healthy human subjects [2], from which we estimated a 10% mean increase in CBF associated with RI (standard deviation 10%). Setting power to 0.80 and significance to 0.05, 16 subjects would be sufficient to demonstrate a difference in CBF.
Results
The study enrolled 20 patients with acute ischemic stroke affecting the ACA or MCA, within 72 h of symptom onset. Patient demographics and stroke characteristics can be found in Table 1. DCS–CBF data was technically inadequate in 3 subjects because the signal-to-noise ratio was too low to allow for reliable analysis, and these subjects were therefore excluded from the primary analysis. Figure 2 provides an example of the raw time series data acquired from 1 patient. Figure 3 depicts the relationship between cerebral perfusion and RI averaged across the 17 patients included in the primary analysis. There was a 7% median increase in TCD measured MCAv at the high-level resistance (p = 0.004), but a smaller (4%) nonsignificant change was noted at the low-level resistance (p = 0.19). Pairwise testing was similarly performed for DCS measured tissue-level CBF and identified no significant change in flow at the low-level (p = 0.19) or high-level resistance (p = 0.14). When all levels of RI were compared by Kruskal–Wallis test (baseline vs low-level vs high-level), TCD was significantly different across levels (p = 0.006), but no difference was seen with DCS (p = 0.39). Nonparametric test of trend [29] confirmed that the differences seen by TCD were ordered (p = 0.002). Finally, mixed effects linear regression was employed, comparing baseline values to each level of RI independently, adjusting for end-tidal CO2. Regression results indicate a small increase in both MCAv and microvascular CBF with low-level and high-level RI (Table 2). A Wald test identified significant interindividual variability with respect to both TCD and DCS, p < 0.005 in both cases.
Table 1.
Patient demographic and clinical characteristics
| Demographics and medical history | |
| Age, years | 65.1 (12.3) |
| Gender, female | 40% |
| Race, Caucasian | 70% |
| HTN | 75% |
| DM | 35% |
| HLD | 75% |
| CAD | 15% |
| Asthma | 15% |
| Active smoking | 5% |
| Stroke and clinical characteristics | |
| Admission NIHSS | 5.9 (5.7) |
| Stroke lateralization, % left | 45% |
| Infarct volume, cc | 8.0 (11.9) |
| Vascular distribution of infarct | |
| MCA | 90% |
| ACA | 10% |
| Distance from DCS probe to stroke, cm | 6.3 (2.5) |
| Stroke mechanism | |
| Large vessel | 25% |
| Small vessel | 5% |
| Cardioembolism | 30% |
| Cryptogenic | 25% |
| Other | 15% |
| Ejection fraction | 59.7 (10.8) |
| Hgb (g/dL) | 12.1 (2.2) |
Continuous variables are reported as mean (SD)
Categorical variables are reported as percentage
HTN = hypertension; DM = diabetes mellitus; HLD = hyperlipidemia; CAD = coronary artery disease; NIHSS = National Institutes of Health Stroke Scale; MCA = middle cerebral artery; ACA = anterior cerebral artery; DCS = diffuse correlation spectroscopy; Hgb = hemoglobin
Fig. 2.

Cerebral perfusion and respiratory impedance time series: An example of hemodynamic changes throughout the protocol for 1 subject. Changes in mask–pressure reflect relative changes in intrathoracic pressure. Cerebral perfusion is assessed by TCD (MCA–velocity) and DCS (cortical CBF). a Complete protocol, b 25 s around the start of respiratory impedance. Note that both TCD and DCS track beat-to-beat changes, which are temporally smoothed with a rolling average. TCD indicates transcranial Doppler. MCA indicates middle cerebral artery. DCS indicates diffuse correlation spectroscopy. CBF indicates cerebral blood flow
Fig. 3.
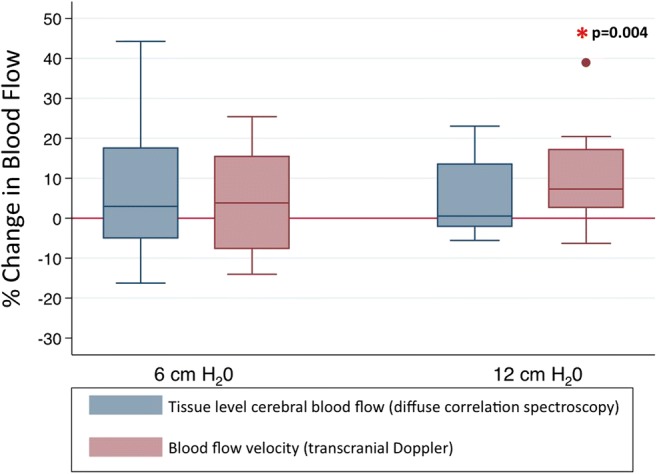
Cerebral hemodynamic changes during respiratory impedance. Values represent median and interquartile ranges across the cohort at 2 different levels of respiratory impedance.
Table 2.
Mixed effects regression
| Level of resistance | Β | Standard error | 95% CI | p value |
|---|---|---|---|---|
| TCD | ||||
| cm H2O | 2.1 | 0.5 | 1.1–3.0 | < 0.001 |
| cm H2O | 5.0 | 0.5 | 4.1–6.0 | < 0.001 |
| DCS | ||||
| cm H2O | 5.4 | 0.4 | 4.6–6.2 | < 0.001 |
| 12 cm H2O | 5.9 | 0.4 | 5.1–6.6 | < 0.001 |
TCD and DCS values serve are dependent variables in the respective models. Level of resistance is the independent variable. Both models adjusted for end-tidal CO2
Table 3 depicts all cardiopulmonary data, including MAP, HR, CO, and end-tidal CO2 across the range of RI. Similar to the change in MCAv, a small increase in MAP was noted during RI. Importantly, when averaged over the cohort, there were no significant changes in end-tidal CO2. Only 1 patient elected to stop, which occurred during the first RI segment 30-s prior to completion due to transient shortness of breath and fatigue, but after a short break the patient went on to complete the remainder of the protocol without issue. All other subjects completed the protocol in its entirety, without interruption. Four subjects retrospectively described some degree of fatigue or shortness of breath during the protocol, and 2 reported claustrophobia associated with the face-mask. These retrospectively reported symptoms did not interfere with protocol completion and resolved at the completion of the study. There were no documented episodes of hypoxia, hypoventilation, or hyperventilation.
Table 3.
Hemodynamic changes with respiratory impedance
| 6 cm H2O | p value | 12 cm H2O | p value | |
|---|---|---|---|---|
| CBF, blood flow index |
+ 2.9% (− 5.0 to + 17.6) |
0.19 |
+ 0.5% (− 2.1 to + 13.5) |
0.14 |
| MCAv, cm/s |
+ 2.3 cm/s (3.8%) (− 4.6 to + 9.4) |
0.19 |
+ 4.8 cm/s (7.3%) (+ 2.6 to + 17.1) |
0.004 |
| MAP |
+ 4.8 mmHg (4.1%) (+ 1.2 to + 10.4) |
0.013 |
+ 5.1 mmHg (4.4%) (+ 1.0 to + 7.8) |
0.017 |
| HR |
+ 1.6 beats/min (1.9%) (+ 0.25 to + 3.0) |
0.06 |
+ 1.9 beats/min (2.2%) (− 0.41 to + 3.5) |
0.021 |
| End-tidal CO2 |
+ 0.036 mmHg (0.1%) (− 1.7 to + 0.57) |
0.69 |
− 0.71 mmHg (2.0%) (− 3.2 to + 1.2) |
0.44 |
| Cardiac output |
+ 0.065 L/min (1.0%) (− .13 to + 0.29) |
0.22 |
+ 0.31 L/min (4.1%) (− 0.22 to + 0.52) |
0.22 |
All reported values are changes in median (IQR). Change in median is reported as absolute value and % relative to baseline period immediately preceding RI. Blood flow index as measured by DCS is only reported as % change. p values were calculated by Wilcoxon signed ranks tests, in comparison to baseline values
Discussion
Short-term exposure to noninvasive RI was well tolerated by acute stroke patients and resulted in a small increase in MCAv measured by TCD, with a dose-dependent effect of RI on TCD in regression analysis. Optically measured microvascular CBF remained unchanged in the nonparametric pairwise comparison, but a small increase was identified in the regression analysis. Because end-tidal CO2 may influence CBF through its vasomotor effects [30, 31], respiratory rate and end-tidal CO2 were continuously monitored in all patients. While end-tidal CO2 remained unchanged during RI, adjustments were made in the regression analysis to ensure that the observed hemodynamic effects were not a surrogate of hyper/hypocapnea. In the pairwise comparison, an increase in TCD measured MCAv was only identified during high-level RI. This suggests that there may be a threshold of RI required to impact cerebral perfusion in a potentially meaningful way. While no difference was seen with DCS in pairwise comparison, the regression analysis indicated an effect of treatment at both low- and high-level RI. This analysis accounts for the repeated nature of the data collected from each subject, lending power to this analysis. In that context, it is important to distinguish between statistical and clinical significance. It is unknown, though probably unlikely that this degree of perfusion augmentation would have a meaningful clinical impact.
While there is a small discrepancy seen in the results from TCD and DCS, this should be interpreted with caution in this small sample size, and the difference was far less evident in the regression analysis. In a recent study of healthy volunteers, TCD changes exceeded DCS [4], and in that scenario, it was hypothesized that TCD may identify trunk artery flow changes which mirror blood pressure, but intact cerebrovascular autoregulation at the arteriolar level may dampen the tissue-level effect [32, 33]. A more robust tissue-level effect was anticipated in the context of acute stroke, during which autoregulation may be impaired [34]. However, autoregulatory function was not directly assessed in this study, so we could not determine if this was associated with response to RI. Additionally, given the need to avoid hair, which interferes with DCS measurement, only the frontal poles were monitored in all subjects, while strokes occurred throughout the hemisphere. Only 2 patients had ACA cortically based strokes, but their response to RI was not notably different than the cohort as a whole. As a result, in most cases, DCS was monitoring tissue-level flow remote from the infarct bed, though distance between the optical probe and infarct perimeter did not seem to impact the response to RI.
Our finding of a modest impact of RI on cerebral perfusion is concordant with the mixed results seen in patients with orthostatic hypotension. One study of human subjects a 10% increase in MCAv was observed with a similar degree of resistance used in the low-level of the current study [2], and another study reported that RI alleviated symptoms during orthostatic maneuvers, but yielded no objective effect on TCD measured MCAv [9].
Mechanistically, RI decreases intrathoracic pressure, which in turn augments venous return and ultimately cardiac filling pressures [6, 7]. In the context of volume depletion and reasonable cardiac function, an increase in preload results in an increase in cardiac output [7, 8]. This correlates with an increase in vital organ and brain perfusion [3, 5, 35]. RI may also reduce intracranial pressure, likely through reduction in the intracranial venous volume, which further increases cerebral perfusion pressure (cerebral perfusion pressure = mean arterial pressure − intracranial pressure) [1, 35]. The hemodynamic effects of intrathoracic pressure are most relevant during hypovolemia [36, 37]. Many patients with acute stroke initially present to the hospital in a state of hypovolemia, which is associated with poor outcome [38, 39]. Volume repletion is a key component of early clinical management in stroke patients, and most patients completed the current study protocol more than 24 h following hospital admission, making it unlikely that any patients were volume depleted at the time of protocol completion. This may explain the relatively modest effect seen in this study and RI may be more impactful in the hyperacute phase of stroke care. The sustainability of the hemodynamic effect is also unclear, and more prolonged exposure would be necessary to explore potential compensation or temporal evolution.
Fluctuations in end-tidal CO2 are expected to impact CBF and potentially confound our results [26, 30, 31, 40]. As such, we monitored end-tidal CO2 continuously during the study though it remained stable throughout and adjustment in the regression model did not influence the effect of RI on cerebral perfusion. RI imposes an increased work of breathing, [41] so over a longer period of time, respiratory fatigue may be a reasonable concern. With the brief exposure in the current study, several patients reported some degree of fatigue. While only 1 patient stopped the intervention 30-s prior to completion, several indicated that a longer intervention may not be tenable depending on the level of RI. Prior studies have exposed healthy subjects to periods of RI greater than 10 min, with good tolerability [9, 42]. If RI is to be of any clinical utility for stroke patients, a more sustainable intervention is critical, in which case lower levels of RI or thoracic devices that off-load the work of breathing may be worthy of future investigation. Alternatively, manipulation of intrathoracic pressure among mechanically ventilated stroke patients may be more tenable, [3, 35, 43, 44] and this approach has been effective in animal models.
The current study has several limitations. Firstly, in the primary signed ranks analysis the sample size was inadequate to identify small changes in perfusion as may have been seen during low-level RI, although it is unlikely that such small changes would be clinically meaningful. As noted above, patient volume status is likely a significant confounder, and unfortunately was not objectively assessed in each patient. Tissue-level monitoring was restricted to the anterior frontal lobes, leaving other territories and deeper structures unmeasured. Moreover, by using a simplistic semi-infinite model for DCS, our measurements may be partially contaminated by scalp blood flow because light traverses extracerebral tissue before reaching the brain. Flow through brain tissue far exceeds that of the scalp, so CBF contributes the majority of the DCS signal [14, 45]. Relative to more commonly used spectroscopic techniques such as near-infrared spectroscopy (NIRS), the DCS signal is weighted towards relatively long photon paths, further minimizing the extracerebral contribution to the DCS signal [15]. Depending on the size and location of infarction, regional differences in CBF based on size and location of infarct are worth considering. Unfortunately, we are unable to investigate these differences given our relatively small sample size and only 2 patients had infarction of the ACA territory. Despite finding a statistically significant difference in TCD measured MCAv at the high-level of RI, the lack of significant difference seen with DCS could be related to inadequate power. Little was known about the expected DCS response, so data collected here facilitates a post hoc sample size analysis. The mean DCS change with high-level RI was 5% with standard deviation of 10% (as compared to the reported 1% change in median DCS value). The current sample size only provides 54% power, setting α to 0.05. To achieve 80% power, a sample size of 32 would be required. Changes in MCAv measured by TCD are expected to correlate with CBF assuming the MCA trunk diameter remains constant, but this assumption falters in the context of CO2 fluctuation [46, 47] and mild exercise [48]. The effect of RI on trunk vessel caliber remains unknown, so it is important to acknowledge that the 2 techniques measure different components of the vascular system. The relationship between TCD and DCS in the current study might be further attenuated because the tissue monitored by DCS may have contributions from both MCA and ACA, while TCD only measured the MCA trunk.
In conclusion, manipulating intrathoracic pressure via short term use of noninvasive RI was well tolerated by acute stroke patients and resulted in a small increase in MCAv and tissue-level CBF. Future study is warranted to explore the effect of RI during hyperacute stroke care and to assess the tolerability of prolonged exposure.
Electronic Supplementary Material
(PDF 1224 kb)
Acknowledgments
AGY and JAD are inventors on USA Patent #8082015, “Optical measurement of tissue blood flow hemodynamics and oxygenation”. Several authors (AGY, JAD, WBB, DRB, RCM) are also inventors on pending patent applications for associated DCS technologies. No compensation for this intellectual property has been received by any author or the University of Pennsylvania.
Required Author Forms
Disclosure forms provided by the authors are available with the online version of this article.
Funding
This work was supported by the following funding sources:
NIH: R01-NS060653 (AGY), P41-EB015893 (AGY and JAD), P30-NS045839 (JAD), R25-N2065745 (CGF)
The Sao Paulo Research Foundation: 2013/07559-3 (RCM), 2016/13139-5 (RMF)
Footnotes
Publisher’s Note
Springer Nature remains neutral with regard to jurisdictional claims in published maps and institutional affiliations.
References
- 1.Kiehna EN, Huffmyer JL, Thiele RH, Scalzo DC, Nemergut EC. Use of the intrathoracic pressure regulator to lower intracranial pressure in patients with altered intracranial elastance: a pilot study. J Neurosurg. 2013;119(3):756–9. doi: 10.3171/2013.4.JNS122489. [DOI] [PubMed] [Google Scholar]
- 2.Cooke WH, Lurie KG, Rohrer MJ, Convertino VA. Human autonomic and cerebrovascular responses to inspiratory impedance. J Trauma. 2006;60(6):1275–83. doi: 10.1097/01.ta.0000221348.82115.a2. [DOI] [PubMed] [Google Scholar]
- 3.Yannopoulos D, Metzger A, McKnite S, et al. Intrathoracic pressure regulation improves vital organ perfusion pressures in normovolemic and hypovolemic pigs. Resuscitation. 2006;70(3):445–53. doi: 10.1016/j.resuscitation.2006.02.005. [DOI] [PubMed] [Google Scholar]
- 4.Favilla CG, Parthasarathy AB, Detre JA, et al. Non-Invasive Respiratory Impedance Enhances Cerebral Perfusion in Healthy Adults. Front Neurol. 2017;8:45. doi: 10.3389/fneur.2017.00045. [DOI] [PMC free article] [PubMed] [Google Scholar]
- 5.Lurie KG, Coffeen P, Shultz J, McKnite S, Detloff B, Mulligan K. Improving active compression-decompression cardiopulmonary resuscitation with an inspiratory impedance valve. Circulation. 1995;91(6):1629–32. doi: 10.1161/01.cir.91.6.1629. [DOI] [PubMed] [Google Scholar]
- 6.Lurie KG, Zielinski T, Voelckel W, McKnite S, Plaisance P. Augmentation of ventricular preload during treatment of cardiovascular collapse and cardiac arrest. Crit Care Med. 2002;30(4 Suppl):S162–5. doi: 10.1097/00003246-200204001-00009. [DOI] [PubMed] [Google Scholar]
- 7.Lurie KG, Zielinski TM, McKnite SH, et al. Treatment of hypotension in pigs with an inspiratory impedance threshold device: a feasibility study. Crit Care Med. 2004;32(7):1555–62. doi: 10.1097/01.ccm.0000131207.29081.a2. [DOI] [PubMed] [Google Scholar]
- 8.Convertino VA, Ryan KL, Rickards CA, et al. Inspiratory resistance maintains arterial pressure during central hypovolemia: implications for treatment of patients with severe hemorrhage. Crit Care Med. 2007;35(4):1145–52. doi: 10.1097/01.CCM.0000259464.83188.2C. [DOI] [PubMed] [Google Scholar]
- 9.Rickards CA, Cohen KD, Bergeron LL, et al. Inspiratory resistance, cerebral blood flow velocity, and symptoms of acute hypotension. Aviat Space Environ Med. 2008;79(6):557–64. doi: 10.3357/asem.2149.2008. [DOI] [PubMed] [Google Scholar]
- 10.Durduran T, Yu G, Burnett MG, et al. Diffuse optical measurement of blood flow, blood oxygenation, and metabolism in a human brain during sensorimotor cortex activation. Opt Lett. 2004;29(15):1766–8. doi: 10.1364/ol.29.001766. [DOI] [PubMed] [Google Scholar]
- 11.Mesquita RC, Durduran T, Yu G, et al. Direct measurement of tissue blood flow and metabolism with diffuse optics. Philos Trans A Math Phys Eng Sci. 2011;369(1955):4390–406. doi: 10.1098/rsta.2011.0232. [DOI] [PMC free article] [PubMed] [Google Scholar]
- 12.Durduran T, Yodh AG. Diffuse correlation spectroscopy for non-invasive, micro-vascular cerebral blood flow measurement. Neuroimage. 2014;85(Pt 1):51–63. doi: 10.1016/j.neuroimage.2013.06.017. [DOI] [PMC free article] [PubMed] [Google Scholar]
- 13.Buckley EM, Parthasarathy AB, Grant PE, Yodh AG, Franceschini MA. Diffuse correlation spectroscopy for measurement of cerebral blood flow: future prospects. Neurophotonics 2014;1(1). [DOI] [PMC free article] [PubMed]
- 14.Selb J, Boas DA, Chan ST, Evans KC, Buckley EM, Carp SA. Sensitivity of near-infrared spectroscopy and diffuse correlation spectroscopy to brain hemodynamics: simulations and experimental findings during hypercapnia. Neurophotonics 2014;1(1). [DOI] [PMC free article] [PubMed]
- 15.Boas DA, Sakadzic S, Selb J, Farzam P, Franceschini MA, Carp SA. Establishing the diffuse correlation spectroscopy signal relationship with blood flow. Neurophotonics. 2016;3(3):031412. doi: 10.1117/1.NPh.3.3.031412. [DOI] [PMC free article] [PubMed] [Google Scholar]
- 16.Mesquita RC, Faseyitan OK, Turkeltaub PE, et al. Blood flow and oxygenation changes due to low-frequency repetitive transcranial magnetic stimulation of the cerebral cortex. J Biomed Opt. 2013;18(6):67006. doi: 10.1117/1.JBO.18.6.067006. [DOI] [PMC free article] [PubMed] [Google Scholar]
- 17.Jaillon F, Li J, Dietsche G, Elbert T, Gisler T. Activity of the human visual cortex measured non-invasively by diffusing-wave spectroscopy. Opt Express. 2007;15(11):6643–50. doi: 10.1364/oe.15.006643. [DOI] [PubMed] [Google Scholar]
- 18.Baker WB, Parthasarathy AB, Gannon KP, et al. Noninvasive optical monitoring of critical closing pressure and arteriole compliance in human subjects. J Cereb Blood Flow Metab. 2017;37(8):2691–705. doi: 10.1177/0271678X17709166. [DOI] [PMC free article] [PubMed] [Google Scholar]
- 19.Yu G, Floyd TF, Durduran T, et al. Validation of diffuse correlation spectroscopy for muscle blood flow with concurrent arterial spin labeled perfusion MRI. Opt Express. 2007;15(3):1064–75. doi: 10.1364/oe.15.001064. [DOI] [PubMed] [Google Scholar]
- 20.Kim MN, Durduran T, Frangos S, et al. Noninvasive measurement of cerebral blood flow and blood oxygenation using near-infrared and diffuse correlation spectroscopies in critically brain-injured adults. Neurocrit Care. 2010;12(2):173–80. doi: 10.1007/s12028-009-9305-x. [DOI] [PMC free article] [PubMed] [Google Scholar]
- 21.Zirak P, Delgado-Mederos R, Marti-Fabregas J, Durduran T. Effects of acetazolamide on the micro- and macro-vascular cerebral hemodynamics: a diffuse optical and transcranial doppler ultrasound study. Biomed Opt Express. 2010;1(5):1443–59. doi: 10.1364/BOE.1.001443. [DOI] [PMC free article] [PubMed] [Google Scholar]
- 22.Buckley EM, Hance D, Pawlowski T, et al. Validation of diffuse correlation spectroscopic measurement of cerebral blood flow using phase-encoded velocity mapping magnetic resonance imaging. J Biomed Opt. 2012;17(3):037007. doi: 10.1117/1.JBO.17.3.037007. [DOI] [PMC free article] [PubMed] [Google Scholar]
- 23.Zhou C, Eucker SA, Durduran T, et al. Diffuse optical monitoring of hemodynamic changes in piglet brain with closed head injury. J Biomed Opt. 2009;14(3):034015. doi: 10.1117/1.3146814. [DOI] [PMC free article] [PubMed] [Google Scholar]
- 24.Favilla CG, Mesquita RC, Mullen M, et al. Optical bedside monitoring of cerebral blood flow in acute ischemic stroke patients during head-of-bed manipulation. Stroke. 2014;45(5):1269–74. doi: 10.1161/STROKEAHA.113.004116. [DOI] [PMC free article] [PubMed] [Google Scholar]
- 25.Delgado-Mederos R, Gregori-Pla C, Zirak P, et al. Transcranial diffuse optical assessment of the microvascular reperfusion after thrombolysis for acute ischemic stroke. Biomed Opt Express. 2018;9(3):1262–71. doi: 10.1364/BOE.9.001262. [DOI] [PMC free article] [PubMed] [Google Scholar]
- 26.Durduran T, Zhou C, Edlow BL, et al. Transcranial optical monitoring of cerebrovascular hemodynamics in acute stroke patients. Opt Express. 2009;17(5):3884–902. doi: 10.1364/oe.17.003884. [DOI] [PMC free article] [PubMed] [Google Scholar]
- 27.Forti RM, Favilla CG, Cochran JM, et al. Transcranial Optical Monitoring of Cerebral Hemodynamics in Acute Stroke Patients during Mechanical Thrombectomy. J Stroke Cerebrovasc Dis 2019. [DOI] [PMC free article] [PubMed]
- 28.Wang D, Parthasarathy AB, Baker WB, et al. Fast blood flow monitoring in deep tissues with real-time software correlators. Biomed Opt Express. 2016;7(3):776–97. doi: 10.1364/BOE.7.000776. [DOI] [PMC free article] [PubMed] [Google Scholar]
- 29.Cuzick J. A Wilcoxon-type test for trend. Stat Med. 1985;4(1):87–90. doi: 10.1002/sim.4780040112. [DOI] [PubMed] [Google Scholar]
- 30.Markwalder TM, Grolimund P, Seiler RW, Roth F, Aaslid R. Dependency of blood flow velocity in the middle cerebral artery on end-tidal carbon dioxide partial pressure--a transcranial ultrasound Doppler study. J Cereb Blood Flow Metab. 1984;4(3):368–72. doi: 10.1038/jcbfm.1984.54. [DOI] [PubMed] [Google Scholar]
- 31.Huber P, Handa J. Effect of contrast material, hypercapnia, hyperventilation, hypertonic glucose and papaverine on the diameter of the cerebral arteries. Angiographic determination in man. Investig Radiol. 1967;2(1):17–32. doi: 10.1097/00004424-196701000-00016. [DOI] [PubMed] [Google Scholar]
- 32.Kontos HA, Wei EP, Navari RM, Levasseur JE, Rosenblum WI, Patterson JL., Jr Responses of cerebral arteries and arterioles to acute hypotension and hypertension. Am J Phys. 1978;234(4):H371–83. doi: 10.1152/ajpheart.1978.234.4.H371. [DOI] [PubMed] [Google Scholar]
- 33.Wei EP, Kontos HA. Responses of cerebral arterioles to increased venous pressure. Am J Phys. 1982;243(3):H442–7. doi: 10.1152/ajpheart.1982.243.3.H442. [DOI] [PubMed] [Google Scholar]
- 34.Dawson SL, Panerai RB, Potter JF. Serial changes in static and dynamic cerebral autoregulation after acute ischaemic stroke. Cerebrovasc Dis. 2003;16(1):69–75. doi: 10.1159/000070118. [DOI] [PubMed] [Google Scholar]
- 35.Yannopoulos D, McKnite SH, Metzger A, Lurie KG. Intrathoracic pressure regulation for intracranial pressure management in normovolemic and hypovolemic pigs. Crit Care Med. 2006;34(12 Suppl):S495–500. doi: 10.1097/01.CCM.0000246082.10422.7E. [DOI] [PubMed] [Google Scholar]
- 36.Wagner JG, Leatherman JW. Right ventricular end-diastolic volume as a predictor of the hemodynamic response to a fluid challenge. Chest. 1998;113(4):1048–54. doi: 10.1378/chest.113.4.1048. [DOI] [PubMed] [Google Scholar]
- 37.Reuse C, Vincent JL, Pinsky MR. Measurements of right ventricular volumes during fluid challenge. Chest. 1990;98(6):1450–4. doi: 10.1378/chest.98.6.1450. [DOI] [PubMed] [Google Scholar]
- 38.Schrock JW, Glasenapp M, Drogell K. Elevated blood urea nitrogen/creatinine ratio is associated with poor outcome in patients with ischemic stroke. Clin Neurol Neurosurg. 2012;114(7):881–4. doi: 10.1016/j.clineuro.2012.01.031. [DOI] [PubMed] [Google Scholar]
- 39.Bhalla A, Sankaralingam S, Dundas R, Swaminathan R, Wolfe CD, Rudd AG. Influence of raised plasma osmolality on clinical outcome after acute stroke. Stroke. 2000;31(9):2043–8. doi: 10.1161/01.str.31.9.2043. [DOI] [PubMed] [Google Scholar]
- 40.Busch DR, Lynch JM, Winters ME, et al. Cerebral Blood Flow Response to Hypercapnia in Children with Obstructive Sleep Apnea Syndrome. Sleep. 2016;39(1):209–16. doi: 10.5665/sleep.5350. [DOI] [PMC free article] [PubMed] [Google Scholar]
- 41.Idris AH, Convertino VA, Ratliff DA, et al. Imposed power of breathing associated with use of an impedance threshold device. Respir Care. 2007;52(2):177–83. [PubMed] [Google Scholar]
- 42.Convertino VA, Ratliff DA, Ryan KL, et al. Hemodynamics associated with breathing through an inspiratory impedance threshold device in human volunteers. Crit Care Med. 2004;32(9 Suppl):S381–6. doi: 10.1097/01.ccm.0000134348.69165.15. [DOI] [PubMed] [Google Scholar]
- 43.Metzger AK, Segal N, Olson DW, et al. Intrathoracic pressure regulation therapy applied to ventilated patients for treatment of compromised cerebral perfusion from brain injury. J Med Case Rep. 2018;12(1):178. doi: 10.1186/s13256-018-1720-1. [DOI] [PMC free article] [PubMed] [Google Scholar]
- 44.Metzger A, Rees J, Kwon Y, Matsuura T, McKnite S, Lurie KG. Intrathoracic Pressure Regulation Improves Cerebral Perfusion and Cerebral Blood Flow in a Porcine Model of Brain Injury. Shock. 2015;44(Suppl 1):96–102. doi: 10.1097/SHK.0000000000000314. [DOI] [PubMed] [Google Scholar]
- 45.Ohmae E, Ouchi Y, Oda M, et al. Cerebral hemodynasmics evaluation by near-infrared time-resolved spectroscopy: correlation with simultaneous positron emission tomography measurements. Neuroimage. 2006;29(3):697–705. doi: 10.1016/j.neuroimage.2005.08.008. [DOI] [PubMed] [Google Scholar]
- 46.Verbree J, Bronzwaer AS, Ghariq E, et al. Assessment of middle cerebral artery diameter during hypocapnia and hypercapnia in humans using ultra-high-field MRI. J Appl Physiol (1985) 2014;117(10):1084–9. doi: 10.1152/japplphysiol.00651.2014. [DOI] [PubMed] [Google Scholar]
- 47.Coverdale NS, Gati JS, Opalevych O, Perrotta A, Shoemaker JK. Cerebral blood flow velocity underestimates cerebral blood flow during modest hypercapnia and hypocapnia. J Appl Physiol (1985) 2014;117(10):1090–6. doi: 10.1152/japplphysiol.00285.2014. [DOI] [PubMed] [Google Scholar]
- 48.Verbree J, Bronzwaer A, van Buchem MA, Daemen M, van Lieshout JJ, van Osch M. Middle cerebral artery diameter changes during rhythmic handgrip exercise in humans. J Cereb Blood Flow Metab. 2017;37(8):2921–7. doi: 10.1177/0271678X16679419. [DOI] [PMC free article] [PubMed] [Google Scholar]
Associated Data
This section collects any data citations, data availability statements, or supplementary materials included in this article.
Supplementary Materials
(PDF 1224 kb)