

Abstract
High concentration benzene production in paper and painting industries is a restrictive problem in production line of companies. In this study, removal of high concentrated benzene produced in painting companies was investigated using a Plate Gliding Arc (PGA) reactor. Decomposition of methane and carbon dioxide as the most predominate byproducts of benzene decomposition was also studied using (PGA) reactor. The effect of several parameters such as input power, feed gas flow rate, type of carrier gas, and [CH4/CO2] flow ratio was studied by two series of experiments. The results show significant conversion (>70%) of high concentration benzene (74000ppm) without using any catalyst. Selectivity of CO2 and CO was 88% and 10% respectively showing complete oxidation of benzene. The maximum conversion of CH4 and CO2 reached 52% and 69%, respectively by using optimum ratio of 3:4. The main results of this study proved removal of high concentration benzene using a low-energy-density reactor. Furthermore, an optimum value for efficient conversion of methane and carbon dioxide was achieved and the energy density of the PGA reactor was evaluated, which shows a good promise for industrial applications.
Keywords: Volatile organic compounds, Greenhouse gases, Plate gliding arc plasma, High concentrated benzene removal, Methane and carbon dioxide decomposition
Introduction
Nowadays a major concern for humankind is the problems related to health and environment including industrialization of economies that lead to emission of various kinds of pollutions [1]. Both volatile organic compounds (VOC) and greenhouse gases produced in large amounts in recent years, are two common outlet gases of factories which have strong undesirable effects on our planet. [2, 3]. These compounds have many harmful effects on both human and environmental health [2, 4, 5]. Benzene is one of the most common VOCs in the outlet gas of factories due to its widespread usage in paper, painting, leather, wood composite products, and other industries. In particular factories, benzene is produced in large quantities and a dry scrubber is normally used to trap benzene. But, for flammable VOCs (like benzene), which cannot be trapped in an adsorbent medium, wet spray scrubbers are used [4]. In this method, thermal and chemical oxidation is used to eliminate VOCs from outlet gas. In some cases one of the major problems is high concentration VOC in wet scrubbers. Although, the outlet gas of these factories is diluted by high capacity air fans before reaching the environment,1 the concentration of benzene is more than OSHA standards. Moreover, chlorinated compounds are also produced in wet scrubbers [6].
Conventional pollution removal methods, including adsorption, incineration, membrane separation, bio reaction, and photo catalysis, which are used in the industry [7] exhibit some disadvantages such as cost-inefficiency, difficulty to operate and producing hazardous waste [8].
The advent of non-thermal plasma (NTP) makes it possible to reduce the concentration of pollutants such as VOCs in an accessible, economic and easy way [9]. Gliding arc plasma as one of the most promising devices is used for gas decomposition because it has both thermal and non-thermal regions [10, 11]. The gliding arc (GA) plasma produces more energetic radical species compared to other types of non-thermal plasmas [12]. So, researchers find GA plasma as one the most efficient devices for decomposition of hazardous gases like benzene and greenhouse gases [13, 14]. Previous studies reported that the maximum electron density of a micro discharge generated in a dielectric barrier discharge (DBD) is about 3 × 10⁹ m−3 [15], whilst the average electron density of glow or glow-like discharges generated in a GA reactor is of the order of 1016–1017 m−3 which results in more active energy transfer for chemical reactions. [16, 17]
In the present study, a specially designed plate gliding arc (PGA) reactor consisting of two metal plates and an electron density of 1017 m−3 was used for removal of high concentration benzene in factories with wet scrubbers. The water temperature in these scrubbers was about 20°C to 70°C within the range of condensation of benzene. In this case benzene forms a separate liquid phase above the water. A custom designed part (which is designed to collect the liquids of scrubbers) was then used to incorporate a warm flow of air passing through the liquid phase of benzene. In this way the concentration of benzene can reach about 70,000 ppm [6]. So, in this research we designed and used a PGA reactor for decomposition of benzene before exhausting to the environment. The benzene concentration in outlet gas reduced to less than 0.3 ppm which meets the OSHA standards.
It is well-known that some factories have high emission of methane and carbon dioxide. Additionally, the complete oxidation of benzene by applying the PGA reactor leads to more CO2 emission. Thus, two separate experimental setups with the same reactor were developed to investigate the usage of the PGA reactor for carbon dioxide and methane decomposition: one for removal of benzene and the other for methane and carbon dioxide reforming. In the present work the effect of major parameters, such as input power, the type of carrier gas, [CH4/CO2] ratio, and feed gas flow rate is investigated to find the optimum point for benzene, methane and carbon dioxide decomposition. The energy efficiency of the PGA is compared with that of other plasma reactors studied for gas decomposition. Another parameter which is crucial in this work is the effect of initial benzene concentration. The effect of VOC’s concentration on removal efficiency has some controversy among researches. Some researchers claim that high concentration leads to a higher removal efficiency [18–20]; however, others believe that high VOS’s concentration leads to a lower removal efficiency [21]. Moreover, there are researches that claim the initial concentration has no effect on VOC’s removal efficiency [22]. In contrast to the researches focusing on low benzene concentration [23], and considering the high concentrations produced in wet scrubbers, we focus on high benzene concentration to investigate the effect of initial concentration and reactor performance on removal efficiency.
Experimental procedure
Benzene decomposition setup
A schematic illustration of the experimental setups for benzene, methane and carbon dioxide decomposition by the PGA plasma is shown in Fig. 1. The experimental setup of benzene decomposition consists of three parts: the part of air and benzene mixing, the plasma reactor, and the analysis system. In the first part, for each experiment, 3mL benzene was injected in a bubble and placed in 70°C water. A flow of air as the carrier gas into the bubble for mixing with benzene vapor was varied between 2 to 4.5 sL min−1, so the minimum and maximum concentration of benzene was 41,700 ppm and 72,500 ppm (according to Antoine equation). The consistency of initial benzene concentration is an important point which affects the validity of removal efficiency results. For each experiment the initial concentration (when plasma is off) was analyzed for three times with Gas Chromatography (GC) and the standard deviation was determined for each experiment. In each experiment the repeatability of initial benzene concentration was tested. As shown in Fig. 2, for each gas flow rate, the initial concentration did not change noticeably in each experiment. When air passes through the benzene bubbler it carries certain benzene concentration to the plasma reactor. The air was supplied from an air compressor, and the flow rates were controlled by mass flow controllers (MFC-APEX). In the second part, plasma was configured between two knife-shaped stainless steel electrodes [24]. These electrodes were fixed between two quarts plates to trap the pollutant gas in the plasma zone. The electrodes were connected to an AC 0–20 kV high voltage (20 KHz) power supply with 1200 W maximum power output. The voltage was measured by a high voltage probe (Tekronix P6015A), and electrical signals were sampled using a four-channel digital oscilloscope. The electrode gap was fixed at 9mm. In the last part, the outlet gases were injected from a balloon into the gas chromatograph (GC; Agilent-7890A, column HP-Al/S). The detector and injector temperature was fixed at 300°C and 250°C, respectively. Besides, the initial oven temperature was fixed at 35°C. The temperature ramp was 30°C per minute until it reached 65°C. After a minute at this temperature, it rises to 75°C. Then after 1 min in this temperature, it grew to 125°C with ramp of 15°C. Finally after 1 min in this temperature, it reached to 140°C. So, one GC analysis took about 9 min. In addition, Optical Emission Spectroscopy (OES) analysis was used to detect the active species in the plasma region. The input power varied from 650 to 1000 W. In each experiment the sampling process was started after 30 s and lasted for 1 min.
Fig. 1.

Experimental setups for a benzene and b methane and carbon dioxide decomposition by PGA reactor
Fig. 2.

The variation of initial benzene concentration (plasma off) with different gas flow rates, and standard deviation of initial benzene concentrations. Sample collecting time: 1 min
Methane and carbon dioxide setup
The basic experimental arrangement for methane and carbon dioxide decomposition is illustrated in Fig. 1-b. In this setup the PGA reactor was used with different career gases (nitrogen, argon) to study the effect of carrier gas on conversion of methane and carbon dioxide. After that, the exhausted gas was analyzed by GC and FT-IR analysis system.
Data analysis method
The power consumption was measured by a power meter (Zeigler Delta Power) to calculate the specific input energy (SIE) as:
| 1 |
where P is the discharge power and Q is the total flow rate. SIE value is varied by changing either the applied power or gas flow rate. Also, benzene removal efficiency is determined by
| 2 |
where Xin and Xoutis the benzene concentration in plasma-off and plasma-on conditions, respectively. CO2, CO, CH4, H2, H2O, CH4 and C2H4 selectivity is calculated as follows:
| 3 |
where X is the type of products, n is the concentration of products produced after plasma treatment and N equals to the total concentration of all products.
Moreover, in order to draw a comparison between the efficiency of this PGA reactor and the reactors used in other researches, Energy Density (ED)) parameter is defined as follows
| 8 |
| 9 |
where Cppm is the net concentration of VOC dissociated by plasma.
Result and discussion
Performance of the gliding arc reactor
There are numerous researches that investigate the removal of VOCs by gliding arc reactors [13–18]. To better understand the difference between PGA and other gliding are reactors, the structure of PGA is shown Fig. 3-a. As it is shown in this figure, two knife-shaped stainless-steel electrodes are fixed between two quartz plates and a distributing injection system is used to distribute the pollutant gas uniformly between two electrodes. This arrangement helps reactors to achieve higher removal efficiency in two ways. First, the pollutant gas is trapped and cannot escape from the plasma region and it is subjected to energetic species more prominently. Secondly, since the gliding arc has thermal and non-thermal plasma regions, all of the pollutants pass across two regions, causing higher removal efficiency. This high efficiency is mainly due to the high electron density in the order of 1017 m−3, higher production of •OH radicals, and higher Nitrogen active species. As shown in Fig. 3-a a tee (a distributary injection system) is placed to distribute the pollutant gas uniformly. This distribution increases the residence time and the feed gas is more subject to the energetic species in the plasma region. Figure 3-b shows the PGA used in this research. The volume of plasma in this reactor is 27.5 cm−3, so the residence time is about 0.8 s. Figure 3-c is an illustration for the uniform plasma expansion between two electrodes with a larger gap, and Fig. 3-d is attributed to plasma formation without a tee. As shown in this figure a distributary injection system produces more uniform plasma.
Fig. 3.

The distribution of plasma region in a simple GA and a PGA reactor with constant gas flow rate of 2 sL.min−1, fixed power of 250W, a a schematic diagram of a PGA, b PGA with gap of 9mm, c PGA with gap of 30mm, d PGA without a distributary injection
Benzen conversion by PGA
Influence of the feed gas flow rate on benzene removal efficiency
Benzene concentration and feed gas flow rate are considered as two main factors for investigating the benzene removal efficiency [25]. Benzene concentration depends on the air flow rate. The initial benzene concentration varies in steps between a minimum and maximum of 41,700 to 72,500 ppm, respectively. The consistency of initial benzene concentration was mentioned in previous section. Figure 4 shows the influence of the total feed flow rate on the conversion of benzene at a constant input power of 250W. By increasing the gas flow rate the residence time decreases, so the conversion of benzene decreases. As mentioned in the method and material section, the removal efficiency is determined by initial and final benzene concentrations at each gas flow rate. The removal efficiency in different feed gas flow rates from 2 sL min−1 to 4.5 sL min−1 is shown in Fig. 4.
Fig. 4.
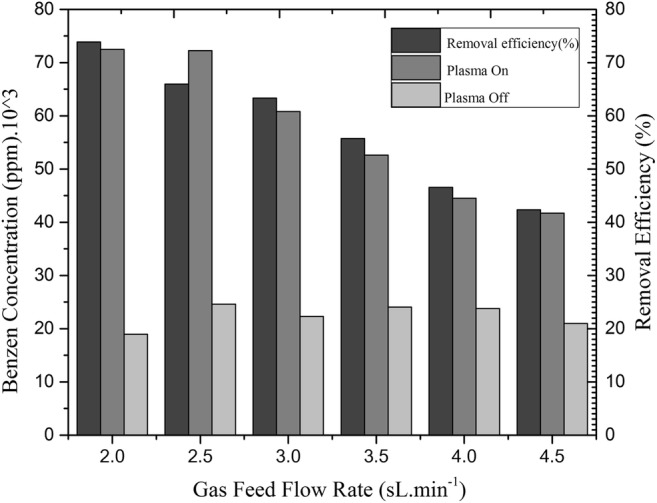
The effect of feed gas flow rate and initial benzene concentration on removal efficiency at constant input power of 250W. Sample collection time: 1 min. Retention time: 0.8 s
In recent researches on the decomposition mechanism of VOCs, the kinetic modeling of benzene decomposition was described by Nichipor et al., [26]. The active species formed in the simulated model gas (87%N2 + 10%O2 + 3% H2O + NOx + SO2 + VOC) can be listed as primary ions (such as N2+, O2+, N+, O+, H2O+, OH+, H+, H2+) and radicals (such as O•, N•, •OH, HO•2). Kinetic and mechanism of transformation of these species in absence of VOCs were well recognized by Busi F et al., and Mätzing H et al., [27, 28]. It is well known that •OH radicals are the most significant species for VOC decomposition [29]. The mechanism of interactions between •OH radicals and benzene was described by Bohn B et al., [30]
Furthermore, the reactive species mostly observed are the excited N2 and O2 atoms. The energy of these species was described by Raizer YP [31].
Two N2 reactive species have been observed with excitation energies of 6.2 eV and 8.4 eV and more interestingly, they have a rather long lifetime which increases the probability of interaction between the species and the pollutant molecules. On the other hand, with energies in such order (1–10 eV), they can definitely break the powerful bonds in the pollutant molecules and increase the removal efficiencies.
In addition, OES analysis was done to show the intensity of active species and radicals in the plasma region. Using these analyses the relation between removal efficiency and the intensity of active species was demonstrated. The effect of •OH radicals and N2 active species on the removal efficiency is illustrated in Fig. 5.
Fig. 5.

OES analysis of active species of the PGA reactor with different feed gas flow rates in constant input power of 250W. Experiment time: 1 min
The intensity of •OH in various flow rates is another evidence to support the result of the effect of the feed gas flow rate on the conversion of benzene which was monitored by OES. In other words, increasing the gas flow rate leads to a decrease in both residence time and initial benzene concentration, while decreasing resident time results in a decrease in removal efficiency. These two factors determine the total removal efficiency [32]. As shown in Fig. 4, the competition between gas flow rate and initial benzene concentration determines the benzene removal efficiency. This figure shows that at 2 sL min−1, when initial benzene concentration is very high, benzene removal efficiency is 73.8%. For the less initial benzene concentration with gas flow rate of 4.5 sL min−1 the removal efficiency is 42.3%. Since there is no dramatic decrease in removal efficiency, it can be concluded that a high benzene concentration leads to a higher removal efficiency and the effect of feed gas flow rate is more than that of benzene concentration.
Influence of input power on benzene removal efficiency
Figure 6-a shows the effect of input power on conversion of benzene at two constant feed flow rates at 2 sL min−1 and 4 sL min−1. The input power was set successively at: 120, 220, 320, 420, 520, and 620W. The results show that the benzene removal efficiency increases by increasing the input power from 120W to 320W. However, increasing the input power from 320W to 620W resulted in no significant change in benzene conversion. Therefore, the optimum power for the benzene conversion is 320W.
Fig. 6.
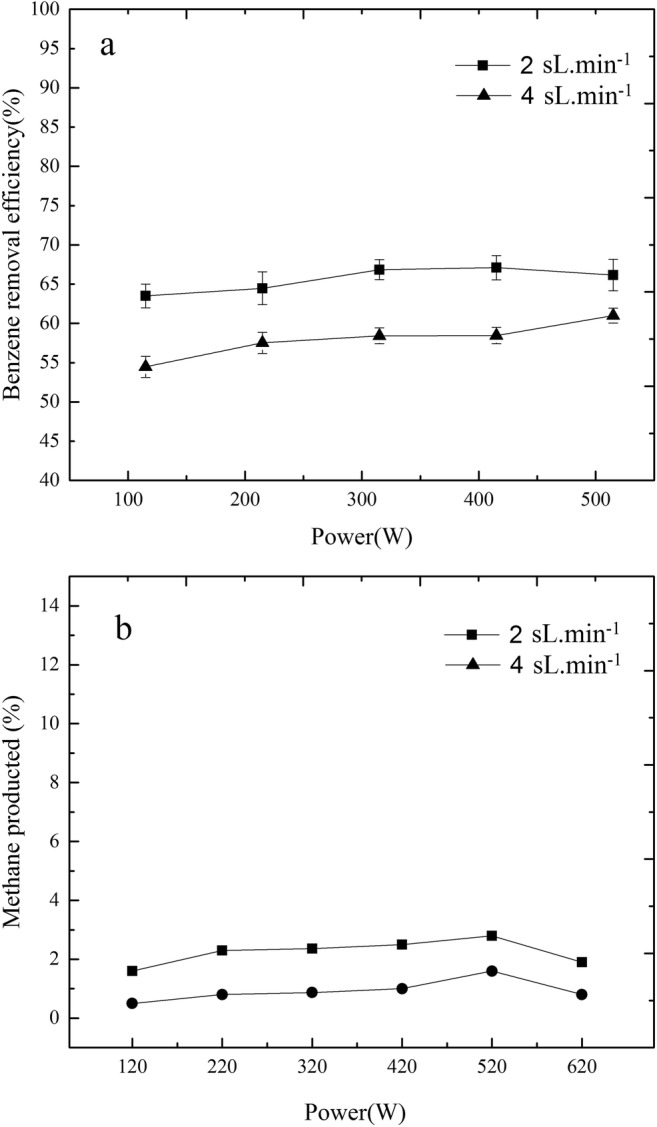
a benzene removal efficiency in different power and feed gas flow rate. b The production of methane as one of the benzene decomposition byproducts. The initial benzene concentration is based on what was described in Fig. 2 for each gas flow rate. Sample collecting time: 1 min, retention time: 0.8 s.
To investigate the effect of the input power, the production of methane, as one of the main HC byproducts of benzene decomposition was studied which can be detected by common FID GC. More methane production means more benzene decomposition. Figure 6-b shows the methane production at two fixed feed gas flow rates at 2 sL min−1 and 4 sL min−1 with variable input power. As shown in this figure, there is a low increase in methane production by increasing power from 320 to 620 W.
It can be seen that, at the constant input power, when the gas feed flow rate is 2 sL min−1, the conversion rate of benzene is more than the conversion rate when the gas feed flow rate is 4 sL min−1,which is due to a decrease in the resident time. The selectivity of the products in the optimum condition is 88%, 10%, 0.79%, 0.6%, 0.15%, for CO2, CO, C2H4, H2, and CH4, respectively. The results are attributed to removal of 72,500 ppm of benzene. CO2 selectivity reached 88% without any catalyst assistance at the 320W input power and gas flow rate of 2 sL min−1. The selectivity of CO is about 10%, and compared to the other researches, it shows that there is a little amount of CO among products after the plasma treatment without any catalyst assistance [7, 8, 13, 33–35]. Besides, due to the low hydrogen content of benzene, hydrogen was not produced considerably. Generally, as the result of incomplete oxidation of benzene, CO2 and H2O will not be the only products of the conversion of benzene.
Efficiency of PGA for benzene decomposition
The ED parameter of PGA and other reactors like DBDs used in gas decomposition is calculated here to draw a comparison between the efficiency of the PGA and other reactors. As it is shown in Table 1, the value of this parameter for recent PGA is 0.1 J/Lmol which means that 0.1 joule energy is required for decomposition of 1 mol of benzene. Table 1 shows the ED parameter for various plasma reactors.
Table 1.
ED parameter of different plasma reactors for VOC’s degradation
| Year | Plasma Type | Carrier gas | Initial Concentration of VOC (ppm) | Maximum removal efficiency (%) | Cppm | SIE(J/L) | ED (j/L.mol) | Refrence | |
|---|---|---|---|---|---|---|---|---|---|
| 1 | 2017 | DBD | Air |
1500 2500 |
70 20 |
1050 500 |
6000 5250 |
5.9 11.2 |
[36] |
| 2 | 2017 | DBD | Air | 100 | 60 | 60 | 473 | 8.3 | [37] |
| 3 | 2017 | DBD | Air | 400 | 50 | 200 | 720 | 3.7 | [38] |
| 4 | 2017 | DBD | Air | 1 | 46.1 | 0.46 | 132.5 | 100 | [39] |
| 5 | 2017 | DBD | Air | 110 | 80 | 88 | 400 | 4.5 | [40] |
| 6 | 2017 | DBD | Air | 36.6 | 92 | 33 | 250 | 7.7 | [41] |
| 7 | 2017 | DBD | Air | 500 | 50 | 250 | 576 | 2.3 | [42] |
| 8 | 2016 | DBD | Air | 95 | 50 | 47.5 | 300 | 6.6 | [9] |
| 9 | 2016 | DBD | Air |
306 116 |
90 40 |
275.4 46.4 |
100 100 |
0.3 2.5 |
[43] |
| 10 | 2015 | DBD | Air | 758 | 98.2 | 744 | 2500 | 5 | [44] |
| 11 | 2014 | DBD | Air | 100 | 40 | 40 | 13 | 0.3 | [8] |
| 12 | 2014 | DBD | Air | 200 | 24 | 48 | 173 | 5 | [45] |
| 13 | 2014 | DBD | Air | 100 | 40 | 40 | 9.9 | 0.2 | [33] |
| 14 | 2014 | Glid | Air | 71.6 | 50 | 38.5 | 98 | 20 | [46] |
| 15 | 2013 | DBD | Air | 1000 | 50 | 500 | 23 | 0.5 | [34] |
| 16 | 2011 | DBD | Air | 1000 | 60 | 600 | 700 | 1.2 | [47] |
| 17 | 2009 | DBD | Air | 1 | 60 | 0.6 | 300 | 50 | [48] |
| 18 | 2004 | DBD | Air | 105 | 35 | 36.75 | 400 | 11 | [49] |
| 19 | 2001 | DBD | Air | 2700 | 99 | 2673 | 3000 | 1.2 | [50] |
| 20 | DBD | Air | 100 | 90 | 90 | 680 | 8 | [7] | |
| 21 | DBD | Air | 276 | 99 | 273.24 | 810 | 3 | ||
| 22 | DBD | Air | 200 | 75 | 150 | 305 | 2 | ||
| 23 | DBD | Air | 380 | 11 | 41.8 | 170 | 4 | ||
| 24 | DBD | Air | 105 | 35 | 36.75 | 360 | 10 | ||
| 25 | DBD | Air | 200 | 70 | 140 | 3150 | 25 | ||
| 26 | DBD | Air | 210 | 40 | 84 | 370 | 5 | ||
| 27 | DBD | Air | 250 | 50 | 125 | 230 | 2 | ||
| 28 | DC Glow | Air | 296 | 90 | 266.4 | 4000 | 17 | ||
| 29 | Our Work | Gliding arc | Air | 72,000 | 73 | 52,560 | 7500 | 0.1 |
One of the main reasons for considering high concentration benzene in this work is to investigate the efficiency of PGA reactor and compare its energy density to other reactors. Generally, there are two kinds of plasma reactors which are used for gas decomposition: DBD, and Gliding arc. In this table, C (ppm) is the net VOC concentration treated by a plasma reactor (difference between the initial and final benzene concentrations [C (ppm) = C in – C out]).
Investigation of methane and carbon dioxide reforming by PGA
The removal of benzene with PGA plasma was investigated in previous sections. In the following, reforming of methane and carbon dioxide as the main byproducts of benzene decomposition and as the main outlet gas pollutants of factories is investigated. It should be noted that this study has been done by considering real factory conditions. So, the ratio of CH4/CO2 is not determined only by byproducts of benzene decomposition; there are other sources of carbon dioxide and methane in aforementioned factories. Thus, a plausible ratio of CH4/CO2 was selected which considers both sources of emission. In addition, since the PGA reactor is not operating in a full duty cycle (sometimes the reactor is switched off), the concentration of methane and carbon dioxide as byproducts is subject to change.
The role of carrier gas is critical in conversion rate, because the density and energy of free species produced in the plasma region depend on carrier gas molecular structure. So, the effect of argon and nitrogen as carrier gas types on methane and carbon dioxide reforming was also studied.
Decomposition of methane with nitrogen as career gas
Although, air consists of a high percentage of oxygen and nitrogen, NOx species were not produced in PGA. It should be noted that deNOx reduction occurs in the plasma region when there is a sufficient amount of hydrocarbons (HC) based on mechanism described by Pârvulescu et al. [32].
Since air consists of high percentage of nitrogen, it was selected as the career gas for the investigation of methane decomposition. The nitrogen gas flow varied between 3 and 6 sL min−1 and methane gas flow was fixed at 0.5 sL min−1. Previous studies demonstrated that the high energetic electrons generated in non-thermal plasma could break the C-H bonds of the methane molecules at low temperatures [11] (<300°C) and produce a high amount of H2 and C2H6 [51]. The mechanism of methane decomposition by nitrogen as the carrier gas is listed below:
N2 + CH4:
OES of PGA for CH4 + N2 plasma under different conditions was conducted to further understand the mechanisms of methane decomposition process in nitrogen. Moreover a detailed assignment of the observed spectral lines was presented in [52]. A complete description of carbon dioxide and argon plasma reactions is available in [53].
The decomposition efficiency of methane using nitrogen plasma is demonstrated in Fig. 7. By increasing SIE, the conversion of methane increases. As characterized in Fig. 7, the maximum decomposition efficiency of methane at fixed power of 300 W is 52.29%.
Fig. 7.
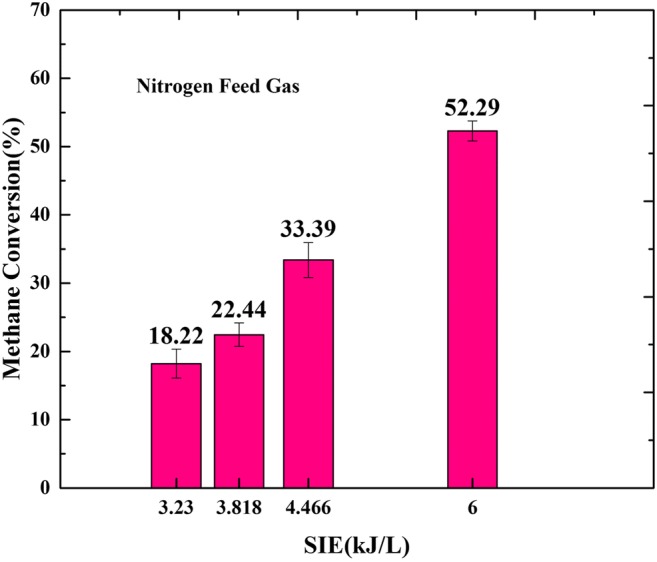
The effect of nitrogen as carrier gas on methane conversion with different SIE. Sample collecting time: 1 min. Retention time: 0.8 s
Decomposition of methane with argon as career gas
In a large number of related studies, argon has been used as the career gas, because it is easily ionized. Unlike nitrogen, argon is a neutral gas and does not take part in chemical reactions. Furthermore, using argon as the career gas is important because a large number of electrons can be produced in plasma, and there is a sufficient amount of energetic ions to bombard methane molecules and crack its structure. Thus, argon is used as one of the efficient carrier gas for methane decomposition [46]. The decomposition of methane has been investigated with three kinds of career gas (nitrogen, argon, and carbon dioxide), and the decomposition mechanisms are:A list of related reactions involved in Ar/ CH4 mixture discharge is described by Sun W et al. [51].
Ar + CH4
Figure 8 shows the conversion of CH4 in argon plasma at a constant input power of 250W. The flow rate increased from 3 to 6 sL min−1, and the methane flow rate was fixed at 0.5 sL min−1. It clearly shows that with increasing SIE the conversion of CH4 increases from 16.22 to 44.85%. The results show that the conversion of methane in nitrogen plasma is higher than the conversion in argon plasma. It is due to the difference of their enthalpy. N2 has higher enthalpy so it carries more energy to decompose the methane structure.
Fig. 8.
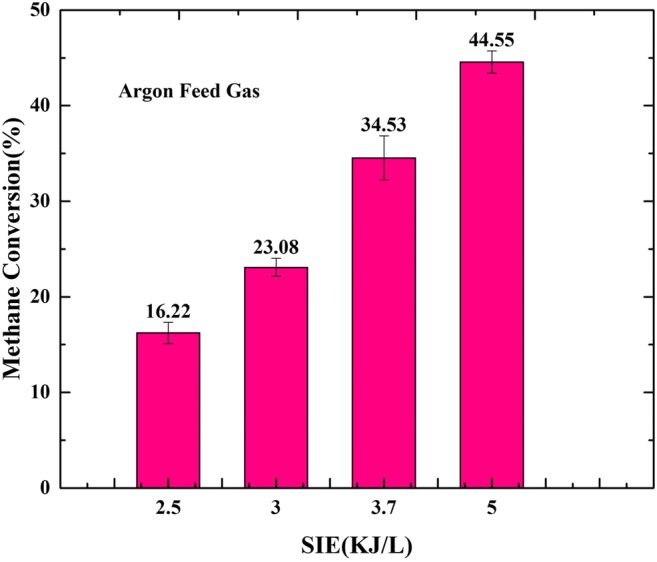
The effect of argon as carrier gas on methane conversion with different SIE, Sample collection time: 1 min, retention time: 0.8s
Decomposition of methane with different carbon dioxide gas flow rates
The ratio of methane and carbon dioxide produced in benzene removal was mentioned before. There are two reasons for the difference in CH4/CO2 ratio. First, there are other sources of carbon dioxide and methane emission in factories which can lead to various amounts of CH4/CO2 ratio. Second, current PGA reactors do not operate in a full duty cycle; it means that, sometimes the reactor is switched off. So the concentrations of methane and carbon dioxide differ from their initial values. In this regard the ratios of these byproducts should be close to the ratios in real conditions while reaching high removal efficiency by PGA decomposition. CO2 flow rate varied from 4 to 8 sL min−1. The methane flow rate was fixed at 3 sL min−1 and the carbon dioxide gas flow rate varied from 1 to 5 sL min−1. By performing a large number of experiments, it was found that, if the flow rate of CH4 is more than the CO2 flow rate, no significant removal for methane decomposition is observed. In addition, methane was produced due to the presence of water vapor, and recombination of hydrogen radicals and separated carbons [25, 54]. The mechanism of methane conversion is:
A related reaction for dry methane reforming is described by Tu X et al., [35]
The effect of different ratios of [CH4/CO2] on methane reforming was investigated. For [CH4/CO2] ≤1, more conversion of CH4 was observed. In fact, active radicals are the main source of this reaction. The results of these experiments provide the efficient ratio of methane and carbon dioxide to obtain a high decomposition efficiency. The best efficient ratio of CH4 and CO2 is [CH4/CO2] = 3/4 which leads to a high conversion rate for both methane and carbon dioxide. Since, increasing the feed flow rate leads to a decrease in residence time of methane and carbon dioxide, the conversion of methane decreases with increasing the feed flow rate after a certain ratio. To elevate the effectiveness of plasma reactor operation in this ratio, the residence time of carrier gas was increased by decreasing the total feed flow rate, so feed flow rate was fixed at 2 sL min−1. The highest methane decomposition was 65%. At the power of 300W, the selectivity of H2 reached a high amount of 72%, and the selectivity of CO and O2 was 12% and 15%, respectively. In dry methane and CO2 reforming, according to the reaction CH4 + CO2 → 2CO + 2H2, the consumption of methane and CO2 was equal. In this case, if there is extra carbon dioxide it will directly be converted to carbon and oxygen.
It is worthy to note that this hydrogen production value is just achieved by using the PGA reactor and without using any catalysts to affect the pollutant conversion. If there is a need for using catalyst to improve the hydrogen production, the PGA reactor can increase catalyst life time during the reforming of pollutant gases [55, 56]. In the current study, CO is the other product generated in this process, and its selectivity is only 12%, which can be eliminated from the products using combined plasma and catalyst methods [35].
Effect of feed gas type on decomposition of carbon dioxidedecomposition of carbon dioxide using PGA with argon as carrier gas
In this part, the main goal is to investigate the influence of some important parameters on decomposition of carbon dioxide. At first, the effect of the carrier gas is considered. Figure 9-a is related to decomposition of carbon dioxide with argon as the feed gas. The experiment was performed with the ratio of [Ar/CO2] = 2.5/2.5. The decomposition rate was studied with FT-IR analysis. As specified, the peak intensity of CO2 reduces after plasma treatment by PGA. According to the area of the intensity diagram of FT-IR results which is shown in Fig. 9a (using MIP Cloud image processing software) the decomposition efficiency of carbon dioxide with argon is 54%. The initial power required for plasma production was 360 W. Figure 9-b shows the FT-IR analysis of CO2 decomposition using argon with a ratio of [Ar/CO2] = 5/2.5. As shown in this figure, the decomposition efficiency is 9%. In fact, by increasing the feed gas flow rate, the residence time decreases, so the decomposition efficiency of CO2 decreases. The power in this experiment was fixed at 450 W.
Fig. 9.

FT-IR analysis for decomposition of CO2 using PGA reactor and argon as carrier gas in two flow rates
Decomposition of carbon dioxide using PGA with methane as carrier gas
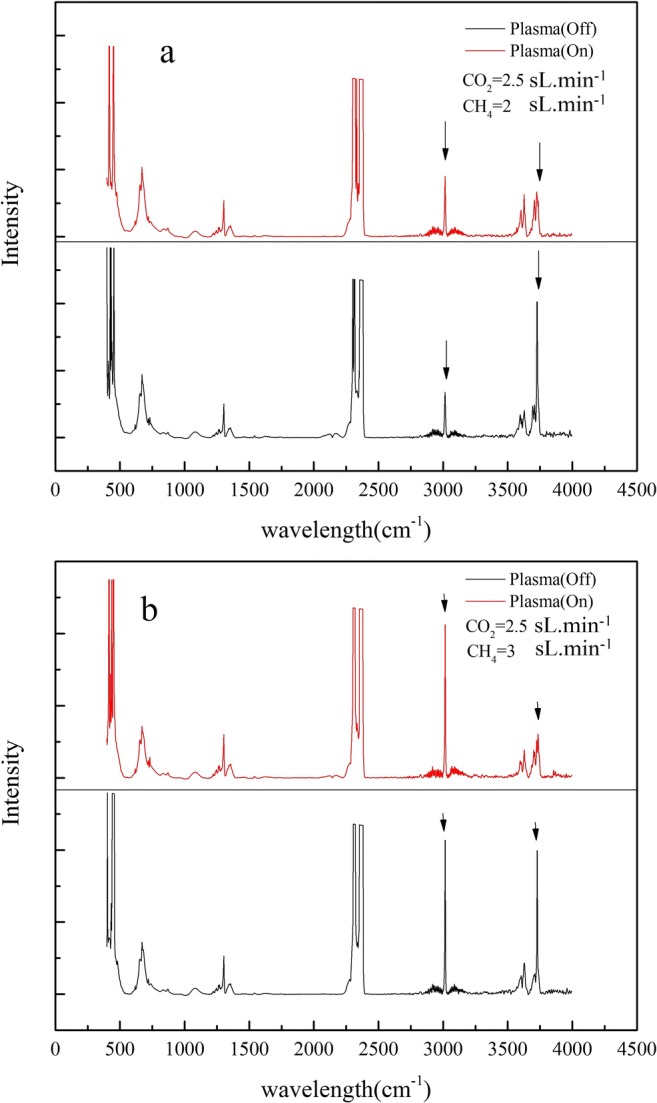
In this series of experiments, the flow rate of carbon dioxide was fixed at 2.5 sL min−1, and the flow rate of methane varied from 2 to 5 sL min−1. In order to investigate the effect of gas flow rate, the power was fixed after plasma formation. Figure 10-a shows the results for flow ratio of [CH4/CO2] = 2/2.5, while the power was fixed at 360W. As displayed in this figure, the CO2 peak intensity decreases with the increase of feed gas flow rate. The decomposition efficiency of CO2 is 54%. One important point illustrated in this figure is the intensity of methane peak. As it is shown, the intensity of methane increases when CO2 concentration is higher than that of CH4. The reason was discussed in section 3.3.3.
Fig. 10.
FT-IR analysis of decomposition of CO2 using PGA reactor and methane as carrier gas in two different flow rates. Sample collecting time: 1 min, retention time: 0.8s
Figure 10-b shows the decomposition efficiency of CO2 when the ratio is [CH4/CO2] = 3/2.5, and the power is fixed at 400W. For ratio of [CH4/CO2] = 3/2.5 CO2 conversion increased up to 69%.
According to chemical stoichiometry of CH4 + CO2 → 2CO + 2H2, it can be concluded that when the ratio of CH4 and CO2 is near unity, a high decomposition rate for both methane and carbon dioxide can be achieved.
Conclusion
In this study, an atmospheric plate gliding arc (PGA) reactor was developed to study the removal efficiency of very high benzene concentration (about 72,000 ppm) produced in paper and painting industries. In this regard, the effect of major parameters on removal efficiency was studied. The first parameter was the reactor’s configuration that causes a uniform distribution of carrier gas between two electrodes. In this way, more room was available to produce more energetic species. The more energetic species, the higher the conversion rate for pollutant gas. The second parameter was initial benzene concentration. High concentration of benzene led to more •OH radicals production in the plasma region. So, an increase in initial concentration at fixed power and feed gas flow rate caused a higher removal efficiency for benzene. At constant initial benzene concentration, an increase in applied power created an increase in removal efficiency. However, there is a limitation for increasing the power. When the applied power is more than a special value, it has no effect on removal efficiency. So, at the optimum point in applied power of 320W with the highest initial benzene concentration the selectivity of CO2 and CO was 88% and 11%, respectively. Another parameter defining the efficiency of the PGA is the energy density. The low energy density of PGA is comparable with other plasma reactors used for gas decomposition.
In the second part of this study, the decomposition of methane and carbon dioxide was studied with different carrier gases such as argon and nitrogen. The results show that the conversion rate of methane with nitrogen career gas is higher than its conversion with argon. At the final step, the conversion of methane and carbon dioxide was investigated together with various ratios. It was shown that a mixture of CO2 and CH4 [CH4/CO2] at a fixed flow rate of 3/4 was related to high conversion of CO2 up to 69%, and the selectivity of hydrogen reached up to 72%.
Acknowledgements
We would like to show our gratitude to the members of Plasma Laboratory, Laser and plasma research Institute, Shahid Beheshti University for sharing their ideas with us during the course of this research.
Compliance with ethical standards
Conflict of interest
There is no conflict of interest.
Footnotes
It should be noticed that because of some technical problems such as negative pressure, using a powerful fan is impossible in these companies.
Highlights
• High complete oxidation and high removal efficiency (73%) of benzene without any catalyst was obtained.
• Comparative energy density of PGA reactor for decomposition of VOCs was presented.
• Optimum conversion of methane and carbon dioxide was obtained using PGA reactor.
• Conversion of methane and carbon dioxide together in different flow ratio was obtained.
• High methane and carbon dioxide decomposition efficiency was obtained (52% & 69%)
Publisher’s note
Springer Nature remains neutral with regard to jurisdictional claims in published maps and institutional affiliations.
References
- 1.Monks P, Granier C, Fuzzi S, Stohl A, Williams M, Akimoto H, Amann M, Baklanov A, Baltensperger U, Bey I. Atmospheric composition change–global and regional air quality. Atmos Environ. 2009;43(33):5268–5350. doi: 10.1016/j.atmosenv.2009.08.021. [DOI] [Google Scholar]
- 2.Chun YN, Yang YC, Yoshikawa K. Hydrogen generation from biogas reforming using a gliding arc plasma-catalyst reformer. Catal Today. 2009;148(3–4):283–289. doi: 10.1016/j.cattod.2009.09.019. [DOI] [Google Scholar]
- 3.Snoeckx R, Aerts R, Tu X, Bogaerts A. Plasma-based dry reforming: a computational study ranging from the nanoseconds to seconds time scale. J Phys Chem C. 2013;117(10):4957–4970. doi: 10.1021/jp311912b. [DOI] [Google Scholar]
- 4.Thévenet F, Sivachandiran L, Guaitella O, Barakat C, Rousseau A. Plasma–catalyst coupling for volatile organic compound removal and indoor air treatment: a review. J Phys D Appl Phys. 2014;47(22):224011. doi: 10.1088/0022-3727/47/22/224011. [DOI] [Google Scholar]
- 5.Fan H-Y, Shi C, Li X-S, Zhao D-Z, Xu Y, Zhu A-M. High-efficiency plasma catalytic removal of dilute benzene from air. J Phys D Appl Phys. 2009;42(22):225105. doi: 10.1088/0022-3727/42/22/225105. [DOI] [Google Scholar]
- 6.Kastner JR, Das K. Wet scrubber analysis of volatile organic compound removal in the rendering industry. J Air Waste Manage Assoc. 2002;52(4):459–469. doi: 10.1080/10473289.2002.10470800. [DOI] [PubMed] [Google Scholar]
- 7.Vandenbroucke AM, Morent R, De Geyter N, Leys C. Non-thermal plasmas for non-catalytic and catalytic VOC abatement. J Hazard Mater. 2011;195:30–54. doi: 10.1016/j.jhazmat.2011.08.060. [DOI] [PubMed] [Google Scholar]
- 8.Li Y, Fan Z, Shi J, Liu Z, Shangguan W. Post plasma-catalysis for VOCs degradation over different phase structure MnO2 catalysts. Chem Eng J. 2014;241:251–258. doi: 10.1016/j.cej.2013.12.036. [DOI] [Google Scholar]
- 9.Karatum O, Deshusses MA. A comparative study of dilute VOCs treatment in a non-thermal plasma reactor. Chem Eng J. 2016;294:308–315. doi: 10.1016/j.cej.2016.03.002. [DOI] [Google Scholar]
- 10.Mutaf-Yardimci O, Saveliev AV, Fridman AA, Kennedy LA. Thermal and nonthermal regimes of gliding arc discharge in air flow. J Appl Phys. 2000;87(4):1632–1641. doi: 10.1063/1.372071. [DOI] [Google Scholar]
- 11.Chen HL, Lee HM, Chen SH, Chang MB, Yu SJ, Li SN. Removal of volatile organic compounds by single-stage and two-stage plasma catalysis systems: a review of the performance enhancement mechanisms, current status, and suitable applications. Environ Sci Technol. 2009;43(7):2216–2227. doi: 10.1021/es802679b. [DOI] [PubMed] [Google Scholar]
- 12.Aoqui S-i, Kawasaki H, Mitsugi F, Ohshima T, Sakai E, Muramoto I, Furukawa J, Stryczewska HD Analysis of gliding arc discharge plasma using a high-speed camera and emission spectroscopy measurement, Proceedings of the 2nd International Symposium on Process Chemistry, Kyoto, Japan, 2011.
- 13.Indarto A, Yang DR, Azhari CH, Mohtar WHW, Choi J-W, Lee H, Song HK. Advanced VOCs decomposition method by gliding arc plasma. Chem Eng J. 2007;131(1–3):337–341. doi: 10.1016/j.cej.2006.11.009. [DOI] [Google Scholar]
- 14.Richard F, Cormier J, Pellerin S, Chapelle J. Physical study of a gliding arc discharge. J Appl Phys. 1996;79(5):2245–2250. doi: 10.1063/1.361188. [DOI] [Google Scholar]
- 15.Tu X, Verheyde B, Corthals S, Paulussen S, Sels B. Effect of packing solid material on characteristics of helium dielectric barrier discharge at atmospheric pressure. Phys Plasmas. 2011;18(8):080702. doi: 10.1063/1.3619822. [DOI] [Google Scholar]
- 16.Massines F, Gherardi N, Naudé N, Ségur P. Recent advances in the understanding of homogeneous dielectric barrier discharges. Eur Phys J Appl Phys. 2009;47(2):22805. doi: 10.1051/epjap/2009064. [DOI] [Google Scholar]
- 17.Hudson R, Gerakines P, Loeffler M. Activation of weak IR fundamentals of two species of astrochemical interest in the T d point group–the importance of amorphous ices. Phys Chem Chem Phys. 2015;17(19):12545–12552. doi: 10.1039/C5CP00975H. [DOI] [PubMed] [Google Scholar]
- 18.Magureanu M, Mandache N, Gaigneaux E, Paun C, Parvulescu V. Toluene oxidation in a plasma-catalytic system. J Appl Phys. 2006;99(12):123301. doi: 10.1063/1.2204353. [DOI] [Google Scholar]
- 19.Subrahmanyam C, Renken A, Kiwi-Minsker L. Novel catalytic dielectric barrier discharge reactor for gas-phase abatement of isopropanol. Plasma Chem Plasma Process. 2007;27(1):13–22. doi: 10.1007/s11090-006-9039-x. [DOI] [Google Scholar]
- 20.Ding H-X, Zhu A-M, Yang X-F, Li C-H, Xu Y. Removal of formaldehyde from gas streams via packed-bed dielectric barrier discharge plasmas. J Phys D Appl Phys. 2005;38(23):4160–4167. doi: 10.1088/0022-3727/38/23/004. [DOI] [Google Scholar]
- 21.Subrahmanyam C, Magureanu M, Renken A, Kiwi-Minsker L. Catalytic abatement of volatile organic compounds assisted by non-thermal plasma: part 1. A novel dielectric barrier discharge reactor containing catalytic electrode. Appl Catal B Environ. 2006;65(1–2):150–156. doi: 10.1016/j.apcatb.2006.01.006. [DOI] [Google Scholar]
- 22.Kim H-H, Oh S-M, Ogata A, Futamura S. Decomposition of gas-phase benzene using plasma-driven catalyst (PDC) reactor packed with ag/TiO2 catalyst. Appl Catal B Environ. 2005;56(3):213–220. doi: 10.1016/j.apcatb.2004.09.008. [DOI] [Google Scholar]
- 23.Bo Z, Yan J, Li X, Chi Y, Cen K. Plasma assisted dry methane reforming using gliding arc gas discharge: effect of feed gases proportion. Int J Hydrog Energy. 2008;33(20):5545–5553. doi: 10.1016/j.ijhydene.2008.05.101. [DOI] [Google Scholar]
- 24.Baowei W, Qimei S, Yijun L, Meilin Y, Wenjuan Y. Steam reforming of dimethyl ether by gliding arc gas discharge plasma for hydrogen production. Chin J Chem Eng. 2014;22(1):104–112. doi: 10.1016/S1004-9541(14)60020-3. [DOI] [Google Scholar]
- 25.Mulholland KL, Sylvester RW, Dyer JA. Sustainability: waste minimization, green chemistry and inherently safer processing. Environ Prog Sustain Energy. 2000;19(4):260–268. [Google Scholar]
- 26.Nichipor H, Dashouk E, Yacko S, Sun Y, Chmielewski AG, Zimek Z, BuŁka S. Kinetic modeling of benzene and toluene decomposition in air and in flue gas under electron beam irradiation. Radiat Phys Chem. 2012;81(5):572–579. doi: 10.1016/j.radphyschem.2012.01.006. [DOI] [Google Scholar]
- 27.Busi F, D'Angelantonio M, Mulazzani Q, Raffaelli V, Tubertini O. Radiation treatment of combustion gases: formulation and test of a reaction model. Radiat Phys Chem (1977) 1985;25(1–3):47–55. doi: 10.1016/0146-5724(85)90248-1. [DOI] [Google Scholar]
- 28.Mätzing H. Chemical kinetics of flue gas cleaning by irradiation with electrons. Adv Chem Phys. 1991;80:315–402. [Google Scholar]
- 29.Bohn B. Formation of peroxy radicals from OH− toluene adducts and O2. J Phys Chem A. 2001;105(25):6092–6101. doi: 10.1021/jp0033972. [DOI] [Google Scholar]
- 30.Bohn B, Zetzsch C. Gas-phase reaction of the OH–benzene adduct with O2: reversibility and secondary formation of HO2. Phys Chem Chem Phys. 1999;1(22):5097–5107. doi: 10.1039/a904887a. [DOI] [Google Scholar]
- 31.Raizer YP (1991) Gas discharge physics, Springer-Verlag.
- 32.Pârvulescu VI, Magureanu M, Lukes P. Plasma chemistry and catalysis in gases and liquids. New York: John Wiley & Sons; 2012. [Google Scholar]
- 33.Li Y, Fan Z, Shi J, Liu Z, Zhou J, Shangguan W. Removal of volatile organic compounds (VOCs) at room temperature using dielectric barrier discharge and plasma-catalysis. Plasma Chem Plasma Process. 2014;34(4):801–810. doi: 10.1007/s11090-014-9535-3. [DOI] [Google Scholar]
- 34.Karuppiah J, Reddy EL, Reddy PMK, Ramaraju B, Subrahmanyam C. Catalytic nonthermal plasma reactor for the abatement of low concentrations of benzene. Int J Environ Sci Technol. 2014;11(2):311–318. doi: 10.1007/s13762-013-0218-z. [DOI] [Google Scholar]
- 35.Tu X, Whitehead J. Plasma-catalytic dry reforming of methane in an atmospheric dielectric barrier discharge: understanding the synergistic effect at low temperature. Appl Catal B Environ. 2012;125:439–448. doi: 10.1016/j.apcatb.2012.06.006. [DOI] [Google Scholar]
- 36.Wang B, Chi C, Xu M, Wang C, Meng D. Plasma-catalytic removal of toluene over CeO2-MnOx catalysts in an atmosphere dielectric barrier discharge. Chem Eng J. 2017;322:679–692. doi: 10.1016/j.cej.2017.03.153. [DOI] [Google Scholar]
- 37.Rostami R, Moussavi G, Jafari AJ, Darbari S. Decomposition of benzene using wire-tube AC/DC discharge reactors. J Electrost. 2017;87:158–166. doi: 10.1016/j.elstat.2017.04.009. [DOI] [Google Scholar]
- 38.Wu J, Xia Q, Xiao J, Li Z. Chromium-based metal-organic framework MIL-101 as a highly effective catalyst in plasma for toluene removal. J Phys D Appl Phys. 2017;50(47):475202. doi: 10.1088/1361-6463/aa90f3. [DOI] [Google Scholar]
- 39.Bahri M, Haghighat F, Rohani S, Kazemian H. Metal organic frameworks for gas-phase VOCs removal in a NTP-catalytic reactor. Chem Eng J. 2017;320:308–318. doi: 10.1016/j.cej.2017.02.087. [DOI] [Google Scholar]
- 40.Jiang N, Qiu C, Guo L, Shang K, Lu N, Li J, Wu Y. Post plasma-catalysis of low concentration VOC over alumina-supported silver catalysts in a surface/packed-bed hybrid discharge reactor. Water Air Soil Pollut. 2017;228(3):113. doi: 10.1007/s11270-017-3296-6. [DOI] [Google Scholar]
- 41.Schiavon M, Schiorlin M, Torretta V, Brandenburg R, Ragazzi M. Non-thermal plasma assisting the biofiltration of volatile organic compounds. J Clean Prod. 2017;148:498–508. doi: 10.1016/j.jclepro.2017.02.008. [DOI] [Google Scholar]
- 42.Sudhakaran M, Trinh HQ, Karuppiah J, Hossian MM, Mok YS. Plasma catalytic removal of p-xylene from air stream using γ-Al2O3 supported manganese catalyst. Top Catal. 2017;60(12–14):944–954. doi: 10.1007/s11244-017-0759-3. [DOI] [Google Scholar]
- 43.Wang W, Fan X, Zhu T, Wang H, Ye D, Hong X. Removal of gas phase dimethylamine and N, N-dimethylformamide using non-thermal plasma. Chem Eng J. 2016;299:184–191. doi: 10.1016/j.cej.2016.04.045. [DOI] [Google Scholar]
- 44.Schiavon M, Scapinello M, Tosi P, Ragazzi M, Torretta V, Rada EC. Potential of non-thermal plasmas for helping the biodegradation of volatile organic compounds (VOCs) released by waste management plants. J Clean Prod. 2015;104:211–219. doi: 10.1016/j.jclepro.2015.05.034. [DOI] [Google Scholar]
- 45.Xu N, Fu W, He C, Cao L, Liu X, Zhao J, Pan H. Benzene removal using non-thermal plasma with CuO/AC catalyst: reaction condition optimization and decomposition mechanism. Plasma Chem Plasma Process. 2014;34(6):1387–1402. doi: 10.1007/s11090-014-9580-y. [DOI] [Google Scholar]
- 46.Ren Y, Li X, Ji S, Lu S, Buekens A, Yan J. Removal of gaseous HxCBz by gliding arc plasma in combination with a catalyst. Chemosphere. 2014;117:730–736. doi: 10.1016/j.chemosphere.2014.09.091. [DOI] [PubMed] [Google Scholar]
- 47.Zhu T, Wan Y, Li J, He X, Xu D, Shu X, Liang W, Jin Y. Volatile organic compounds decomposition using nonthermal plasma coupled with a combination of catalysts. Int J Environ Sci Technol. 2011;8(3):621–630. doi: 10.1007/BF03326247. [DOI] [Google Scholar]
- 48.Fan X, Zhu T, Wang M, Li X. Removal of low-concentration BTX in air using a combined plasma catalysis system. Chemosphere. 2009;75(10):1301–1306. doi: 10.1016/j.chemosphere.2009.03.029. [DOI] [PubMed] [Google Scholar]
- 49.Futamura S, Einaga H, Kabashima H, Hwan LY. Synergistic effect of silent discharge plasma and catalysts on benzene decomposition. Catal Today. 2004;89(1–2):89–95. doi: 10.1016/j.cattod.2003.11.014. [DOI] [Google Scholar]
- 50.Cal MP, Schluep M. Destruction of benzene with non-thermal plasma in dielectric barrier discharge reactors. Environ Prog Sustain Energy. 2001;20(3):151–156. [Google Scholar]
- 51.Sun W, Uddi M, Won SH, Ombrello T, Carter C, Ju Y. Kinetic effects of non-equilibrium plasma-assisted methane oxidation on diffusion flame extinction limits. Combust Flame. 2012;159(1):221–229. doi: 10.1016/j.combustflame.2011.07.008. [DOI] [Google Scholar]
- 52.Zhang H, Du C, Wu A, Bo Z, Yan J, Li X. Rotating gliding arc assisted methane decomposition in nitrogen for hydrogen production. Int J Hydrog Energy. 2014;39(24):12620–12635. doi: 10.1016/j.ijhydene.2014.06.047. [DOI] [Google Scholar]
- 53.Ramakers M, Michielsen I, Aerts R, Meynen V, Bogaerts A. Effect of argon or helium on the CO2 conversion in a dielectric barrier discharge. Plasma Process Polym. 2015;12(8):755–763. doi: 10.1002/ppap.201400213. [DOI] [Google Scholar]
- 54.Tao X, Bai M, Li X, Long H, Shang S, Yin Y, Dai X. CH4–CO2 reforming by plasma–challenges and opportunities. Prog Energy Combust Sci. 2011;37(2):113–124. doi: 10.1016/j.pecs.2010.05.001. [DOI] [Google Scholar]
- 55.Van Durme J, Dewulf J, Leys C, Van Langenhove H. Combining non-thermal plasma with heterogeneous catalysis in waste gas treatment: a review. Appl Catal B Environ. 2008;78(3–4):324–333. doi: 10.1016/j.apcatb.2007.09.035. [DOI] [Google Scholar]
- 56.Allah ZA, Whitehead JC. Plasma-catalytic dry reforming of methane in an atmospheric pressure AC gliding arc discharge. Catal Today. 2015;256:76–79. doi: 10.1016/j.cattod.2015.03.040. [DOI] [Google Scholar]