

Abstract
Renal proximal tubular angiotensinogen (AGT) is increased by hyperglycemia (HG) in diabetes mellitus, which augments intrarenal angiotensin II formation, contributing to the development of hypertension and kidney injury. Sodium-glucose cotransporter 2 (SGLT2) is abundantly expressed in proximal tubular cells (PTCs). The present study investigated the effects of canagliflozin (CANA), a SGLT2 inhibitor, on HG-induced AGT elevation in cultured PTCs. Mouse PTCs were treated with 5–25 mM glucose. CANA (0–10 µM) was applied 1 h before glucose treatment. Glucose (10 mM) increased AGT mRNA and protein levels at 12 h (3.06 ± 0.48-fold in protein), and 1 and 10 µM CANA as well as SGLT2 shRNA attenuated the AGT augmentation. CANA did not suppress the elevated AGT levels induced by 25 mM glucose. Increased AGT expression induced by treatment with pyruvate, a glucose metabolite that does not require SGLT2 for uptake, was not attenuated by CANA. In HG-treated PTCs, intracellular reactive oxygen species levels were elevated compared with baseline (4.24 ± 0.23-fold), and these were also inhibited by CANA. Furthermore, tempol, an antioxidant, attenuated AGT upregulation in HG-treated PTCs. HG-induced AGT upregulation was not inhibited by an angiotensin II receptor antagonist, indicating that HG stimulates AGT expression in an angiotensin II-independent manner. These results indicate that enhanced glucose entry via SGLT2 into PTCs elevates intracellular reactive oxygen species generation by stimulation of glycolysis and consequent AGT augmentation. SGLT2 blockade limits HG-induced AGT stimulation, thus reducing the development of kidney injury in diabetes mellitus.
Keywords: angiotensinogen, diabetes, proximal tubular cells, sodium-glucose cotransporter 2
INTRODUCTION
Diabetes mellitus (DM) is a common health issue, with increasing prevalence, that often leads to the development of associated end-organ damage, including nephropathy. Type 2 DM (T2DM) is a complex disease where hyperglycemia occurs as a result of the development of insulin resistance. In addition to the problems associated with poor glucose control, T2DM is often accompanied by high blood pressure and associated complications that lead to renal injury and diabetic nephropathy with consequent end-stage renal disease.
An inappropriately activated intrarenal renin-angiotensin system (RAS) promotes angiotensin II (ANG II) formation, causing sodium retention and increased arterial pressure and tissue injury. Intrarenal angiotensinogen (AGT), which is the precursor of angiotensin peptides, is produced predominantly in renal proximal tubular cells (PTCs) (16, 20, 45). Stimulation of proximal tubular AGT is regarded as a key mechanism in the activation of the intrarenal RAS (32). Elevated intrarenal AGT levels have been observed in animal models of both type 1 and type 2 DM (21, 29, 36, 51). Immunohistological analyses revealed that augmentation of AGT is induced mainly in proximal tubules in the kidneys of DM models, suggesting crucial roles of proximal tubular AGT upregulation in intrarenal RAS activation in DM. In vitro studies have elucidated mechanisms underlying AGT augmentation in PTCs under diabetic conditions. AGT expression levels are enhanced in rat PTCs cultured with high glucose (HG), and the HG-induced AGT augmentation is mediated by elevated intracellular reactive oxygen species (ROS) (1, 14). Furthermore, advanced glycation end products, which are produced under hyperglycemic conditions, have also been shown to stimulate AGT expression in PTCs (11). These findings indicate that diabetic conditions and associated pathogenic factors amplify proximal tubular AGT production, which can lead to the development of diabetic nephropathy and hypertension in DM.
The development of inhibitors of sodium-glucose cotransporter 2 (SGLT2) for the treatment of T2DM has shown promise for reducing the complications of DM, including high blood pressure, kidney injury, and cardiovascular damage (6, 38). This new class of antihyperglycemics lowers blood glucose by limiting glucose entry into PTCs through SGLT2, which is the predominant mechanism for glucose reabsorption in early proximal tubules, thus leading to elevated glucose excretion in the urine (8). Our recent study demonstrated that administration of canagliflozin (CANA), a SGLT2 inhibitor, suppresses augmentation of renal cortical AGT expression and mitigates the increases in blood pressure, renal tubular fibrosis, abnormal renal cell proliferation, and renal inflammation in a mouse model of T2DM (51). These results suggest that SGLT2 blockade can limit intrarenal AGT upregulation and the development of consequent kidney injury in T2DM (7, 51). The treatment with CANA normalized levels of blood glucose, blood pressure, intrarenal macrophages, and renal oxidative stress in the animal model (51). Since these pathophysiological factors have been shown to increase AGT expression levels (14, 31, 33, 34), it is still unclear whether blockage of glucose entry by SGLT2 inhibition can directly attenuate proximal tubular AGT augmentation in DM (2). Indeed, there is evidence that antagonists against ANG II receptors prevent HG-induced AGT augmentation in cultured PTCs (14), suggesting that cofactor(s) including ANG II mediates proximal tubular AGT upregulation under diabetic conditions. Thus, there are multiple factors that could be responsible for the attenuation of renal AGT expression after CANA administration. The present study demonstrates that glucose entry through SGLT2 without cofactors stimulates downstream intracellular mechanisms and consequent AGT expression. Furthermore, the data link the blockade of SGLT2 with the decreased renal AGT expression, providing a molecular mechanism for the antihypertensive effects of SGLT2 inhibition.
MATERIALS AND METHODS
Cell culture.
Since 80–90% of filtered glucose is reabsorbed via SGLT2 mainly in the early segment of nephrons (12), an established PTC line, which has been characterized as an early segment PTC line, was used in this study (13). Immortalized mouse PTCs isolated from male mice were used in this study (13). SGLT2 expression in this cell line was confirmed by Western blot analysis (data not shown). PTCs were cultured in accordance with a standard protocol established by the provider. A growth medium (DMEM-F-12, 1:1, Invitrogen) containing 5 mM glucose, 15 mM HEPES, 0.06% NaHCO3, 5 µg/ml transferrin, 4 µg/ml dexamethasone, 2 mM l-glutamine, 50 µM ascorbic acid 2-phosphate, 20 nM selenium, 1 nM tri-iodothyronine, 5 µg/ml insulin, 10 ng/ml epithelial growth factor, 10 ng/ml mouse interferon-γ, and 5% FBS was used to maintain PTCs at 33°C. The supplements for the medium were purchased from Invitrogen, Sigma-Aldrich, and Fisher Scientific. When cultured PTCs were used in experiments, cells were plated on six-well plates and transferred to a 37°C CO2 incubator. Since some supplements in the growth medium, including dexamethasone, insulin, and interferon-γ, have been shown to alter AGT expression levels in PTCs (14, 42, 48), starving and treatments of PTCs were performed with standard DMEM (Invitrogen). Before HG treatment, cells were rinsed with PBS and incubated in serum-free medium for 48 h at 37°C. Because sodium pyruvate is an energy source used by the mitochondria and would interfere with the experimental conditions, cells were serum starved in pyruvate-free DMEM, which was supplemented with 5 mM glucose. Thereafter, PTCs were exposed to glucose levels chosen for their clinical and physiological relevance. During treatment, cells were treated with DMEM supplemented with d-glucose to a final concentration 5–25 mM. Five millimolars, representing a normal plasma glucose level, was used as the control condition (NG); 10, 15, and 25 mM represent elevated plasma glucose and severe hyperglycemic conditions, respectively (9). Because of the results in experiments using different concentrations of glucose (Fig. 1, A–D), 10 or 15 mM glucose was used as HG in other experiments. CANA, a SGLT2 inhibitor, was provided by Janssen and dissolved in DMSO. When cells were treated with CANA, cells in the control group received the same concentration of DMSO. An active form of Olmesartan [RNH-6270, an ANG II type 1 receptor (AT1R) blocker] was used to investigate roles of ANG II in AGT regulation.
Fig. 1.

Effects of canagliflozin (CANA) on high-glucose (HG)-induced angiotensinogen (AGT) protein augmentation in proximal tubular cells (PTCs). Temporal changes in AGT protein levels by treatments of PTCs with 5 mM glucose (A), 10 mM glucose (B), and 25 mM glucose (C) were evaluated by Western blot analyses (n = 4). A pooled cell lysate sample was applied to all Western blot gels used in the experiments, and band intensities of AGT and β-actin in the pooled sample were used to normalize minor technical variability among membranes. Dotted lines indicate AGT levels in PTCs that received 10 mM CANA treatment. D: merged data without error bars. AGT and sodium-glucose cotransporter 2 (SGLT2) mRNA levels in normal glucose (NG; 5 mM glucose)-treated and HG (10 mM glucose)-treated cells are shown in E (n = 6) and F (n = 6), respectively. Data are expressed as means ± SE. *P < 0.05, significant difference vs. the NG group; †P < 0.05, significant difference vs. the HG (non-CANA) group.
Antibodies.
Rabbit anti-mouse AGT antibody from IBL America (catalog no. 28101) was used in this study. Rabbit anti-mouse SGLT2 antibody was purchased from Santa Cruz Biotechnology (catalog no. sc-47402). Mouse anti-β-actin antibody from Abcam (catalog no. ab8226) was used as an internal control. IRDye-labeled anti-mouse IgG and anti-rabbit IgG antibodies were obtained from Li-Cor (catalog nos. 926-32220 and 926-32211, respectively) as secondary antibodies in Western blot analyses.
Western blot analysis.
AGT protein levels were determined using Western blot analysis. Western blots were performed as previously described (41, 42). Cells were homogenized with 60 μL lysis buffer containing 1% Triton X-100, 150 mmol/L NaCl, 1 mmol/L EDTA, 1% Nonidet P-40, 1 mmol/L Na3VO4, and 0.25% protease inhibitor cocktail (Sigma). Lysates were sonicated three times for 10 s each. Total protein concentration of the supernatant was quantified using a Micro BCA Protein Assay Kit (Pierce). Then, 20 µg total protein was applied to a precast NuPAGE 4–12% gel (Invitrogen). The separated proteins were transferred to a nitrocellulose membrane (Bio-Rad). After incubation of the membrane with primary and second antibodies, detection and analysis were performed using the Odyssey System (Li-Cor). Data were normalized based on mouse β-actin protein expression levels. When experiments required more than one membrane to analyze multiple samples, a positive control cell lysate was used to normalize minor technical variability among the membranes.
Droplet digital PCR.
Droplet digital PCR (ddPCR) was performed to determine target mRNA copies in PTCs, as previously described (25, 51). Total RNA was isolated using a commercially available RNA isolation kit (Qiagen). RNA concentration was quantified using Nanodrop 2000 (Thermo Scientific). ddPCR was performed using a Bio-Rad ddPCR system. Primers, probes, and reagents for the One-step RT-ddPCR system were purchased from Bio-Rad to generate cDNA and quantify gene expression. After droplet generation and PCR amplification, droplets were analyzed on the QX200 droplet reader, and target cDNA concentration was determined using the QuantaSoft analysis software (Bio-Rad). For each target gene, the amount of total RNA in a PCR reaction was determined with a pilot ddPCR, using serially diluted total RNA, in which the determined amount is in a linear range. Data are expressed as copy numbers of target gene in 1 ng total RNA. Experimental and biological replicates were applied.
Intracellular ROS measurement in live cells.
Intracellular ROS generation in PTCs cultured on 24-well plates was detected using 2′,7′-dichlorodihydrofluorescein diacetate (H2DCF-DA; Life Technologies); 10 mM working stock was prepared in DMSO and made fresh for each use. When exposed to ROS, H2DCF-DA is oxidized to produce the fluorescent molecule DCF. After 11 h of treatment in NG or HG, cells were treated with 20 µM H2DCF-DA or DMSO (vehicle control) at 37°C for 1 h. After incubation, cell culture medium was aspirated, and cells were rinsed three times in PBS. Thereafter, fluorescence was detected using a FLUOstar OPTIMA microplate reader (BMG Labtech) using a 492-nm excitation filter and 520-nm emission filter. Live-cell images were captured using an EVOS Fl microscope (AMG).
SGLT2 gene knockdown.
SGLT2 knockdown was performed in PTCs using shRNA plasmid (Creative Biogene) targeting base 628 of the mouse SGLT2 gene using the following sequence: 5′-GCCTTCATCCTCACTGGTTAT-3′. A negative control shRNA plasmid was also used. Escherichia coli cells containing the plasmid were grown in LB broth supplemented with kanamycin (50 µg/mL). Plasmid DNA was harvested using a QIAprep Spin Miniprep Kit (Qiagen) and eluted in ddH2O to a final concentration of 1.1 µg/mL. The purified plasmid was transfected into PTCs using electroporation (Neon Transfection System, Invitrogen), and the cells were cultured on 24-well plates. After transfection with anti-SGLT2 or negative control plasmid, cells were serum starved for 48 h at 37°C. Cells were then treated with NG or HG.
Statistical analysis.
Data are expressed as means ± SE. Data were analyzed using Student’s t test or one-way ANOVA followed by a post hoc Bonferroni-Dunn multiple comparison test. P values of <0.05 were considered statistically significant.
RESULTS
Effects of CANA on HG-induced AGT protein augmentation in PTCs.
We tested whether direct treatment with CANA attenuates HG-induced AGT upregulation. A positive control cell lysate sample was applied to all Western blot gels, and band intensities of AGT and β-actin in the pooled sample were used to normalize minor technical variability among membranes. Incubation in 5 mM glucose did not alter AGT protein levels at 6, 12, and 24 h compared with levels at 3 h (n = 4; Fig. 1A). Furthermore, 10 µM CANA treatment did not alter expression levels at all tested time points. However, incubation in 10 mM glucose stimulated AGT expression for up to 12 h and was sustained for up to 24 h (Fig. 1B). CANA treatment of cells treated with 10 mM glucose significantly attenuated the AGT augmentation at 12 and 24 h (54.9 ± 0.02% suppression by CANA at 12 h). In contrast, CANA treatment did not inhibit the augmentation of AGT expression in PTCs treated with 25 mM glucose (Fig. 1C), suggesting competitive interaction between glucose and CANA and/or glucose uptake facilitated by other glucose transporters at very high glucose levels. Treatment of PTCs with a high concentration of d-mannitol (5 mM glucose + 20 mM mannitol) did not show greater AGT expression levels compared with the NG-treated group (data not shown), suggesting that increased osmolality by HG does not affect AGT expression in PTCs. Since these results indicate that maximal induction of AGT expression was achieved by 10 mM glucose (Fig. 1D), 10 or 15 mM glucose was used as the HG treatment in the following experiments.
Changes in AGT mRNA expression in PTCs were also investigated using ddPCR (n = 6; Fig. 1E). Treatment of PTCs with HG (10 mM) markedly increased AGT mRNA levels at 12 h (30.9 ± 5.3 copies/ng RNA in the NG group vs. 329.4 ± 24.0 copies/ng RNA in the HG group). CANA treatment at 10 μΜ attenuated HG-induced AGT mRNA augmentation in PTCs (100.5 ± 10.7 copies/ng RNA), supporting the protein data.
Moreover, SGLT2 expression levels were determined using ddPCR (n = 6; Fig. 1F). SGLT2 mRNA levels were higher in the HG-treated group than in the NG-treated group (47.2 ± 2.7 copies/ng RNA in the NG group vs. 100.4 ± 12.9 copies/ng RNA in the HG group). The elevated SGLT2 expression in the HG-treated group was normalized by CANA treatment.
Dose dependency of CANA on HG-induced AGT augmentation in PTCs.
CANA attenuated the augmentation of AGT by 10 mM glucose in a dose-dependent manner (n = 4; Fig. 2). CANA (1 μΜ) partially, but significantly, suppressed AGT augmentation at 12 h. CANA (10 μΜ) exhibited further inhibition on AGT upregulation (35.1 ± 0.07% suppression by 1 µM CANA and 54.1 ± 0.08% suppression by 10 µM CANA).
Fig. 2.

Dose dependency of canagliflozin (CANA) on high glucose (HG)-induced angiotensinogen (AGT) augmentation in proximal tubular cells (PTCs). AGT protein levels by treatment with different concentrations of CANA at 12 h were evaluated by Western blot analyses (n = 4). HG-treated groups received 10 mM glucose. Data are expressed as means ± SE. *P < 0.05, significant difference vs. the normal glucose (NG) group; †P < 0.05, significant difference vs. the HG (non-CANA) group.
Effects of SGLT2 knockdown on HG-induced AGT augmentation in PTCs.
Since CANA attenuated HG-induced AGT augmentation in PTCs, as shown in Figs. 1 and 2, we confirmed roles of SGLT2 using a specific shRNA targeting the SGLT2 gene (n = 3; Fig. 3). PTCs were transfected with plasmid DNA expressing SGLT2 shRNA or negative control shRNA. Transfection with SGLT2 shRNA resulted in a 72.6 ± 4.2% reduction of SGLT2 expression compared with PTCs that received negative control shRNA (Fig. 3A). AGT protein levels were increased by HG (15 mM) in cells that received negative control plasmid (5.65 ± 0.62-fold, ratio to the control group; Fig. 3B). However, HG did not augment AGT protein in cells expressing the shRNA sequence, suggesting that SGLT2 knockdown prevented the enhancing effects of HG.
Fig. 3.
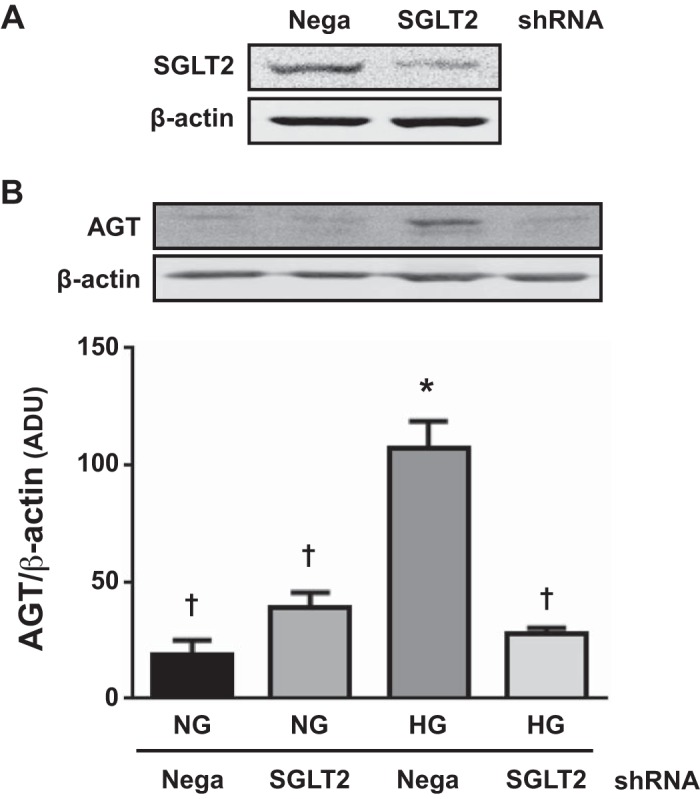
Effects of sodium-glucose cotransporter 2 (SGLT2) knockdown on high glucose (HG)-induced angiotensinogen (AGT) augmentation in proximal tubular cells (PTCs). In addition to experiments using canagliflozin (CANA), SGLT2 gene knockdown was performed. Cells received negative control shRNA (Nega) or SGLT2-specific shRNA (SGLT2). HG-treated groups received 15 mM glucose for 12 h. SGLT2 (A) and AGT (B) protein levels were determined by Western blot analyses (n = 3). Data are expressed as means ± SE. *P < 0.05, significant difference vs. the normal glucose (NG) group; †P < 0.05, significant difference vs. the HG (non-CANA) group.
Effects of pyruvate on AGT mRNA expression in PTCs.
Increased glucose uptake results in elevations in intracellular pyruvate. To test whether increased intracellular glucose metabolism promotes AGT expression in PTCs, we treated PTCs with sodium pyruvate (n = 4; Fig. 4). Pyruvate (5 mM) treatment enhanced AGT expression in PTCs (16.5 ± 1.8 copies/ng RNA in the NG group and 387.9 ± 59.4 copies/ng RNA in the NG + pyruvate-treated group). CANA treatment did not attenuate pyruvate-induced AGT augmentation in PTCs (501.2 ± 115.1 copies/ng RNA in the NG + pyruvate + CANA-treated group).
Fig. 4.
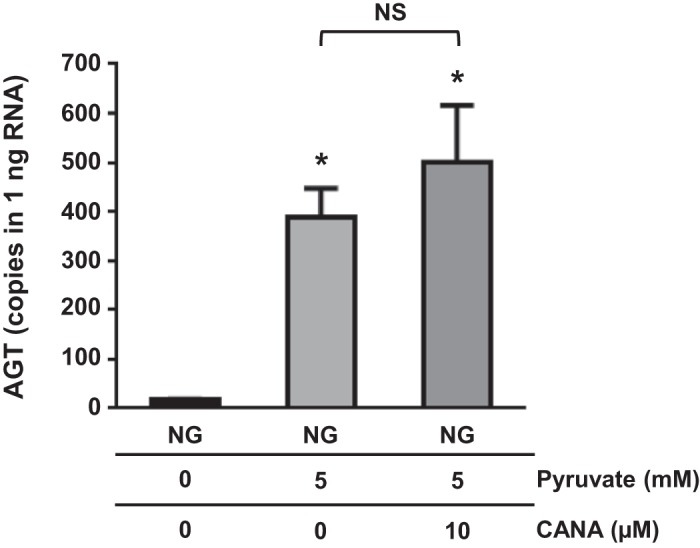
Effects of pyruvate on angiotensinogen (AGT) mRNA expression in proximal tubular cells (PTCs). PTCs were treated with 5 mM pyruvate under normal glucose (NG) conditions. AGT mRNA levels were evaluated by droplet digital PCR (n = 4). Data are expressed as means ± SE. *P < 0.05, significant difference vs. the NG group.
Effects of CANA on intracellular ROS generation in PTCs.
In vivo and in vitro studies have demonstrated that elevated ROS mediates HG-induced AGT upregulation in PTCs (5, 14). Thus, effects of CANA on intracellular ROS generation in PTCs were investigated (n = 5; Fig. 5). Treatment of PTCs with HG (10 mM) resulted in elevation of intracellular ROS generation (4.24 ± 0.23-fold, ratio to baseline). In HG-treated cells, CANA treatment suppressed intracellular ROS levels to lower than the baseline. Furthermore, CANA decreased intracellular ROS levels even under the NG condition.
Fig. 5.

Effects of canagliflozin (CANA) on intracellular reactive oxygen species (ROS) generation in proximal tubular cells (PTCs). Intracellular ROS levels were quantified using 2′,7′-dichlorodihydrofluorescein diacetate (n = 5; A). High glucose (HG)-treated groups received 10 mM glucose. Furthermore, effect of tempol, a ROS scavenger, on high glucose (HG)-induced angiotensinogen (AGT) mRNA (B) and protein (C) augmentations was tested. Data are expressed as means ± SE. *P < 0.05, significant difference vs. the normal glucose (NG) group; †P < 0.05, significant difference vs. the HG (non-CANA) group.
A previous study reported that ROS inhibition prevents enhancement of AGT expression in HG-treated PTCs (14). Thus, we also evaluated whether tempol, a superoxide dismutase mimetic, attenuates HG-induced AGT upregulation in our model. Both AGT mRNA (n = 4; Fig. 5B) and protein (n = 6; Fig. 5C) levels were higher in HG-treated PTCs compared with NG-treated PTCs. Pretreatment with 2.5 mM tempol prevented the augmentation of AGT expression.
Effects of an ANG II receptor inhibitor on HG-induced AGT augmentation in PTCs.
Antagonizing ANG II receptors has also been shown to suppress HG (25 mM)-induced AGT upregulation in PTCs (14), suggesting that activation of endogenous ANG II receptors mediates the AGT elevation. In the present study, PTCs were pretreated with 1 mM active olmesartan, an inhibitor against AT1Rs. Furthermore, 25 mM glucose was used in this experiment to induce the maximum AGT augmentation and consequent ANG II formation as in the previous study (14). Although HG treatment did not alter AT1R expression levels (n = 4; Fig. 6A), HG treatment enhanced AGT expression in PTCs (128.3 ± 16.8-fold, ratio to the control group; Fig. 6B). The increased AGT levels in HG-treated PTCs were not attenuated by olmesartan (124.9 ± 11.7-fold in the HG + olmesartan-treated group, ratio to the control group).
Fig. 6.

Effects of an angiotensin II type 1 receptor (AT1R) inhibitor on high glucose (HG)-induced angiotensinogen (AGT) augmentation in proximal tubular cells (PTCs). Contribution of activated AT1Rs to HG-induced AGT augmentation in PTCs was investigated using olmesartan, an AT1R antagonist (n = 4). A: AT1R mRNA expression levels. B: changes in AGT levels. HG-treated groups received 25 mM glucose. Data are expressed as means ± SE. *P < 0.05, significant difference vs. the normal glucose (NG) group.
DISCUSSION
Our findings demonstrate that CANA attenuates HG-induced ROS generation and AGT upregulation in PTCs. Our previous report described the ability of CANA treatment to reduce renal AGT expression and associated hypertension and related kidney injury in vivo. The present study elucidates the molecular mechanism underlying these effects.
Kidney disease leading to end-stage renal disease is a major complication in DM, occurring in ~40% of patients (46). Many basic and clinical investigations have demonstrated renoprotective effects of RAS blockers in the development of diabetic nephropathy (52). Thus, intrarenal RAS has been a target to treat diabetic nephropathy. As a key mechanism in the activation of the intrarenal RAS under diabetic conditions, elevation of proximal tubular AGT production has been shown in both type 1 and type 2 DM (5, 21, 29, 36). Selective SGLT2 inhibitors, which reduce glucose reabsorption in renal proximal tubules, have been developed to improve glycemic control in patients with T2DM (47). Our previous study showed that the augmentation of intrarenal AGT expression in T2DM mice is prevented by CANA treatment (51). The results of the present study show that CANA attenuates the enhanced AGT expression in PTCs under HG conditions, indicating that glucose entry via SGLT2 directly contributes to AGT augmentation in diabetic kidneys. Results obtained from PTCs with suppressed SGLT2 expression caused by shRNA provide further support for this finding. Although CANA prevented the effect on AGT augmentation of 10 mM glucose, CANA did not suppress the increased AGT levels stimulated by 25 mM glucose. A previous study demonstrated augmentation of glucose transporter 2 in patients with DM (39). Thus, other glucose transporters may facilitate glucose uptake under hyperglycemic conditions. Alternatively, there may be a competitive interaction between CANA and glucose underlying PTC uptake of glucose that is overwhelmed by excessive glucose concentrations. To put these glucose effects in perspective, a continuous glucose monitoring study has demonstrated that blood glucose concentrations in patients with controlled T2DM rarely exceed 15 mM (3). Therefore, SGLT2 inhibition can still be an effective therapy to prevent and/or mitigate the development of diabetic nephropathy. In fact, not only intrarenal AGT augmentation but also the degree of hypertension and kidney injury were attenuated by CANA treatments in T2DM (51, 53).
In our experiments, 1 and 10 µM CANA significantly attenuated 10 mM HG-induced AGT elevation in PTCs. The IC50 values of CANA on glucose uptake via human SGLT2 is less than 10 nM (23), which is much lower than the effective concentrations of CANA on AGT upregulation determined in the present study. It has been reported that 99% of CANA is absorbed by albumin contained in FBS for cell cultures (40). This may be a reason that high doses of CANA, such as more than 1 µM, are required to exhibit significance in many in vitro investigations, including in the present study (15, 18, 27).
SGLT2 is expressed mainly in S1 and S2 segments of proximal tubules (12). Therefore, SGLT2 inhibition may not directly attenuate hyperglycemia-induced AGT elevation in the S3 segment. Recent studies have revealed that there is much greater AGT expression in the S2 and S3 segments than in the S1 segment in the kidneys (19, 37). Taken together, SGLT2 inhibitors can directly prevent or attenuate AGT augmentation in the early segments of proximal tubules in DM, as shown in the present study, and blunt enhanced AGT expression in the S3 segment due to reduced blood glucose levels. In fact, several studies have attempted to show suppressive effects of SGLT2 inhibitors on elevated intrarenal AGT in DM. Administration of dapagliflozin, a SGLT2 inhibitor, in T2DM rats attenuated elevated urinary AGT excretion (43). In patients with T2DM, SGLT2 inhibition exhibited a decreasing, but not significant, trend in urinary AGT excretion rates (54). In contrast, the db/db mouse model of T2DM exhibited decreased renal AGT mRNA expression that was enhanced by treatment with a SGLT2 inhibitor (49). Furthermore, elevated urinary AGT levels in response to empagliflozin treatment of the Otsuka Long-Evans Tokushima fatty DM rat (44) have been reported. Therefore, the effects of SGLT2 inhibition on intrarenal and/or urinary AGT augmentation in T2DM may be dependent on the animal model used. It has been proposed that excessive delivery of glucose to the S3 segment by inhibition of glucose reabsorption in the S1 and S2 segments transiently results in stimulation of AGT expression in the S3 segment, explaining the inconsistent findings on effects of SGLT2 inhibition on urinary and/or kidney AGT regulation (2). As mentioned above, normalization of blood glucose levels by SGLT2 inhibition may finally attenuate the AGT augmentation in the S3 segment.
Changes in SGLT2 expression in PTCs under diabetic conditions are inconsistent. A previous study using the HK-2 cell line, a human PTC line, reported that excessive HG (30 mM) treatment did not alter SGLT2 expression levels (35). On the other hand, our previous animal study demonstrated that renal cortical SGLT2 expression was greater in T2DM mice compared with control mice (51). In the present study using an in vitro setting, HG (10 mM) increased levels of SGLT2 transcripts in PTCs, and CANA attenuated the augmentation, supporting findings in the previous animal study (51). Thus, CANA may help reduce blood glucose levels in T2DM by blockade of glucose reabsorption via SGLT2 and normalizing SGLT2 expression in PTCs.
Since SGLT2 is a sodium-glucose cotransporter, SGLT2 inhibition also lowers sodium reabsorption in proximal tubules (4). This manipulation of sodium uptake may influence AGT regulation. To test whether it was the increased glycolysis associated with increased glucose uptake that promotes increases in AGT expression, we treated cells with pyruvate, a glucose metabolite that does not require SGLT2 to enter the cell. Applying pyruvate instead of HG also augmented AGT expression in PTCs, but CANA treatment did not influence the pyruvate effect. These findings suggest that glucose entry via SGLT2 leading to enhanced glycolysis, but not sodium influx via SGLT2, plays important roles in proximal tubular AGT augmentation in DM.
Elevated ROS has been identified as a crucial contributor to intrarenal AGT upregulation under diabetic conditions (5, 14, 29). Treatment of PTCs with a ROS scavenger also resulted in normalizing AGT expression in HG-treated PTCs in this study, indicating that elevated ROS mediates the AGT augmentation. These findings indicate that CANA treatment suppressed intrarenal AGT levels by lowering or preventing oxidative stress in T2DM mice (51). A recent study has identified downstream factors of ROS, including nuclear factor erythroid 2-related factor 2, in proximal tubular AGT regulation in DM (1). Further investigations will elucidate intracellular mechanisms participating in SGLT2-mediated AGT regulation in renal proximal tubules.
Numerous pathophysiological factors are altered in diabetic conditions. SGLT2 inhibition also reduces blood pressure, renal immune cell infiltration, fibrotic factors, and advanced glycation end product levels in DM (10, 24, 26, 50, 51); these factors may potentiate AGT expression in PTCs (11, 14, 31, 33, 34). Moreover, renal ANG II, which is increased further by elevated AGT production in PTCs or by intracellular de novo mechanisms, also contributes to proximal tubular AGT augmentation (22, 41). A previous study has shown that AT1R inhibition prevents HG-induced AGT augmentation in cultured PTCs (14), suggesting that cofactor(s) including ANG II mediate proximal tubular AGT upregulation under diabetic conditions. In the present study, 1 µM olmesartan, an AT1R blocker, did not limit AGT augmentation in HG-treated PTCs, whereas that dose of olmesartan has been shown to inhibit AGT augmentation by ANG II and a cytokine in PTCs (41). Accordingly, AT1Rs may not be required for HG-induced AGT augmentation in PTCs. The inconsistency between the previous finding and the results in the present study may be due to the cell lines used in the studies. We used mouse PTCs, which were characterized as cells in the early proximal tubular segment (S1 segment). However, expression of renin, which processes AGT to produce angiotensin, mRNA, and its activity were detected in the S2 segment (30). Thus, AGT may be regulated by HG, ANG II, and other factors in more distal proximal tubular segments. However, factors such as proinflammatory cytokines, fibrotic factors, and advanced glycation end products are unlikely to be participating in HG-induced AGT augmentation in our in vitro setting. In the present study, augmentation of AGT expression by HG was already observed at 6 h and later time points. Thus, even though PTCs produce and secrete these pathogenic factors during short-term HG treatments, they would have been diluted by the medium. These results suggest that glucose entry through SGLT2 without cofactors stimulates AGT expression in PTCs derived from the early segment.
In conclusion, this study demonstrated that enhanced glucose entry via SGLT2 into PTCs elevates intracellular ROS generation by stimulation of glycolysis and consequent AGT augmentation. Thus, SGLT2 inhibition limits HG-induced upregulation of renal AGT stimulation. These findings provide a basis for the mitigation of the development of hypertension and kidney injury in DM by CANA and suggest possible mechanistic explanations of the clinical results of trials like the Canagliflozin Cardiovascular Assessment Study (CANVAS) and Canagliflozin and Renal Events in Diabetes with Established Nephropathy Clinical Evaluation (CREDENCE), in which CANA improved cardiovascular and renal outcomes to an extent that cannot be explained by the glucose-lowering properties of the drug (17, 28).
GRANTS
This work was supported by Janssen Pharmaceuticals Grant 28431754DIA4010 (to L. G. Navar), National Institute of General Medical Sciences IDeA Program (COBRE) Grant P30-GM-103337 (to L. G. Navar), National Heart, Lung, and Blood Institute Grant R01-HL-127092 (to T. C. Woods), National Institute of Diabetes and Digestive and Kidney Diseases Grant R01-DK-107694 (to R. Satou), American Heart Asscoiation 2015 Winter Predoctoral Fellowship 15PRE25090156 (to M. W. Cypress), and National Institute of Diabetes and Digestive and Kidney Diseases-National Research Service Award 1F31-DK-107185-01 (to M. W. Cypress).
DISCLOSURES
This study was supported by a grant from Janssen Pharmaceuticals, Inc., the manufacturer of canagliflozin.
AUTHOR CONTRIBUTIONS
R.S., T.C.W., V.A.F., and L.G.N. conceived and designed research; R.S., M.W.C., T.C.W., A.K., and C.M.D. performed experiments; R.S., M.W.C., T.C.W., A.K., and C.M.D. analyzed data; R.S., M.W.C., T.C.W., A.K., C.M.D., V.A.F., and L.G.N. interpreted results of experiments; R.S., T.C.W., and A.K. prepared figures; R.S., T.C.W., and L.G.N. drafted manuscript; R.S., M.W.C., T.C.W., A.K., C.M.D., V.A.F., and L.G.N. edited and revised manuscript; R.S., M.W.C., T.C.W., A.K., C.M.D., V.A.F., and L.G.N. approved final version of manuscript.
ACKNOWLEDGMENTS
We are grateful to Dr. U. Hopfer (Case Western Reserve University) for providing established PTCs. We thank Dr. K. Miyata and D. J. Lightell, Jr. (Tulane University), for excellent technical assistance.
REFERENCES
- 1.Abdo S, Shi Y, Otoukesh A, Ghosh A, Lo CS, Chenier I, Filep JG, Ingelfinger JR, Zhang SL, Chan JS. Catalase overexpression prevents nuclear factor erythroid 2-related factor 2 stimulation of renal angiotensinogen gene expression, hypertension, and kidney injury in diabetic mice. Diabetes 63: 3483–3496, 2014. doi: 10.2337/db13-1830. [DOI] [PMC free article] [PubMed] [Google Scholar]
- 2.Ansary TM, Nakano D, Nishiyama A. Diuretic effects of sodium glucose cotransporter 2 inhibitors and their influence on the renin-angiotensin system. Int J Mol Sci 20: 629, 2019. doi: 10.3390/ijms20030629. [DOI] [PMC free article] [PubMed] [Google Scholar]
- 3.Beck RW, Riddlesworth TD, Ruedy K, Ahmann A, Haller S, Kruger D, McGill JB, Polonsky W, Price D, Aronoff S, Aronson R, Toschi E, Kollman C, Bergenstal R; DIAMOND Study Group . Continuous glucose monitoring versus usual care in patients with type 2 diabetes receiving multiple daily insulin injections: a randomized trial. Ann Intern Med 167: 365–374, 2017. doi: 10.7326/M16-2855. [DOI] [PubMed] [Google Scholar]
- 4.Brady JA, Hallow KM. Model-based evaluation of proximal sodium reabsorption through SGLT2 in health and diabetes and the effect of inhibition with canagliflozin. J Clin Pharmacol 58: 377–385, 2018. doi: 10.1002/jcph.1030. [DOI] [PubMed] [Google Scholar]
- 5.Brezniceanu ML, Liu F, Wei CC, Tran S, Sachetelli S, Zhang SL, Guo DF, Filep JG, Ingelfinger JR, Chan JS. Catalase overexpression attenuates angiotensinogen expression and apoptosis in diabetic mice. Kidney Int 71: 912–923, 2007. doi: 10.1038/sj.ki.5002188. [DOI] [PubMed] [Google Scholar]
- 6.Briasoulis A, Al Dhaybi O, Bakris GL. SGLT2 inhibitors and mechanisms of hypertension. Curr Cardiol Rep 20: 1, 2018. doi: 10.1007/s11886-018-0943-5. [DOI] [PubMed] [Google Scholar]
- 7.Burns KD, Cherney D. Renal angiotensinogen and sodium-glucose cotransporter-2 inhibition: insights from experimental diabetic kidney disease. Am J Nephrol 49: 328–330, 2019. doi: 10.1159/000499598. [DOI] [PubMed] [Google Scholar]
- 8.DeFronzo RA, Norton L, Abdul-Ghani M. Renal, metabolic and cardiovascular considerations of SGLT2 inhibition. Nat Rev Nephrol 13: 11–26, 2017. doi: 10.1038/nrneph.2016.170. [DOI] [PubMed] [Google Scholar]
- 9.Engelgau MM, Narayan KM, Herman WH. Screening for type 2 diabetes. Diabetes Care 23: 1563–1580, 2000. doi: 10.2337/diacare.23.10.1563. [DOI] [PubMed] [Google Scholar]
- 10.Foote C, Perkovic V, Neal B. Effects of SGLT2 inhibitors on cardiovascular outcomes. Diab Vasc Dis Res 9: 117–123, 2012. doi: 10.1177/1479164112441190. [DOI] [PubMed] [Google Scholar]
- 11.Garagliano JM, Katsurada A, Miyata K, Derbenev AV, Zsombok A, Navar LG, Satou R. Advanced glycation end products stimulate angiotensinogen production in renal proximal tubular cells. Am J Med Sci 357: 57–66, 2019. doi: 10.1016/j.amjms.2018.10.008. [DOI] [PMC free article] [PubMed] [Google Scholar]
- 12.Ghezzi C, Loo DDF, Wright EM. Physiology of renal glucose handling via SGLT1, SGLT2 and GLUT2. Diabetologia 61: 2087–2097, 2018. doi: 10.1007/s00125-018-4656-5. [DOI] [PMC free article] [PubMed] [Google Scholar]
- 13.Hopfer U, Jacobberger JW, Gruenert DC, Eckert RL, Jat PS, Whitsett JA. Immortalization of epithelial cells. Am J Physiol Cell Physiol 270: C1–C11, 1996. doi: 10.1152/ajpcell.1996.270.1.C1. [DOI] [PubMed] [Google Scholar]
- 14.Hsieh TJ, Fustier P, Wei CC, Zhang SL, Filep JG, Tang SS, Ingelfinger JR, Fantus IG, Hamet P, Chan JS. Reactive oxygen species blockade and action of insulin on expression of angiotensinogen gene in proximal tubular cells. J Endocrinol 183: 535–550, 2004. doi: 10.1677/joe.1.05871. [DOI] [PubMed] [Google Scholar]
- 15.Hung MH, Chen YL, Chen LJ, Chu PY, Hsieh FS, Tsai MH, Shih CT, Chao TI, Huang CY, Chen KF. Canagliflozin inhibits growth of hepatocellular carcinoma via blocking glucose-influx-induced β-catenin activation. Cell Death Dis 10: 420, 2019. doi: 10.1038/s41419-019-1646-6. [DOI] [PMC free article] [PubMed] [Google Scholar]
- 16.Ingelfinger JR, Zuo WM, Fon EA, Ellison KE, Dzau VJ. In situ hybridization evidence for angiotensinogen messenger RNA in the rat proximal tubule. An hypothesis for the intrarenal renin angiotensin system. J Clin Invest 85: 417–423, 1990. doi: 10.1172/JCI114454. [DOI] [PMC free article] [PubMed] [Google Scholar]
- 17.Jardine MJ, Mahaffey KW, Neal B, Agarwal R, Bakris GL, Brenner BM, Bull S, Cannon CP, Charytan DM, de Zeeuw D, Edwards R, Greene T, Heerspink HJL, Levin A, Pollock C, Wheeler DC, Xie J, Zhang H, Zinman B, Desai M, Perkovic V; CREDENCE study investigators . The canagliflozin and renal endpoints in diabetes with established nephropathy clinical evaluation (CREDENCE) study rationale, design, and baseline characteristics. Am J Nephrol 46: 462–472, 2017. doi: 10.1159/000484633. [DOI] [PMC free article] [PubMed] [Google Scholar]
- 18.Kaji K, Nishimura N, Seki K, Sato S, Saikawa S, Nakanishi K, Furukawa M, Kawaratani H, Kitade M, Moriya K, Namisaki T, Yoshiji H. Sodium glucose cotransporter 2 inhibitor canagliflozin attenuates liver cancer cell growth and angiogenic activity by inhibiting glucose uptake. Int J Cancer 142: 1712–1722, 2018. doi: 10.1002/ijc.31193. [DOI] [PubMed] [Google Scholar]
- 19.Kamiyama M, Garner MK, Farragut KM, Kobori H. The establishment of a primary culture system of proximal tubule segments using specific markers from normal mouse kidneys. Int J Mol Sci 13: 5098–5111, 2012. doi: 10.3390/ijms13045098. [DOI] [PMC free article] [PubMed] [Google Scholar]
- 20.Kamiyama M, Garner MK, Farragut KM, Sofue T, Hara T, Morikawa T, Konishi Y, Imanishi M, Nishiyama A, Kobori H. Detailed localization of augmented angiotensinogen mRNA and protein in proximal tubule segments of diabetic kidneys in rats and humans. Int J Biol Sci 10: 530–542, 2014. doi: 10.7150/ijbs.8450. [DOI] [PMC free article] [PubMed] [Google Scholar]
- 21.Kamiyama M, Zsombok A, Kobori H. Urinary angiotensinogen as a novel early biomarker of intrarenal renin-angiotensin system activation in experimental type 1 diabetes. J Pharmacol Sci 119: 314–323, 2012. doi: 10.1254/jphs.12076FP. [DOI] [PMC free article] [PubMed] [Google Scholar]
- 22.Kobori H, Ozawa Y, Satou R, Katsurada A, Miyata K, Ohashi N, Hase N, Suzaki Y, Sigmund CD, Navar LG. Kidney-specific enhancement of ANG II stimulates endogenous intrarenal angiotensinogen in gene-targeted mice. Am J Physiol Renal Physiol 293: F938–F945, 2007. doi: 10.1152/ajprenal.00146.2007. [DOI] [PMC free article] [PubMed] [Google Scholar]
- 23.Liang Y, Arakawa K, Ueta K, Matsushita Y, Kuriyama C, Martin T, Du F, Liu Y, Xu J, Conway B, Conway J, Polidori D, Ways K, Demarest K. Effect of canagliflozin on renal threshold for glucose, glycemia, and body weight in normal and diabetic animal models. PLoS One 7: e30555, 2012. doi: 10.1371/journal.pone.0030555. [DOI] [PMC free article] [PubMed] [Google Scholar]
- 24.List JF, Woo V, Morales E, Tang W, Fiedorek FT. Sodium-glucose cotransport inhibition with dapagliflozin in type 2 diabetes. Diabetes Care 32: 650–657, 2009. doi: 10.2337/dc08-1863. [DOI] [PMC free article] [PubMed] [Google Scholar]
- 25.Liu J, Edgington-Giordano F, Dugas C, Abrams A, Katakam P, Satou R, Saifudeen Z. Regulation of nephron progenitor cell self-renewal by intermediary metabolism. J Am Soc Nephrol 28: 3323–3335, 2017. doi: 10.1681/ASN.2016111246. [DOI] [PMC free article] [PubMed] [Google Scholar]
- 26.Maeda S, Matsui T, Takeuchi M, Yamagishi S. Sodium-glucose cotransporter 2-mediated oxidative stress augments advanced glycation end products-induced tubular cell apoptosis. Diabetes Metab Res Rev 29: 406–412, 2013. doi: 10.1002/dmrr.2407. [DOI] [PubMed] [Google Scholar]
- 27.Mancini SJ, Boyd D, Katwan OJ, Strembitska A, Almabrouk TA, Kennedy S, Palmer TM, Salt IP. Canagliflozin inhibits interleukin-1β-stimulated cytokine and chemokine secretion in vascular endothelial cells by AMP-activated protein kinase-dependent and -independent mechanisms. Sci Rep 8: 5276, 2018. doi: 10.1038/s41598-018-23420-4. [DOI] [PMC free article] [PubMed] [Google Scholar]
- 28.Matthews DR, Li Q, Perkovic V, Mahaffey KW, de Zeeuw D, Fulcher G, Desai M, Hiatt WR, Nehler M, Fabbrini E, Kavalam M, Lee M, Neal B. Effects of canagliflozin on amputation risk in type 2 diabetes: the CANVAS Program. Diabetologia 62: 926–938, 2019. doi: 10.1007/s00125-019-4839-8. [DOI] [PMC free article] [PubMed] [Google Scholar]
- 29.Miyata K, Ohashi N, Suzaki Y, Katsurada A, Kobori H. Sequential activation of the reactive oxygen species/angiotensinogen/renin-angiotensin system axis in renal injury of type 2 diabetic rats. Clin Exp Pharmacol Physiol 35: 922–927, 2008. doi: 10.1111/j.1440-1681.2008.04938.x. [DOI] [PMC free article] [PubMed] [Google Scholar]
- 30.Moe OW, Ujiie K, Star RA, Miller RT, Widell J, Alpern RJ, Henrich WL. Renin expression in renal proximal tubule. J Clin Invest 91: 774–779, 1993. doi: 10.1172/JCI116296. [DOI] [PMC free article] [PubMed] [Google Scholar]
- 31.Navar LG, Harrison-Bernard LM, Nishiyama A, Kobori H. Regulation of intrarenal angiotensin II in hypertension. Hypertension 39: 316–322, 2002. doi: 10.1161/hy0202.103821. [DOI] [PMC free article] [PubMed] [Google Scholar]
- 32.Navar LG, Prieto MC, Satou R, Kobori H. Intrarenal angiotensin II and its contribution to the genesis of chronic hypertension. Curr Opin Pharmacol 11: 180–186, 2011. doi: 10.1016/j.coph.2011.01.009. [DOI] [PMC free article] [PubMed] [Google Scholar]
- 33.O’Leary R, Penrose H, Miyata K, Satou R. Macrophage-derived IL-6 contributes to ANG II-mediated angiotensinogen stimulation in renal proximal tubular cells. Am J Physiol Renal Physiol 310: F1000–F1007, 2016. doi: 10.1152/ajprenal.00482.2015. [DOI] [PMC free article] [PubMed] [Google Scholar]
- 34.Ohashi N, Urushihara M, Satou R, Kobori H. Glomerular angiotensinogen is induced in mesangial cells in diabetic rats via reactive oxygen species-ERK/JNK pathways. Hypertens Res 33: 1174–1181, 2010. doi: 10.1038/hr.2010.143. [DOI] [PMC free article] [PubMed] [Google Scholar]
- 35.Panchapakesan U, Pegg K, Gross S, Komala MG, Mudaliar H, Forbes J, Pollock C, Mather A. Effects of SGLT2 inhibition in human kidney proximal tubular cells–renoprotection in diabetic nephropathy? PLoS One 8: e54442, 2013. doi: 10.1371/journal.pone.0054442. [DOI] [PMC free article] [PubMed] [Google Scholar]
- 36.Park S, Bivona BJ, Kobori H, Seth DM, Chappell MC, Lazartigues E, Harrison-Bernard LM. Major role for ACE-independent intrarenal ANG II formation in type II diabetes. Am J Physiol Renal Physiol 298: F37–F48, 2010. doi: 10.1152/ajprenal.00519.2009. [DOI] [PMC free article] [PubMed] [Google Scholar]
- 37.Pohl M, Kaminski H, Castrop H, Bader M, Himmerkus N, Bleich M, Bachmann S, Theilig F. Intrarenal renin angiotensin system revisited: role of megalin-dependent endocytosis along the proximal nephron. J Biol Chem 285: 41935–41946, 2010. doi: 10.1074/jbc.M110.150284. [DOI] [PMC free article] [PubMed] [Google Scholar]
- 38.Rahman A, Hitomi H, Nishiyama A. Cardioprotective effects of SGLT2 inhibitors are possibly associated with normalization of the circadian rhythm of blood pressure. Hypertens Res 40: 535–540, 2017. doi: 10.1038/hr.2016.193. [DOI] [PubMed] [Google Scholar]
- 39.Rahmoune H, Thompson PW, Ward JM, Smith CD, Hong G, Brown J. Glucose transporters in human renal proximal tubular cells isolated from the urine of patients with non-insulin-dependent diabetes. Diabetes 54: 3427–3434, 2005. doi: 10.2337/diabetes.54.12.3427. [DOI] [PubMed] [Google Scholar]
- 40.Sarnoski-Brocavich S, Hilas O. Canagliflozin (invokana), a novel oral agent for type-2 diabetes. P T 38: 656–666, 2013. [PMC free article] [PubMed] [Google Scholar]
- 41.Satou R, Gonzalez-Villalobos RA, Miyata K, Ohashi N, Katsurada A, Navar LG, Kobori H. Costimulation with angiotensin II and interleukin 6 augments angiotensinogen expression in cultured human renal proximal tubular cells. Am J Physiol Renal Physiol 295: F283–F289, 2008. doi: 10.1152/ajprenal.00047.2008. [DOI] [PMC free article] [PubMed] [Google Scholar]
- 42.Satou R, Miyata K, Gonzalez-Villalobos RA, Ingelfinger JR, Navar LG, Kobori H. Interferon-γ biphasically regulates angiotensinogen expression via a JAK-STAT pathway and suppressor of cytokine signaling 1 (SOCS1) in renal proximal tubular cells. FASEB J 26: 1821–1830, 2012. doi: 10.1096/fj.11-195198. [DOI] [PMC free article] [PubMed] [Google Scholar]
- 43.Shin SJ, Chung S, Kim SJ, Lee EM, Yoo YH, Kim JW, Ahn YB, Kim ES, Moon SD, Kim MJ, Ko SH. Effect of sodium-glucose co-transporter 2 inhibitor, dapagliflozin, on renal renin-angiotensin system in an animal model of type 2 diabetes. PLoS One 11: e0165703, 2016. doi: 10.1371/journal.pone.0165703. [DOI] [PMC free article] [PubMed] [Google Scholar]
- 44.Takeshige Y, Fujisawa Y, Rahman A, Kittikulsuth W, Nakano D, Mori H, Masaki T, Ohmori K, Kohno M, Ogata H, Nishiyama A. A sodium-glucose co-transporter 2 inhibitor empagliflozin prevents abnormality of circadian rhythm of blood pressure in salt-treated obese rats. Hypertens Res 39: 415–422, 2016. doi: 10.1038/hr.2016.2. [DOI] [PubMed] [Google Scholar]
- 45.Terada Y, Tomita K, Nonoguchi H, Marumo F. PCR localization of angiotensin II receptor and angiotensinogen mRNAs in rat kidney. Kidney Int 43: 1251–1259, 1993. doi: 10.1038/ki.1993.177. [DOI] [PubMed] [Google Scholar]
- 46.Tuttle KR, Bakris GL, Bilous RW, Chiang JL, de Boer IH, Goldstein-Fuchs J, Hirsch IB, Kalantar-Zadeh K, Narva AS, Navaneethan SD, Neumiller JJ, Patel UD, Ratner RE, Whaley-Connell AT, Molitch ME. Diabetic kidney disease: a report from an ADA consensus conference. Am J Kidney Dis 64: 510–533, 2014. doi: 10.1053/j.ajkd.2014.08.001. [DOI] [PubMed] [Google Scholar]
- 47.van Bommel EJ, Muskiet MH, Tonneijck L, Kramer MH, Nieuwdorp M, van Raalte DH. SGLT2 inhibition in the diabetic kidney-from mechanisms to clinical outcome. Clin J Am Soc Nephrol 12: 700–710, 2017. doi: 10.2215/CJN.06080616. [DOI] [PMC free article] [PubMed] [Google Scholar]
- 48.Wang L, Lei C, Zhang SL, Roberts KD, Tang SS, Ingelfinger JR, Chan JS. Synergistic effect of dexamethasone and isoproterenol on the expression of angiotensinogen in immortalized rat proximal tubular cells. Kidney Int 53: 287–295, 1998. doi: 10.1046/j.1523-1755.1998.00759.x. [DOI] [PubMed] [Google Scholar]
- 49.Wang XX, Levi J, Luo Y, Myakala K, Herman-Edelstein M, Qiu L, Wang D, Peng Y, Grenz A, Lucia S, Dobrinskikh E, D’Agati VD, Koepsell H, Kopp JB, Rosenberg AZ, Levi M. SGLT2 protein expression is increased in human diabetic nephropathy: SGLT2 protein inhibition decreases renal lipid accumulation, inflammation, and the development of nephropathy in diabetic mice. J Biol Chem 292: 5335–5348, 2017. doi: 10.1074/jbc.M117.779520. [DOI] [PMC free article] [PubMed] [Google Scholar]
- 50.Weber MA, Mansfield TA, Cain VA, Iqbal N, Parikh S, Ptaszynska A. Blood pressure and glycaemic effects of dapagliflozin versus placebo in patients with type 2 diabetes on combination antihypertensive therapy: a randomised, double-blind, placebo-controlled, phase 3 study. Lancet Diabetes Endocrinol 4: 211–220, 2016. doi: 10.1016/S2213-8587(15)00417-9. [DOI] [PubMed] [Google Scholar]
- 51.Woods TC, Satou R, Miyata K, Katsurada A, Dugas CM, Klingenberg NC, Fonseca VA, Navar LG. Canagliflozin prevents intrarenal angiotensinogen augmentation and mitigates kidney injury and hypertension in mouse model of type 2 diabetes mellitus. Am J Nephrol 49: 331–342, 2019. doi: 10.1159/000499597. [DOI] [PMC free article] [PubMed] [Google Scholar]
- 52.Yacoub R, Campbell KN. Inhibition of RAS in diabetic nephropathy. Int J Nephrol Renovasc Dis 8: 29–40, 2015. doi: 10.2147/IJNRD.S37893. [DOI] [PMC free article] [PubMed] [Google Scholar]
- 53.Yamout H, Perkovic V, Davies M, Woo V, de Zeeuw D, Mayer C, Vijapurkar U, Kline I, Usiskin K, Meininger G, Bakris G. Efficacy and safety of canagliflozin in patients with type 2 diabetes and stage 3 nephropathy. Am J Nephrol 40: 64–74, 2014. doi: 10.1159/000364909. [DOI] [PubMed] [Google Scholar]
- 54.Yoshimoto T, Furuki T, Kobori H, Miyakawa M, Imachi H, Murao K, Nishiyama A. Effects of sodium-glucose cotransporter 2 inhibitors on urinary excretion of intact and total angiotensinogen in patients with type 2 diabetes. J Investig Med 65: 1057–1061, 2017. doi: 10.1136/jim-2017-000445. [DOI] [PMC free article] [PubMed] [Google Scholar]