Abstract
Diabetic bladder dysfunction is a frequent complication of diabetes. Although many mouse models of diabetes now exist, there has been little systematic effort to characterize them for the timing of onset and severity of bladder dysfunction. We monitored metabolic status and tested bladder function by void spot assay and limited anesthetized cystometry in both male and female mice of three models of obesity and diabetes: a type 1 diabetes model (the Akita mouse) and two type 2 diabetes models [the diet-induced obese (DIO) model and the ob/ob mouse]. Akita mice had insulin pellets implanted subcutaneously every 3 mo to mimic poorly controlled type 1 diabetes in humans. Mice were hyperglycemic by 48 days after implants. Female mice exhibited no bladder dysfunction at any age up to 20 mo and gained weight normally. In contrast, by 7 mo, male Akita mice developed a profound polyuria and failed to show normal weight gain. There were no observable signs of bladder dysfunction in either sex. DIO mice on high/low-fat diets for 16 mo exhibited mild hyperglycemia in female mice (not in male mice), mild weight gain, and no evidence of bladder dysfunction. Ob/ob mice were followed for 8 mo and became extremely obese. Male and female mice were glucose intolerant, insulin intolerant, and hyperinsulinemic at 4 mo. By 8 mo, their metabolic status had improved but was still abnormal. Urine volume increased in male mice but not in female mice. Bladder dysfunction was observed in the spotting patterns of female mice at 4 and 6 mo of age, resolving by 8 mo. We conclude there are dramatic sex-related differences in lower urinary tract function in these models. Male Akita mice may be a good model for polyuria-related bladder remodeling, whereas female ob/ob mice may better mimic storage problems related to loss of outlet control in a setting of type 2 diabetes complicated by obesity.
Keywords: bladder, hyperglycemia, incontinence, insulin, mouse model, overactivity, polyuria
INTRODUCTION
Obesity and diabetes are at all-time highs, and the prevalence of both continues to increase. According to the Centers for Disease Control and Prevention national diabetes statistics report for 2017, 30.3 million people have diabetes, which represents 9.4% of the United States population. Even more sobering, 84 million people have prediabetes, which is a condition defined by fasting glucose or hemoglobin A1C level. The social and human costs of this epidemic are enormous.
Among the spectrum of well-known complications, such as neuropathy, nephropathy, and retinopathy, there is also a markedly increased risk of lower urinary tract dysfunction. In fact, lower urinary tract symptoms (LUTS) may be the most common complication in diabetes mellitus (DM), affecting up to 80–90% of patients (11, 18). The LUTS observed in these patients cover a range of pathology from the classically defined diabetic cystopathy (diminished bladder sensation, poor contractility, and increased postvoid residual volume) to overactive bladder (OAB) and incontinence (5, 30). Even obesity alone is significantly correlated with urinary incontinence for men and women and with OAB in women (28). Other reports have demonstrated associations between obesity/type 2 diabetes (T2D), benign prostatic hyperplasia, and LUTS (33, 43).
The progression, natural history, and pathophysiology underlying the development of urological complications of obesity and diabetes (UCOD) (11) are almost impossible to study in people, because they take decades to lifetimes to manifest and experimental access to tissues and organs is extremely limited. Therefore, animal models will be critical to our efforts to understand and guide therapy for these prevalent and distressing conditions. A number of rodent models have been used to investigate UCOD, including chemical and genetic models. Streptozotocin (STZ) and alloxan mediate the chemical destruction of insulin-producing pancreatic β-cells, rapidly inducing type 1 diabetes (T1D) (31, 36). There are monogenic models with leptin deficiency [ob/ob and db/db mice and Zucker diabetic fatty rats (17, 20, 24, 35)] or insulin-folding defects [Akita (46)]. Several polygenic strains in both rats and mice have been derived from selective breeding for diabetic traits. These include the spontaneously diabetic Torii rat [T2D without obesity (40)], Goto-Kakizaki rats derived from inbreeding of Wistar rats [T2D (19)], and NONcNZO10/LtJ mice (7), developed by crossing New Zealand obese (NZO/HILt) and nonobese nondiabetic (NON/Lt) mice, which also develop maturity onset obesity and hyperglycemia (10, 18). A third strategy for creating obese/diabetic mice involves putting otherwise identical mice on high- or low-fat diets as a means of mimicking the effects of obesity and metabolic syndrome (42).
Despite an abundance of models that are either obese, hyperglycemic, or both, a major challenge for the phenotypic characterization of rodent models in trying to study UCOD is the lack of clarity with respect to what is being modeled. The human phenotype as noted presents an extremely mixed clinical picture with varying degrees of overactivity, incontinence, loss of sensation, etc. Furthermore, diabetic bladder dysfunction is a multiphasic process driven by the duration and severity of hyperglycemia (5, 18, 28). The temporal hypothesis specifies that there are early compensatory changes in bladder function (greater contractility, overactivity, and wall remodeling) ultimately leading to bladder failure or decompensation, namely, loss of tone, loss of contractile force, and increased postvoid residual volume. While the later phase is thought to result from chronic oxidative stress (11), the early phase may be due to the constant polyuria (9). Because the pathophysiology changes over time, the timeline chosen for investigation is critical and is central to any interpretation of the data.
Another important and often overlooked aspect to the use of animal models for investigating UCOD is sex. Hormones as well as anatomy affect lower urinary tract function (37, 39). Differences separating male from female mice include the presence of a prostate, the length and shape of the urethra, and the estrus cycle. Despite its clear and obvious relevance, there are published studies in which the sex is not even specified. Furthermore, there have been to date no systematic studies to examine the time of onset, prevalence, or severity of UCOD in male versus female mice of any available model.
A major difficulty in attempting to studying UCOD in mice is the lack of characterization of urinary phenotypes in most models of obesity and diabetes. To address some of these existing gaps in the scientific record, we attempted to define the timing, nature, and severity of UCOD in both male and female mice of three popular and commonly used mouse models. These are the Akita model of T1D, the diet-induced obesity (DIO) model in the C57BL/6J background, and the ob/ob mouse, which lacks leptin. The latter two represent examples of obesity/T2D. These models were followed longitudinally for 20, 16, and 8 mo, respectively, with the primary urological output assayed by void spotting on filter paper (6, 22, 45), and metabolic status was also monitored by glucose tolerance testing and insulin tolerance testing. Notable sex differences were found with two of the three models. It is hoped that these data will help to inform investigators about differences in phenotype between models and stress the importance of factoring sex into decisions when choosing mouse models.
METHODS
All of the animal experiments described in this article were performed with the approval of the Beth Israel Deaconess Medical Center (BIDMC) Institutional Animal Care and Use Committee. All mice were obtained from The Jackson Laboratory (Bar Harbor, ME) and maintained in the BIDMC Research North Building animal research facility with ad libitum access to food and water and 12:12-h light-dark cycles.
The Akita model.
Fifty Akita mice (25 male and 25 female mice) in the C57BL/6J background (C57BL/6-Ins2Akita/J) were used for this study (stock no. 003548, The Jackson Laboratory). The C57BL/6-Ins2Akita/J strain has been found to have the lowest urinary albumin excretion compared with other commercially available Akita mouse strains. Additionally, C57BL/6-Ins2Akita/J mice have a lower glomerular filtration rate (GFR) and the lowest mesangial matrix expansion. Thus, the severity of diabetic nephropathy in the C57BL/6-Ins2Akita/J strain does not appear to be robust and therefore should not complicate analysis of voiding measurements. In an effort to more closely mimic the human T1D situation, in which blood glucose is poorly managed, Akita mice were treated with dorsally implanted subcutaneous insulin pellets. Linbit insulin pellets (containing 13 mg of insulin and microrecrystallized palmitic acid) were obtained from LinShin. Pellets were inserted into male Akita mice every 3 mo for 20 mo at the weight-specific dosage recommended by LinShin (2 pellets/20 g body wt plus 1 pellet/5 g beyond 20 g). When female Akita mice were dosed in similar fashion, it became clear that they were much more sensitive to developing life-threatening hypoglycemia, as we lost several animals. Once we realized this, female mice were treated with insulin pellets only every 4 mo and at a dosage of 1 pellet less than that recommended by LinShin. After isoflurane anesthesia, shaving, and betadine disinfection, the dorsal skin was first pierced with a 16-gauge needle, and a disinfected 12-gauge trocar was then inserted at least 1.5 cm deep. Pellets were then pushed under the skin using a stylet.
The DIO model.
Male and female C57BL/6J mice (64 of each) were split into two groups, one of which was fed Research Diet D12492 (Research Diet, New Brunswick, NJ), a high-fat diet with 60% calories from fat. Diets were started at 4 wk of age. Control groups were fed Research Diet D12450B (Research Diet), which contained 10% of calories present as fat. Food was changed twice weekly. For comparison, standard mouse chows contain ~15% calories as fat.
The ob/ob model.
Sixty male and sixty female ob/ob mice were used in this study. The B6.Cg-Lepob/J (Lepob) mouse carries a spontaneous mutation in leptin, the ligand for the leptin receptor. The C57BL/6J heterozygous for Lepob mouse is on the C57BL/6J genetic background and thus is said to have mild renal structure and function, not significantly altered by diabetic nephropathy. This particular strain of mouse does not develop such severe diabetes that the mouse dies prematurely (www.jax.org). Controls were equivalent numbers of sex-matched C57BL/6J mice.
Glucose tolerance test.
A glucose tolerance test was performed according to guidelines found in Ref. 2. After a 15-h fast, blood glucose was measured with a One Touch Ultra2 glucose meter and strips on samples obtained by tail nick bleeding before the intraperitoneal injection of glucose (2 g/kg, 0-min time point) and followed at timed intervals (10, 20, 30, 60, 90, and 120 min) after glucose administration. Blood samples were also collected at intervals of 0, 15, 30, 45, 60, and 75 min to measure insulin concentration in the serum. Insulin concentration was determined by an ELISA kit (ALPCO, Salem, NH).
Insulin tolerance test.
After a 4-h fast, baseline blood glucose was measured on samples obtained by tail nick bleeding before the intraperitoneal injection of insulin (0.75 IU/g). Blood glucose was then measured at time points of 15, 30, 45, 60, and 75 min after glucose administration (2).
Spontaneous void spot assays.
Spontaneous void spot assays (VSAs) were performed as previously described (6, 38, 47). Individual mice were gently placed in standard polycarbonate mouse cages with Blicks Cosmos Blotting Paper (catalog no. 10422-1005) placed on the bottom. Mice were given standard dry mouse chow for the duration of the assay; water was withheld. After 4 h, mice were returned to their home cages, and the filter paper was allowed to dry. Filters were photographed under ultraviolet light at 365 nm in a UVP Chromato-Vue C-75 system (UVP, Upland, CA) that incorporates an onboard Canon digital single lens reflex camera (EOS Rebel T3-12 megapixels). TIFF images were examined using FIJI software (http://fiji.sc/wiki/index.php/Fiji), and any overlapping voiding spots were manually separated by outlining, copying, and then pasting to a nearby empty space on the filter. Images were analyzed by UrineQuant software, developed by us in collaboration with the Harvard Imaging and Data Core. The results table, which contains the area of each voiding spot and total number of spots, was imported into Excel software for further statistical processing. A volume-area standard curve on this paper determined that 1 mm2 is equal to 0.283 µL urine. Voiding spots larger than 20 μL are considered to be primary voiding spots (PVS) and typically represent >95% of the total micturition volume (justification for this cutoff may be found in Refs. 6 and 38).
Cystometrograms.
Cystometry was performed under urethane anesthesia (intraperitoneal injection of 1.2–1.4 g/kg) as described in Ref. 25. Briefly, each mouse received an initial dose at 1.2 g/kg, 30–60 min before surgery, and if it became necessary at any point for maintenance of anesthetic plane, additional aliquots were injected (47). Once the pedal reflex was absent, a 1-cm midline abdominal incision above the bladder was made. Flame-flanged PE-50 tubing was implanted through the dome of the bladder using a 25-gauge × 1.5-in. needle (luer fitting removed) slid inside the plastic tubing to pierce and penetrate the bladder wall. The catheter was secured in place with a purse string surgical suture using sterile 8-0 silk. The incision site was sutured closed around the catheter with 5-0 silk. Exteriorized tubing was then connected to a syringe pump and pressure transducer (by T junction fitting) coupled to a computerized recording system (LabChart). After surgery, mice were given 30 min of recovery time before experiments commenced, and bladders were infused with sterile saline at 25 µL/min at room temperature (22°C). Cystometric parameters, pressure amplitude at voiding (peak pressure – basal), intercontractile interval, and compliance were quantitated. Compliance was measured by finding the inverse of the pressure slope during bladder filling during the first half of the filling cycle and well before the voiding event. After cystometry, bladders were excised, blotted dry on Kimwipes, and weighed.
Histology.
Hematoxylin and eosin (H&E) staining on paraffin-embedded, formalin-fixed bladders was performed by the BIDMC histology core using standard methods. Slides were imaged using bright-field microscopy on an Olympus BX60 microscope using a ×4 objective, and images were acquired on computer using cellSense software. To present whole bladders, overlapping images were “stitched” together and contrast enhanced using FIJI software.
Statistics.
Data are expressed and shown graphically as means ± SD. Statistical analysis was performed by two-way ANOVA with Tukey’s honestly significant difference post hoc testing using online tool GraphRobot [Lei A. Wang (2019), GraphRobot url: https://www.graphrobot.com)]. Where stated, two-tailed t tests were performed in Excel. Statistical significance was identified at P < 0.05.
RESULTS
The Akita model.
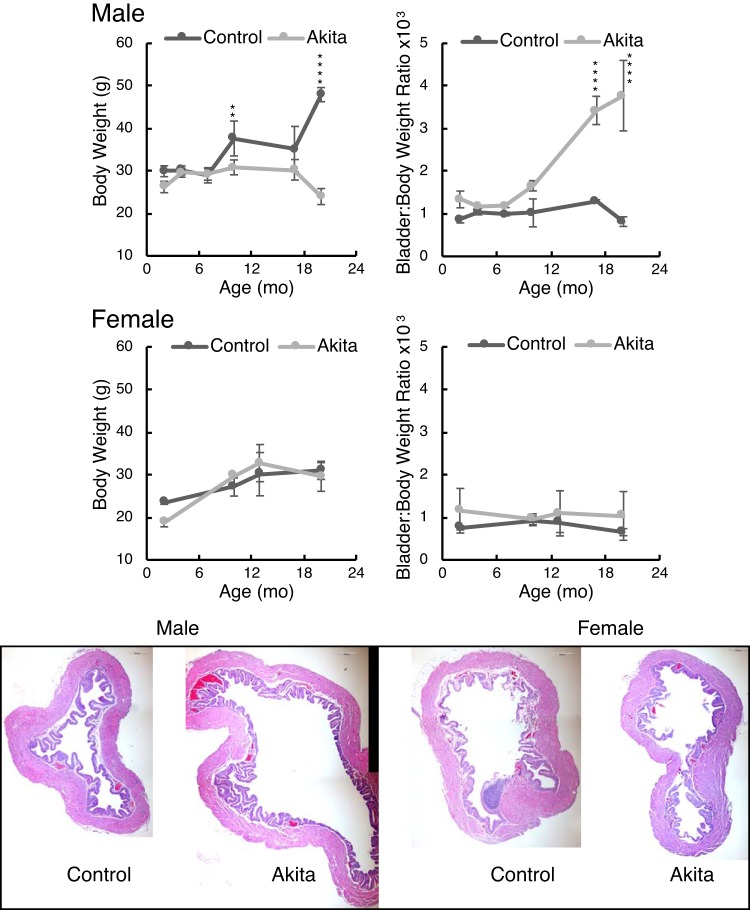
Figure 1 shows the respective body weights and bladder-to-body weight ratios for male and female Akita mice with age. Female Akita mice showed no difference in either parameter at any age. In contrast, male Akita mice clearly failed to gain weight as they aged, with a significant divergence from controls at around 10 mo (P < 0.01). The bladders of male Akita mice, however, became significantly heavier than those of controls as a percentage of their weight, and the histology (Fig. 1, bottom) showed massive bladder dilation for male mice only, which was due to chronic polyuria (see Fig. 3). All of the histology images were taken from 20-mo-old mice and as shown in Fig. 1 are presented at identical scale to each other for comparison.
Fig. 1.
Akita mice and C57BL/6J mice of each sex were weighed at different ages. Data presented are means ± SD; n = 3–4 mice. Bladders were excised after euthanasia, emptied of any urine by gentle pressing on a Kimwipe, and then weighed. Two-way ANOVA with factors “strain” and “age” revealed that male Akita mice were significantly different for both body weight (P < 10−8) and bladder-to-body weight ratio (P < 10−8). Age was also a highly significant contributor to these variables (P < 10−6). Female bladder-to-body weight ratios were not strain dependent. “Strain” differences were determined by post hoc testing (**P < 0.01 and ****P < 0.0001). Bladders for histology were placed in 4% paraformaldehyde-PBS at 4°C for overnight incubation and then washed three times with PBS before paraffin embedding, sectioning, and staining. All histology images are shown at equivalent magnification. Scale bars = 200 μm.
Fig. 3.
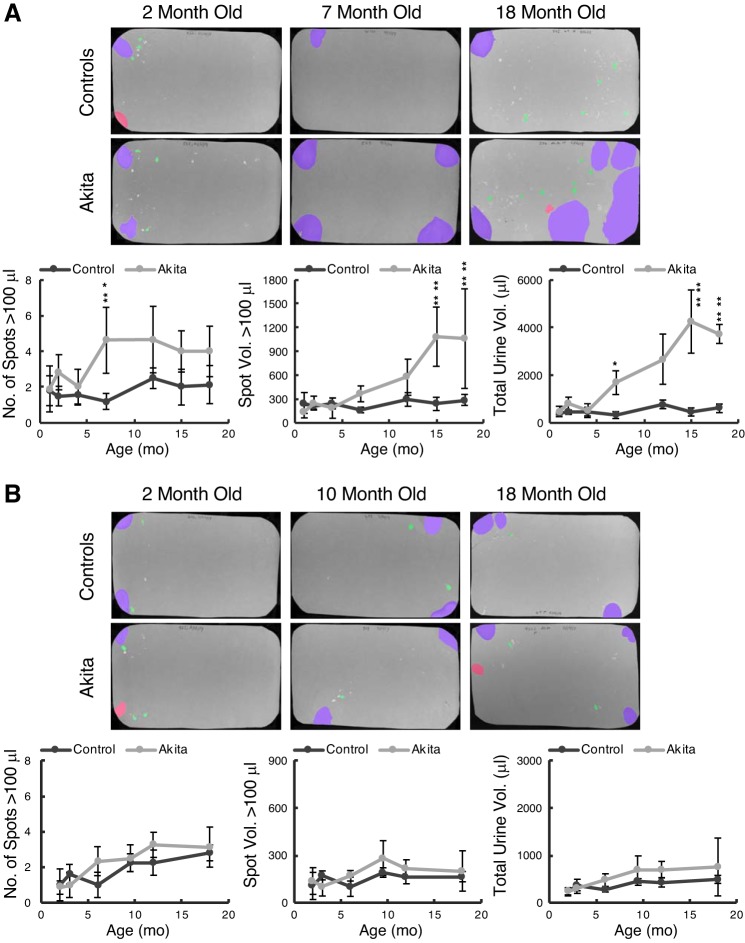
Akita and control mice at different ages were placed on filter paper for 4 h, filters were photographed under ultraviolet illumination, and images were analyzed for spot numbers and spot volumes by software. A: male Akita and control mice. Data are means ± SD from a minimum of 4 mice/group. Actual numbers of Akita and control mice tested at 1, 2, 4, 7, 12, 15, and 18 mo were 10, 6, 7, 8, 6, 7, and 4 and 5, 6, 5, 5, 4, 4, and 7, respectively. B: female Akita and control mice. Numbers of mice tested at 2, 3, 6, 9, 12, and 18 mo were 13, 9, 6, 8, 8, and 8 and 6, 5, 5, 4, 8, and 5, respectively. Two-way ANOVA with factors “strain” and “age” revealed that male Akita mice were significantly different from controls for all three voiding parameters (P < 10−8), and age was also a highly significant contributor to these variables (P < 0.01 for number of spots and P < 10−8 for the others). Tukey post hoc comparisons showed significance between strains arising at 7, 15, and 7 mo, respectively. Female void parameters were not significantly different at any time point comparison.
Male Akita mice were given insulin pellets every 3 mo and female Akita mice every 4 mo (details in methods) to try to model poor glycemic control, as might be observed in human patients with T1D. Female Akita mice exhibited a more moderate degree of nonfasting hyperglycemia before insulin supplementation than male Akita mice (375 ± 75 vs. 573 ± 31 mg/dL at 6–8 wk of age, n = 5 mice/group). This was consistent with the comprehensive phenotyping data available at the DiaComp website for these mice. Overall, female mice of this strain were less severely diabetic than the male mice. By way of comparison, our female control mice at 6 wk had blood glucose levels of 167 ± 15 mg/dL (n = 5).
To characterize the effects of the exogenous insulin on Akita blood glucose levels, we performed glucose tolerance tests on young male Akita and control mice at varying times after pellets were implanted at 6 wk of age (Fig. 2). The relative kinetics of glucose management after a glucose bolus are shown 7, 12, 30, and 48 days after pellet implantation in male mice. At 1 wk, we found that baseline fasting levels in Akita mice were significantly lower than those of controls (P < 0.01 at 7 days by Tukey’s post hoc testing), and the glucose spike was also significantly attenuated at the 7-day time point (P < 0.05). By 30 days, however, glucose tolerance resembled control animals; by 48 days, baseline and peak glucose values were elevated in Akita mice (P < 0.001) and glycemic control had essentially been lost. These kinetics indicate that, given the protocol followed, Akita mice regained a period of lowered blood glucose but beyond 1 mo exhibited diabetes once again.
Fig. 2.
Male mice implanted with insulin pellets at 6 wk were tested for glucose tolerance at the indicated number of days after implantation. After an overnight fast and baseline blood glucose measurement, mice were given an injection of glucose solution (2 g/kg ip) and then had blood glucose remeasured at 15, 30, 45, 60, 90, and 120 min after injection. Data are means ± SD; n = 5 mice/group. The slow loss of glycemic control in Akita mice is reflected in the statistical significance by ANOVA testing, in which both baseline fasted blood glucose (time 0) and peak blood glucose values were highly time of implantation dependent (P < 10−8 and P < 10−7, respectively).
To determine whether T1D in this model resulted in observable changes in micturition behavior, we ran VSAs on Akita and control mice at various time points for the duration of the study. Figure 3 shows representative examples of filter papers from male (Fig. 3A) and female (Fig. 3B) mice, which were analyzed by Urinequant software. The pseudocolored images show large (>20-μL voids, purple), medium (5- to 20-μL voids, red), and small (0.5- to 5-μL voids, green) urine spots, illuminated by ultraviolet light. Quantitation of spot numbers, mean spot volumes, and total urine voided over 4 h are shown graphically underneath. The male data shown in Fig. 3A revealed a profound polyuria (Fig. 3A, right graph) that began to manifest significantly at 7 mo of age. Before this, there was little difference in the number of urination events > 100 μL (Fig. 3A, left graph) or the average volume/event (Fig. 3A, middle graph). Beginning at 7 mo, however, the total volume of urine produced increased steadily to peak at a remarkable 4 mL per assay, or 1 mL/h, and this plateau was reached at 15 mo of age. In contrast, female Akita mice showed no consistent trend to differentiate them from female control mice in spot number, average spot volume, or total volume. Therefore, the female mice showed no signs of a diabetes-induced polyuria despite receiving less insulin than the male mice (see methods for details).
Interestingly, for male mice, although overall volume increased, there was no evidence for mislocalization of urine, i.e., urinating away from filter edges toward the center (see Fig. 11 for how center voiding is defined) (22). There was also no evidence of an increase in small volume deposits, sometimes the hallmark of problems with storage (incontinence or overactivity) or outlet obstruction. Therefore, we conclude that male Akita mice exhibit no overt voiding dysfunction but rather an osmotic diuresis due to glucose spillage. Urine collection from 20-mo-old mice in metabolic cages reinforced the conclusion of a male-specific polyuria in Akita mice [24-h urine volumes were 3.0 ± 1.7 vs. 16.0 ± 4.6 mL (n = 3 mice/group) in male control and Akita mice (P = 0.01) and 1.3 ± 0.8 and 1.5 ± 0.5 mL (n = 3 mice/group) in female control and Akita mice, respectively (not significant)].
Fig. 11.
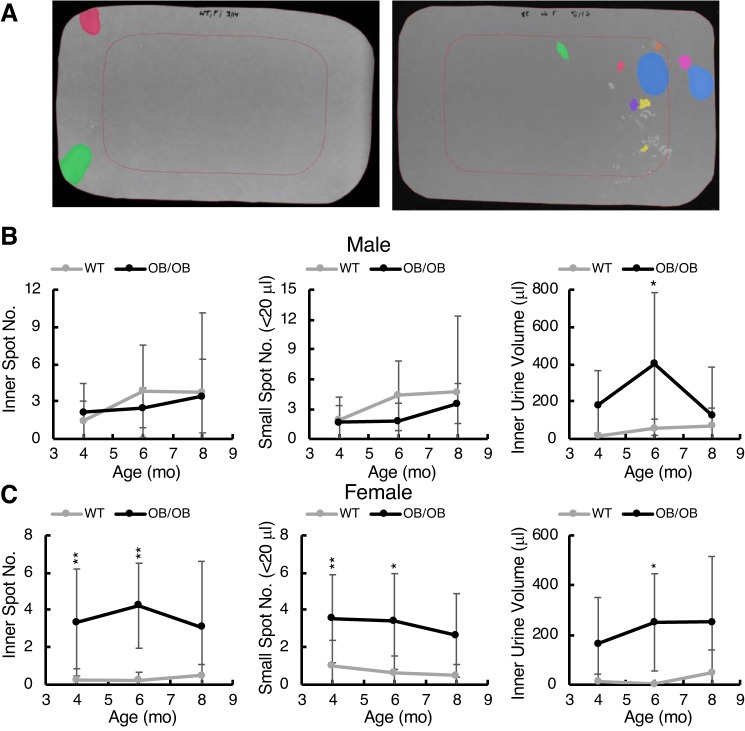
Urine localization analysis and small spot volume analysis from void spot assays. A: examples of filter papers with pseudocolored urine spots and the “inner” region representing 50% of the filter area, defined by the red rectangle. Left: a control female mouse; right: a female ob/ob mouse at 6 mo. Female ob/ob mice showed micturition within the inner region, which was rare for control mice. Quantitation of this phenomenon is shown for male (B) and female (C) mice with graphs from left to right showing inner spot number, total small spot number (defined as 5- to 20-μL spots), and inner spot area total volume. Data are shown as means ± SD. Two-way ANOVA with Tukey’s post hoc testing for differences between strains was used to determine significance (*P < 0.05; **P < 0.01). Age was not a significant contributor.
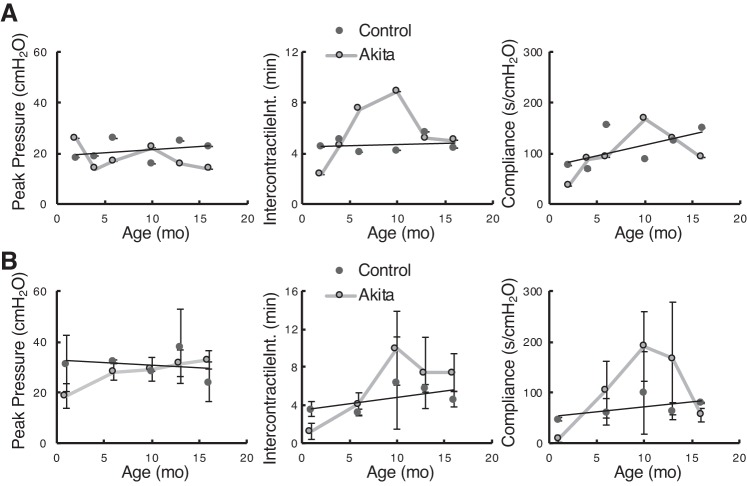
We performed cystometry on groups of mice at different age points. Unfortunately, the data obtained for this part of the study is underpowered due to the number of technical failures experienced during surgery. As a result, the data gathered are not statistically robust. However, we present the results for those animals in which steady, reliable cystometric tracings were obtained and leave it to the readers’ judgment as to its reliability. Figure 4 shows data from control mice in black circles and fitted linear regression lines, which appeared to accurately summarize the trends with age. Gray squares show Akita mouse parameters and are joined by gray lines. Where there were at least three high-quality cystometrograms, standard deviations are shown as error bars. Lack of error bars indicates that only two mice were used and the data were averaged. In terms of peak micturition pressures with voiding, there was no difference between male (Fig. 4A) and female (Fig. 4B) Akita and control mice. The data suggest that, for intercontractile intervals and bladder compliance, male and female mice exhibited similar trends with increases in both parameters at the 10-mo mark and with both diminishing back to control levels by 18 mo of age. Differences did not reach statistical significance at any point where there were at least three mice in each group.
Fig. 4.
Cystometric parameters from male Akita and control mice (A) and female Akita and control mice (B). Mean data and (where n was equal to at least 3) SDs are shown for each age. The number of cystometrograms these values were derived from at each time point were as follows: male Akita and male control numbers at 2, 4, 6, 10, 13, and 16 mo were 2, 2, 3, 2, 2, and 2 and 1, 3, 2, 4, 5, and 2, respectively, and female Akita and female control numbers at 1, 6, 10, 13, and 16 mo were 3, 3, 3, 3, and 3 and 5, 4, 2, 4, and 2, respectively.
The DIO model.
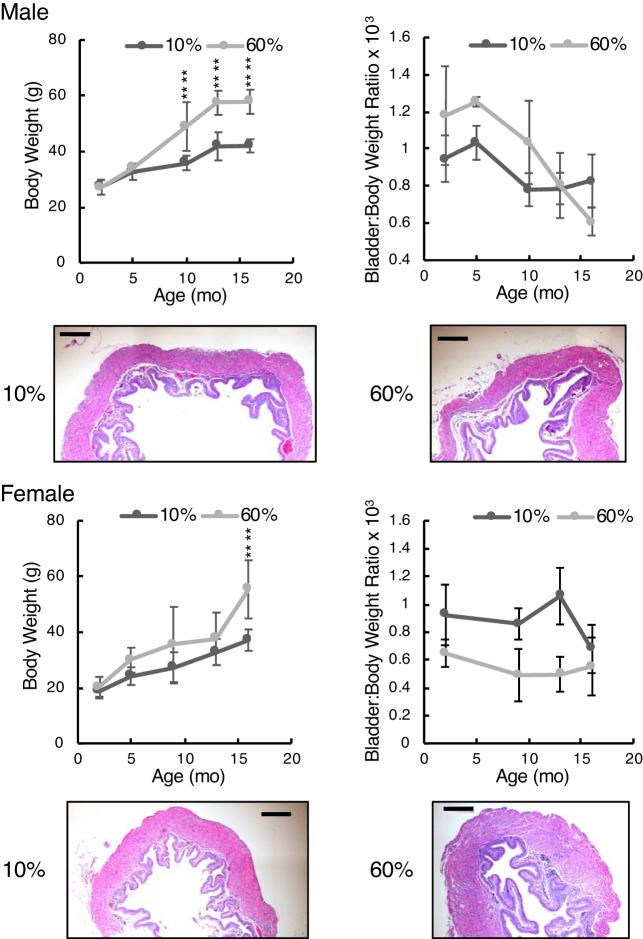
Figure 5 shows body weight data and bladder-to-body weight ratios for male and female mice fed either high-fat (60% of calories) or low-fat (10% of calories) diets for a period of 16 mo. Male mice became significantly heavier only after 10 mo, whereas female mice on a high-fat diet became significantly heavier only at 16 mo. Male mice were 37% heavier from 10 mo of age, whereas female mice, on average, were 29% heavier. The bladder-to-body weight ratio data were notable mostly for female mice on a high-fat diet having relatively smaller bladders relative to body size. By ANOVA, the bladder-to-body weight ratio was not significantly dependent on diet in male mice but it was in female mice (P < 10−4). Hematoxylin and eosin staining was performed on bladder sections from 16-mo-old animals. Male mice on 10% fat had a higher bladder-to-body weight ratio, and histology confirmed this, with bladders from low-fat diet-fed mice being somewhat larger than bladders from high-fat diet-fed mice.
Fig. 5.
Body and bladder-to-body weight ratios shown for diet-induced obese mice. Top: male mice; bottom: female mice. Histology of bladders from low-fat and high-fat diet-fed mice taken at 16 mo of age are shown at identical scales for comparison. Bright-field microscopy was performed using a ×4 objective. Scale bars = 200 μm. Graphic data are shown as means ± SD. Numbers of male mice in the 10% and 60% fat groups for body weights at each age were 9, 9, 14, 21, and 9 and 9, 9, 3, 9, and 9, respectively. For bladder-to-body weight ratio data, n = 3−5 for all. Numbers of female mice in the 10% and 60% groups for body weights at each age were 18, 17, 11, 18, and 14 and 23, 13, 11, 16, and 14, respectively. For bladder-to-body weight ratio data, n = 3−5 for all. Two-way ANOVA with factors “diet” and “age” were both highly significant for male and female body weights ((P < 10−8). Bladder-to-body weight ratios were not significant for diet in male mice but were significant for female mice (P < 10−4). “Strain” differences were determined by post hoc testing (****P < 0.0001).
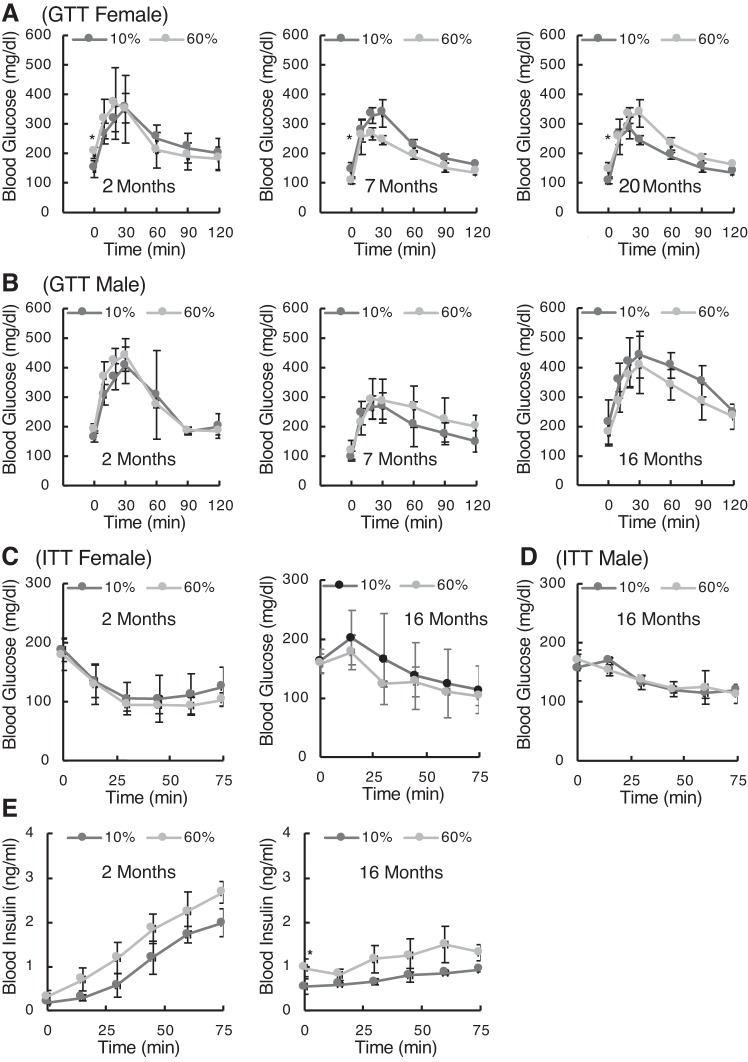
Metabolic testing of DIO mice at different ages is shown in Fig. 6. Glucose tolerance was tested in female (Fig. 6A) and male (Fig. 6B) mice, revealing that there were only marginal differences in glucose handling kinetics based on diet. Independent variables of fasting blood glucose (time 0) and peak blood glucose concentrations were tested by ANOVA. For female mice, fasted blood glucose was significantly different between diets (P < 0.05), and post hoc testing showed significance at all ages (P < 0.05). Peak blood glucose values were not different in female mice. The high-fat diet in male mice did not have any effect on fasting glucose or peak glucose after injection.
Fig. 6.
Metabolic status of diet-induced obese (DIO) mice. Glucose tolerance tests (GTTs) were performed on female (A) and male (B) mice as DIO mice aged. After an overnight fast and baseline blood glucose measurement, mice were given an injection of glucose solution (2 g/kg ip) and then had blood glucose remeasured at 15, 30, 45, 60, 90, and 120 min after injection. Data are means ± SD; n = 5 mice/group. C: insulin tolerance [insuline tolerance test (ITT)] was measured in 4-h fasted female mice at 2 and 16 mo of age. After baseline blood glucose measurement, insulin was injected (0.75 IU/g ip), and glucose was then measured for 75 min. D: male ITT at 16 mo of age. E: blood insulin in female DIO mice was assayed by ELISA after the injection of glucose (2 g/kg ip) at 2 and 16 mo of age. “Strain” differences for time 0 (baseline) measurements were determined by post hoc testing (*P < 0.05).
An insulin challenge (insulin tolerance test) demonstrated no effect on glucose uptake in either female (Fig. 6C) or male mice out to 16 mo of age. There was no significant metabolic impairment associated with a high-fat diet. Measurements of circulating insulin levels in response to a glucose injection into fasted animals also showed significant differences for female mice (Fig. 6E) that did not manifest in male mice (not shown). Interestingly, there appears to have been an age-related loss of potency for glucose to elicit insulin mobilization (as indicated by the difference in slopes between 2 and 20 mo). Statistical testing for the effects of “diet” and “age” on baseline insulin (time 0) and the rate of insulin release into blood (linear regression slopes) showed that baseline insulin concentrations were significantly higher at 16 mo (P < 0.05) and the rates of insulin release were significantly lower with age (P < 0.001 for both 10% and 60% fat). Diet had no effect on the rate of release at either age.
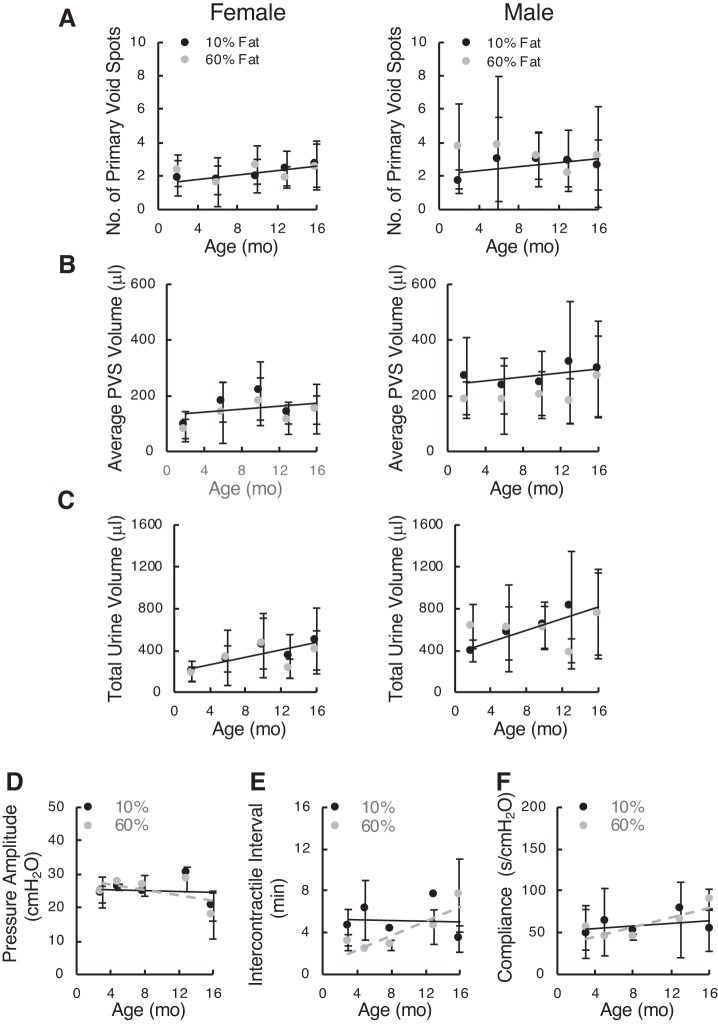
Testing of bladder function by VSAs revealed absolutely no changes in number of PVSs (defined as urination events > 20 μL), average size of PVSs, or total urine volumes in either male or female mice (Fig. 7). Likewise, the limited numbers of cystometrograms showed no obvious differences in urodynamic parameters, peak voiding pressure, intercontractile interval, or bladder compliance. In summary, the data suggest that the DIO model in C57BL/6J mice does not develop much in the way of metabolic derangements and exhibits no bladder dysfunction at any age up to 16 mo.
Fig. 7.
Void spot data from diet-induced obese female (left) and male (right) mice and cystometric parameters for female mice tested periodically over 16 mo. A: number of primary void spots (PVSs). B: average PVS volume. C: total urine volume. Data are shown as means ± SD. Since all parameters for both diets essentially overlapped, linear regression was applied to the 10% fat diet data to illustrate any age-related trends. Numbers of female mice on low-fat (10%) and high-fat (60%) diets were 5, 5, 3, 5, and 4 and 10, 15, 14, 9, and 5, respectively. Numbers of male mice on the same diets tested by void spot assay were 3, 9, 4, 5, and 6 and 3, 6, 8, 6, and 6, respectively. D–F: cystometric parameters from diet-induced obese female mice on 10% and 60% fat diets. Mean data and (where n was equal to at least 3) SDs are shown for each age up to 16 mo. Numbers of mice in the 10% and 60% groups at each age were 3, 3, 2, 2, and 3 and 3, 2, 3, 3, and 3, respectively. D: pressure amplitude at voiding (peak − baseline). E: intercontractile interval. F: compliance (calculated from the inverse slope of the filling phase).
The ob/ob model.
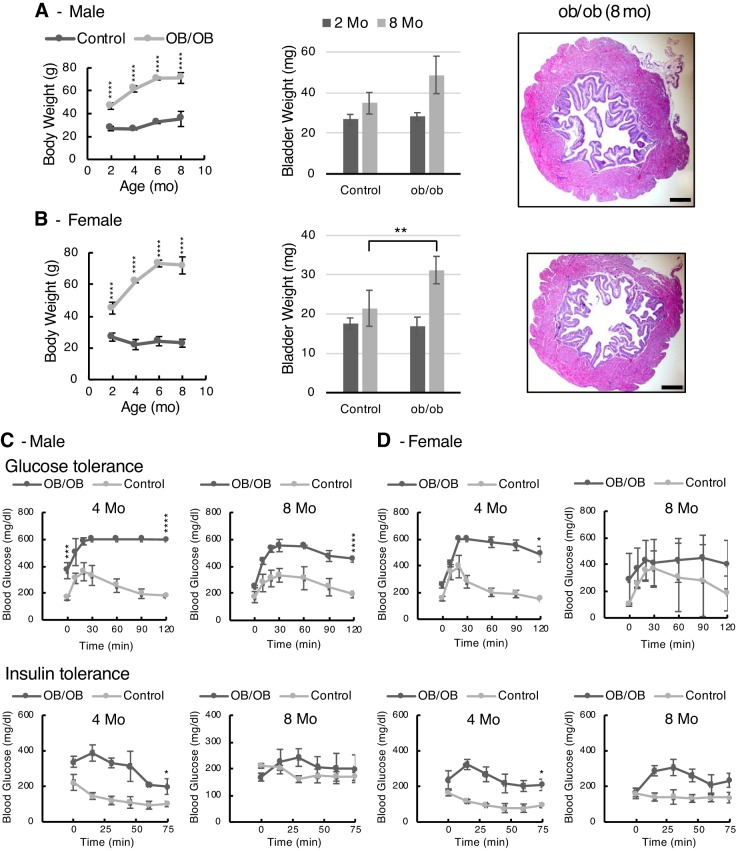
Figure 8, A and B, shows the weight gain characteristics, bladder weights, and histology of male and female ob/ob mice up until the age of 8 mo. These mice are hyperphagic and gain weight impressively. At 8 mo, male and female mice weighed 71 and 72 g, respectively. The bladders also became bigger, and for female mice were significantly heavier, than those of controls at 8 mo (P < 0.01). Histology looked normal in terms of urothelial and detrusor thickness.
Fig. 8.
Body weights, bladder weights, and metabolic results shown for ob/ob mice. A: male mice; B: female mice. Histology of bladders from low-fat and high-fat diet-fed mice taken at 8 mo of age are shown at identical scales for comparison (scale bars = 200 μm). Bright-field microscopy was performed using a ×4 objective. Graphic data are shown as means ± SD. Numbers of male mice in control and ob/ob groups for body weights at each age were 3, 7, 6, and 6 and 3, 3, 3, and 6, respectively. For bladder weights, n = 3 for control mice and 3 and 6 for ob/ob mice. Numbers of female mice in control and ob/ob groups for body weights at each age were 3, 4, 6, and 7 and 5, 3, 3, and 3, respectively. For bladder weights, n = 3 for control mice and 5 for ob/ob mice. C and D: glucose and insulin tolerance tests of ob/ob male (C) and female (D) mice at 4 and 8 mo of age. For the glucose tolerance test, after an overnight fast and baseline blood glucose measurement, mice were given an injection of glucose solution (2 g/kg ip) and then had blood glucose measured over time. Significance testing was performed for baseline glucose (time 0) and glucose concentration at 120 min. For the insulin tolerance test, after a fast and baseline blood glucose measurement, insulin was injected (0.75 IU/g ip), and glucose was then measured for 75 min. Significance testing was performed for equilibrium glucose concentration (lowest value). Data are means ± SD; n = 3 mice/group. “Strain” differences were determined by post hoc testing (*P < 0.05, **P < 0.01, ***P < 0.001, and ****P < 0.0001).
Metabolic tests revealed that male mice were hyperglycemic at baseline at 4 mo (P < 0.0001) and that both male and female mice were profoundly glucose intolerant at 4 mo (Fig. 8, C and D). Interestingly, the degree of intolerance was worse at 4 mo, with improvements seen in glucose handling for both male and female mice by 8 mo. Baseline blood glucose in female ob/ob mice was not significantly different from that of controls at either 4 or 8 mo of age; however, glucose concentrations at 120 min were significantly elevated at 4 mo (P < 0.05) but not at 8 mo. Insulin tolerance testing revealed insulin resistance in ob/ob mice at 4 mo, with marked improvement in male mice by 8 mo to control levels, whereas female mice were still somewhat insulin resistant at 8 mo. Statistical comparisons of the equilibrium blood glucose levels after insulin challenge showed that male mice were not significantly different; however, females ob/ob mice were significantly insulin resistant at 4 mo (P = 0.05) but not at 8 mo.
Male and female ob/ob mice were both hyperinsulinemic at 2 mo of age (Fig. 9, time 0 values), with some normalization of insulin levels by 8 mo. Interestingly, the kinetics of insulin secretion were quite different between ob/ob mice and controls of both sexes. In control mice, injection of a glucose bolus resulted in a steady increase in insulin level over 75 min. Ob/ob mice, which were hyperinsulinemic at baseline, exhibited an initial brief increase over 30 min followed by a decline. Since insulin has a half-life of only ~10 min (2), it is possible that the decline represents insulin secretion shutting off prematurely. The reduction in circulating insulin was more profound at 8 mo for both male and female mice, with insulin concentrations significantly lower than those of controls at 75 min (P < 0.01).
Fig. 9.
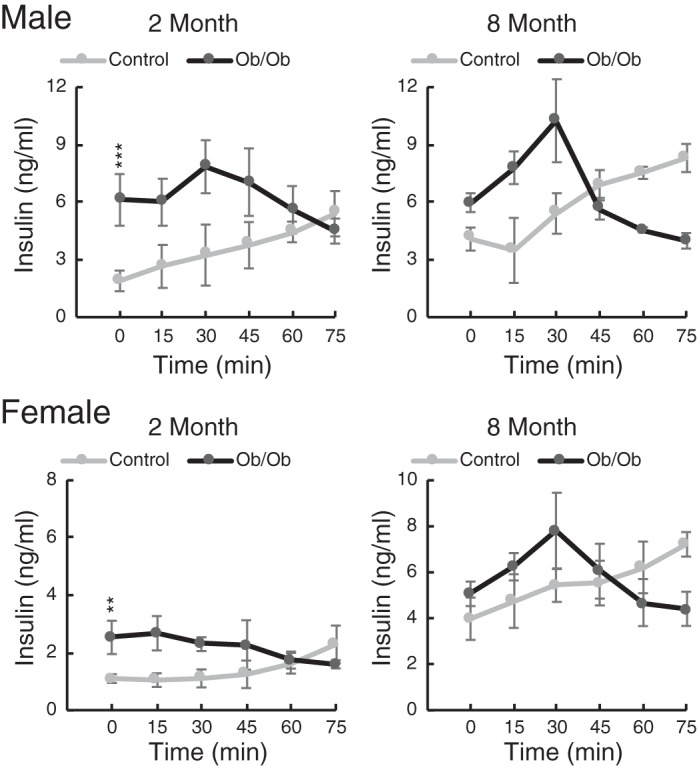
Blood insulin concentrations after a glucose challenge in ob/ob and control mice at 2 and 8 mo of age. Blood insulin was assayed by ELISA after injection of glucose (2 g/kg ip) at 2 and 8 mo of age in both male and female mice. Data are means ± SD; n = 3 mice/group. Two-way ANOVA testing for differences based on “strain” and “age” showed that both male and female baseline insulins were significantly higher in ob/ob mice (P < 0.001 and P < 0.01, respectively). Age was a significant factor for female mice (P < 10−4) but not male mice. **P < 0.01; ***P < 0.001.
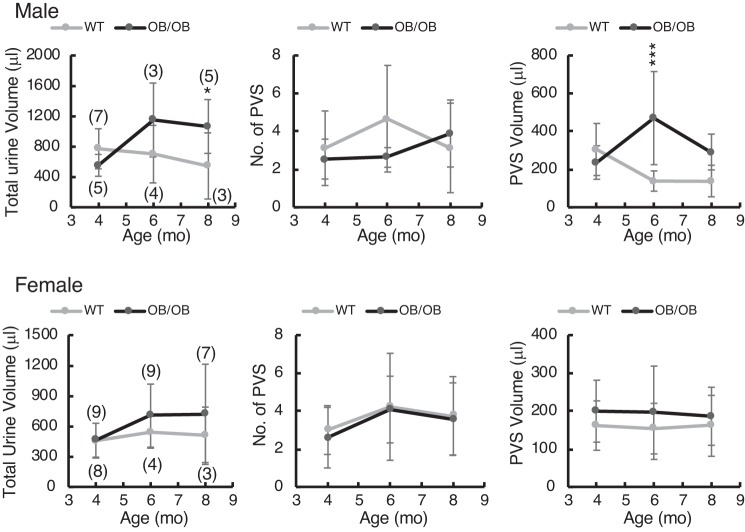
Bladder function was assessed by VSAs (Figs. 10 and 11). Male ob/ob mice produced more urine at 8 mo (Fig. 10, left) with no greater frequency of PVS but an increase in volume/void (Fig. 10, right). Female ob/ob mice were not significantly different from controls in any of these parameters. Further analysis of void spot localization and volume distribution revealed some more interesting differences (Fig. 11). Since mice normally prefer to urinate near the edge of the cage (Fig. 11A, left), it can be indicative of voiding dysfunction if they do not. For these analyses, we defined an area of the filter paper in the center that represented exactly 50% of the interior space (Fig. 11A, red rectangles). Voids that occurred inside this rectangle were defined as “inner” spots. A number of inner spots of varying volumes can be seen in the filter image on the right (Fig. 11A). We quantitated the number of inner spots for both male and female mice (Fig. 11, B and C, left), the overall number of small spots irrespective of location (5-20 μL; Fig. 11, B and C, middle), and the volume of urine deposited in the inner area (Fig. 11, B and C, right). Female ob/ob mice, in particular, showed a striking increase in mislocalization of voiding to the center and an increase in small urine spot number. Male ob/ob mice did not share this micturition patterning, although they did urinate significantly more (but not more often) in the center than control mice at 4 and 6 mo of age. We conclude that ob/ob mice were exhibiting a form of diabetic bladder dysfunction characterized by a loss of normal outlet control. The assumption behind this conclusion is that ob/ob mice would prefer to void near the edge if they could and that, to some extent, center voiding was involuntary. Similar analyses were performed on the Akita and DIO filters, but nothing of significance emerged. It is worth noting that both male and female ob/ob mice are more “diabetic” (hyperglycemic and insulin resistant) at 4 mo than at 8 mo, and this correlates nicely with the results shown in Fig. 11 where statistical differences disappeared at 8 mo.
Fig. 10.
Void spot data from ob/ob and control [wild-type (WT)] male (top) and female (bottom) mice tested at 4, 6, and 8 mo of age. Mice were placed individually in cages with filter paper on the bottom for 4 h, filters were photographed under ultraviolet illumination, and images were analyzed for spot numbers and spot volumes by software. Graphs from left to right show total urine volume in 4 h, number of primary void spots (PVSs; defined as urination volumes > 20 μL), and average PVS volume. Numbers of mice tested at each age are indicated in brackets in graphs on the left. Data are shown as means ± SD. Two-way ANOVA testing with post hoc testing for differences based on “strain” and “age” revealed significantly greater urine volume in male ob/ob mice at 8 mo (P < 0.05) and in PVS volume at 6 mo (P < 0.001). Age was not a significant factor, and none of the female parameters were different. *P < 0.05; ***P < 0.001.
Cystometry on ob/ob mice was plagued by the same low numbers as noted earlier, but we present our results while noting the caveat (Fig. 12). We ran t test comparisons where we had at least three results for both control and ob/ob mice. There was little in the way of differences seen in peak bladder pressures (Fig. 12A) or intercontractile intervals (Fig. 12B) in both male and female mice at all ages. Pressure amplitude at voiding in 6-mo-old female mice was statistically different, but the difference was slight. There was a suggestion that compliance was increased at 8 mo relative to 4 and 6 mo for both male and female ob/ob mice.
Fig. 12.
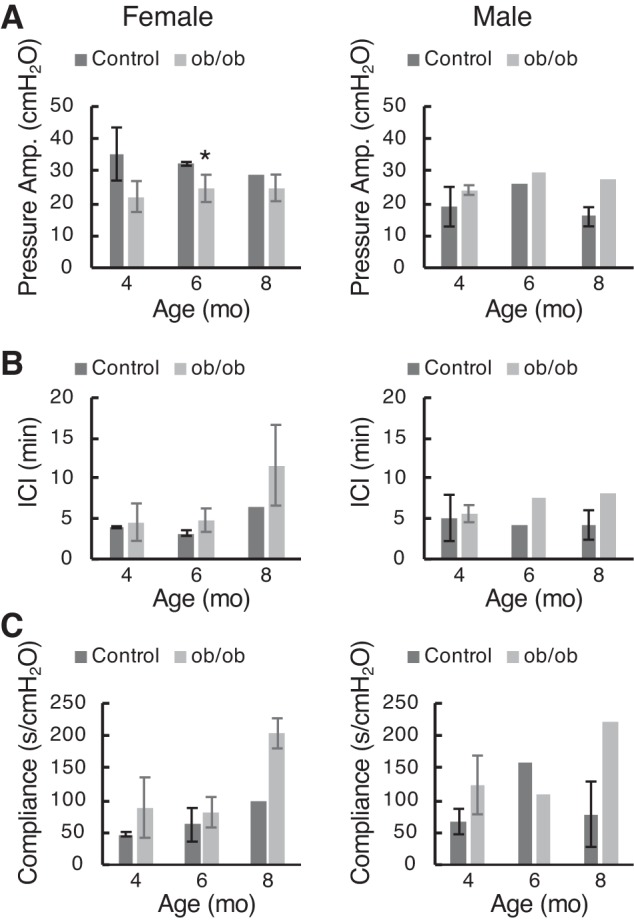
Cystometric parameters from female (left) and male (right) ob/ob mice at 4, 6, and 8 mo of age. A: pressure amplitude at voiding (peak − baseline). B: intercontractile interval. C: compliance (calculated from the inverse slope of the filling phase). Data are shown as means ± SD (where n = 3 or 4); absence of error bars means n = 2. *P < 0.05 by t test.
DISCUSSION
Because of the obvious practical and ethical difficulties of studying the natural course of diabetes in patients, it is essential that accurate and relevant animal models be identified that phenocopy the human condition. To quote from Daneshgari et al. (10), “Animal models are a critical translational tool in the research hierarchy”; but, surprisingly, if we set aside studies based on the STZ model, there has been very little done to systematically explore the natural history of UCOD in relevant mouse models, and almost no comparisons have been made between male and female mice. Therefore, the present study was undertaken with the goal of determining 1) whether several commonly used mouse models of diabetes actually develop detectable bladder dysfunction, 2) whether sex is important in the development of said dysfunction, and 3) what are the time of onset, the duration of symptoms, and the nature of symptoms.
The Akita mouse (C57BL/6-Ins2Akita/J) is a naturally occurring monogenic model of T1D that arose due to a spontaneous mutation in the insulin 2 gene (44). This mutation causes misfolding of inulin, with subsequent cytotoxicity to pancreatic β-cells (34). Our investigation of this mouse used a diabetic management strategy in which mice were given insulin periodically. The intention was to “poorly manage” the hyperglycemia by choosing insulin supplement intervals that were too long, thus ensuring episodes of normoglycemia and periods of hyperglycemia. From the glucose tolerance testing shown in Fig. 2, it is clear that for male mice, there was reasonable glycemic control for ∼1 mo of 3, during the 20 mo they were monitored. Female mice, on the other hand, responded very differently to insulin, and we lost two mice before we realized they had become dramatically hypoglycemic. We subsequently provided the remainder with sucrose water for several weeks in diminishing concentrations and then increased the interval between implants (4 mo) and reduced the dosage (one pellet instead of two pellets) for the remainder of the study. Despite the presumably poorer glycemic control in female mice, they developed no evidence of voiding abnormality.
The Akita model was remarkable for the divergent phenotypes seen between male and female mice, with male mice developing a marked polyuria in which the volume steadily increased with age. Voided volumes peaked at a remarkable 1 mL/h on VSAs (by 15 mo), with the average volume/void being 1,070 μL. Histology on aged male Akita mice revealed their bladders to be dramatically dilated. In contrast, female Akita mice were indistinguishable from controls in their voiding behavior and voided volume. Neither male nor female mice exhibited any mislocalization of voiding or any increase in small spot numbers, both signs of storage problems, even out to 18 mo of age (6, 22). Cystometric evaluation of bladder function was unfortunately lacking in sufficient numbers for us to be fully confident in the outcomes. However, while controls were mostly linear with age, showing little change in peak pressures, voiding intervals, or compliance (Fig. 4), there was a suggestion in the data that by 10 mo of age in both male and female mice there were increases in the intercontractile interval and bladder compliance. There was no difference in peak voiding pressures between Akita and control mice at different ages.
Overall, male Akita mice appeared to be more health compromised by their diabetic state, as they failed to gain weight and indeed weighed less than male control mice by 7 mo of age (Fig. 1). We conclude that male Akita mice provided insulin supplementation may be a useful model of nonobese diabetic polyuria, whereas female Akita mice under the conditions we used do not appear useful for studies of diabetic bladder dysfunction.
According to the temporal hypothesis of diabetic bladder dysfunction (9, 32), the response to chronic diabetes is biphasic, with an early “compensating” stage and a later “decompensated” stage. The former state is characterized by the bladder’s response to polyuria, which includes wall remodeling (both myogenic and neurogenic), increased capacity, increased bladder size, and increased contractility, whereas the latter reflects a response to the oxidative stress imposed by unremitting hyperglycemia. Typically, bladder decompensation is characterized by voiding symptoms such as slow flow with incomplete emptying and is accompanied by loss of tone and loss of contractility. This progression has been well characterized in STZ-treated mice but not, to our knowledge, confirmed in naturally occurring genetic models of T1D or T2D. Male Akita mice may be most useful as a model of the early compensatory phase, since the voiding frequency (by VSA) did not increase, and the volume/void did not decrease, from 7 to 18 mo of age (Fig. 3A), as might be expected for a decompensated bladder. To more fully answer this question, more cystometry with higher numbers of animals is required. Interestingly, in another study (14), untreated male Akita mice at 20 wk of age were shown to have compensated bladder function with micturition volume, residual volume, and bladder capacity all increased over controls, whereas peak bladder pressures were unchanged. This tracks closely with our observations, albeit at 4 mo of age rather than older.
The DIO model, in which one group of mice was fed a diet with high fat content (60% of calories from fat) whereas controls received a low fat content (10% from fat), demonstrated significant weight gain for high-fat diet-fed male and female mice, peaking at ~60 g. Two observations about this model are worth noting, as the difference in weight gain was not as striking as we expected. First, mice fed 60% fat developed noticeably greasy fur and may have experienced chronic deteriorating health over time, which could affect appetite (26). There is also evidence that chronic high-fat diets have effects on the hypothalamus and neurons of the arcuate nucleus that may paradoxically reduce hyperphagia (3, 4, 13). Conversely, low-fat diet-fed mice became somewhat heavier than anticipated, and this may have been due to the diet formulation used, which replaced fat with carbohydrate. While fat was only 10%, the carbohydrate content increased to 70%. It seems possible this “high-carb” diet may have contributed to the weight gain and thus reduced the weight differences between the two groups of mice.
Interestingly, there were again sex-specific differences, this time in terms of the metabolic readouts, with female mice becoming modestly but significantly hyperglycemic at 7 mo (no hyperglycemia seen at 2 mo). They also displayed insulin resistance and were hyperinsulinemic. Male mice, in contrast, were completely normal when tested at 2, 7, and 16 mo, a result that was somewhat surprising. However, the phenotyping information provided on The Jackson Laboratory website (https://www.jax.org/jax-mice-and-services/strain-data-sheet-pages/phenotype-information-380050) revealed that “mice do not develop overt type 2 diabetes, but they model early stages of the disease with phenotypes which include mildly elevated blood glucose and glucose intolerance that increases with age.” They also note that the model sometimes fails to develop in the expected way: “While they are a great model, some mice within a given study group may stop gaining weight or experience weight loss that in turn impacts glucose metabolism. In fact, there are several factors that result in milder phenotypes in DIO mouse models.” Among these, they identify stress and various environmental influences.
In our hands, the female mice developed some prediabetic metabolic disturbances that the male mice did not. Both sexes, however, completely failed to elicit any sign of bladder dysfunction, even though mice were followed for 16 mo, an amount of time far in excess of most studies, which often use 12- to 20-wk regimens. Cystometry, performed on low numbers of mice, also showed no difference between high- and low-fat diet-fed animals. Interestingly, one other study (1) using male C57BL/6J mice that were placed on high-fat and normal diets found no difference in cystometry or on muscle strip contractility between groups after 20 wk, which recapitulated our results. Unlike our findings, however, the high-fat diet-fed mice in their study did develop hyperglycemia and hyperlipidemia (1). Other groups appear to have had more success in using DIO mice as a model for eliciting voiding dysfunction (12, 29), and they regularly found enhanced contractility to electrical field stimulation, carbachol, and KCl after 10-12 wk in high-fat diet-fed mouse bladders. In contrast, however, another study (16) found reduced bladder contractility using similar experimental approaches after 12 wk of high-fat feeding. Thus, it appears this model is susceptible to subtle environmental influences that may make reliable generation of phenotypes difficult. In our hands, at least, high-fat diet feeding did not affect bladder function in either male or female mice and therefore was not a useful model for studying UCOD.
Ob/ob mice exhibited severe obesity due to overeating and at earlier time points (2-4 mo) exhibited the classic symptoms of T2D with elevated fasting blood glucose, glucose intolerance, insulin resistance, and hyperinsulinemia. Our metabolic data are consistent with those of prior work (8). We performed metabolic tests on male and female ob/ob mice at 4 and 8 mo of age and found that they were less diabetic at the later time point. Early work in this model had demonstrated three distinct periods of growth, with hyperglycemia highly correlated to the rate of fat deposition, and both were most pronounced from 1 to 3 mo of age (15). Beyond 4 mo, fat deposition was essentially complete, and glucose declined to normal values, although hyperinsulinemia and glucose intolerance persisted (15). In the context of a resolving diabetic phenotype, therefore, it is interesting that some of the void spot parameters that were abnormal in ob/ob mice at 4 and 6 mo of age had improved by 8 mo. This suggests 1) that bladder dysfunction may also correlate with the hyperglycemic state and 2) that investigations aimed at studying UCOD in ob/ob mice may be better targeted at the 3- to 6-mo age range.
The VSAs revealed several findings. First, we did not see an increase in voiding frequency (Fig. 10, number of PVSs), although for male mice overall volume and volume/void (PVS volume) were significantly increased at 8 and 6 mo, respectively. We did, however, observe significant increases in small volume spotting by female ob/ob mice at 4 and 6 mo of age but not at 8 mo (Fig. 11). Furthermore, spotting, which may be due to bladder overactivity or incontinence, was randomly located across filters, indicating a loss of normal outlet control and behavior. The tendency of mice to urinate next to the walls of the cage, as shown in Fig. 11A, left, is termed “thigmotaxis” and has been described as “wall-seeking behavior” (27, 41). Thigmotaxis is a rational response related to the fear of predation, and C57BL/6J mice of both sexes will urinate at the edge of the filter (next to the wall) on VSA. Deviations from this behavior can therefore indicate bladder dysfunction (22, 45), and it appears female ob/ob mice are particularly prone, at least while younger, to this loss of outlet control, making them the preferred sex for studying UCOD.
Cystometric evaluation in this model provided preliminary evidence for concluding no difference in peak bladder pressures between ob/ob and control mice at any age. Furthermore, there was a suggestion that female ob/ob mice might have longer intercontractile intervals at 8 mo and that bladder compliance may increase by 8 mo in both sexes. The physical differences between ob/ob and control bladders, i.e., they are larger and heavier, may in part explain differences in the observed urodynamic parameters. A study (21) performed on male mice of a closely related strain (B6.V-Lepob/J) at 7 mo of age showed that ob/ob mice had higher peak bladder pressures (28.6 vs. 18.0 cmH2O) and shorter intercontractile intervals (3.6 vs. 5 min), and these values are consistent with our data.
Taken together, the data indicate that ob/ob mice do develop some degree of bladder dysfunction and that the choice of sex and age are important in symptom development. They may represent a useful model for the study of T2D bladder dysfunction; however, the changing metabolic state of these animals, in reverse direction to human diabetes, and the profound obesity will make it difficult to distinguish between obesity-related pathology and diabetes-related effects.
GRANTS
This work was supported by National Institute of Diabetes and Digestive and Kidney Diseases Grant P20-DK-097818-02S2.
DISCLAIMERS
The content is solely the responsibility of the authors and does not necessarily represent the official views of the National Institutes of Health.
DISCLOSURES
No conflicts of interest, financial or otherwise, are declared by the author(s).
AUTHOR CONTRIBUTIONS
M.L.Z. and W.G.H. conceived and designed research; A.K.K. and C.H. performed experiments; A.K.K. and W.G.H. analyzed data; A.K.K., M.L.Z., and W.G.H. interpreted results of experiments; W.G.H. drafted manuscript; W.G.H. prepared figures; A.K.K., M.L.Z., and W.G.H. edited and revised manuscript; A.K.K., C.H., M.L.Z., and W.G.H. approved final version of manuscript.
ACKNOWLEDGMENTS
We thank Tracy Rankin (Division of Kidney, Urologic and Hematological Diseases, National Institutes of Health) for encouragement and advice in the design of these experiments. We also thank Eleftheria Maratos-Flier (Dept. of Medicine, BIDMC) for advice on relevant mouse models and instruction on performing metabolic tests.
REFERENCES
- 1.Aizawa N, Homma Y, Igawa Y. Influence of high fat diet feeding for 20 weeks on lower urinary tract function in mice. Low Urin Tract Symptoms 5: 101–108, 2013. doi: 10.1111/j.1757-5672.2012.00172.x. [DOI] [PubMed] [Google Scholar]
- 2.Ayala JE, Samuel VT, Morton GJ, Obici S, Croniger CM, Shulman GI, Wasserman DH, McGuinness OP; NIH Mouse Metabolic Phenotyping Center Consortium . Standard operating procedures for describing and performing metabolic tests of glucose homeostasis in mice. Dis Model Mech 3: 525–534, 2010. doi: 10.1242/dmm.006239. [DOI] [PMC free article] [PubMed] [Google Scholar]
- 3.Briggs DI, Enriori PJ, Lemus MB, Cowley MA, Andrews ZB. Diet-induced obesity causes ghrelin resistance in arcuate NPY/AgRP neurons. Endocrinology 151: 4745–4755, 2010. doi: 10.1210/en.2010-0556. [DOI] [PubMed] [Google Scholar]
- 4.Briggs DI, Lemus MB, Kua E, Andrews ZB. Diet-induced obesity attenuates fasting-induced hyperphagia. J Neuroendocrinol 23: 620–626, 2011. doi: 10.1111/j.1365-2826.2011.02148.x. [DOI] [PubMed] [Google Scholar]
- 5.Brown JS, Wessells H, Chancellor MB, Howards SS, Stamm WE, Stapleton AE, Steers WD, Van Den Eeden SK, McVary KT. Urologic complications of diabetes. Diabetes Care 28: 177–185, 2005. doi: 10.2337/diacare.28.1.177. [DOI] [PubMed] [Google Scholar]
- 6.Chen H, Zhang L, Hill WG, Yu W. Evaluating the voiding spot assay in mice: a simple method with complex environmental interactions. Am J Physiol Renal Physiol 313: F1274–F1280, 2017. doi: 10.1152/ajprenal.00318.2017. [DOI] [PMC free article] [PubMed] [Google Scholar]
- 7.Cho YR, Kim HJ, Park SY, Ko HJ, Hong EG, Higashimori T, Zhang Z, Jung DY, Ola MS, Lanoue KF, Leiter EH, Kim JK. Hyperglycemia, maturity-onset obesity, and insulin resistance in NONcNZO10/LtJ males, a new mouse model of type 2 diabetes. Am J Physiol Endocrinol Metab 293: E327–E336, 2007. doi: 10.1152/ajpendo.00376.2006. [DOI] [PubMed] [Google Scholar]
- 8.Chu MJ, Hickey AJ, Tagaloa S, Zhang L, Dare AJ, MacDonald JR, Yeong ML, Bartlett AS, Phillips AR. Ob/ob mouse livers show decreased oxidative phosphorylation efficiencies and anaerobic capacities after cold ischemia. PLoS One 9: e100609, 2014. doi: 10.1371/journal.pone.0100609. [DOI] [PMC free article] [PubMed] [Google Scholar]
- 9.Daneshgari F, Huang X, Liu G, Bena J, Saffore L, Powell CT. Temporal differences in bladder dysfunction caused by diabetes, diuresis, and treated diabetes in mice. Am J Physiol Regul Integr Comp Physiol 290: R1728–R1735, 2006. doi: 10.1152/ajpregu.00654.2005. [DOI] [PubMed] [Google Scholar]
- 10.Daneshgari F, Leiter EH, Liu G, Reeder J. Animal models of diabetic uropathy. J Urol 182, Suppl: S8–S13, 2009. doi: 10.1016/j.juro.2009.07.084. [DOI] [PMC free article] [PubMed] [Google Scholar]
- 11.Daneshgari F, Liu G, Hanna-Mitchell AT. Path of translational discovery of urological complications of obesity and diabetes. Am J Physiol Renal Physiol 312: F887–F896, 2017. doi: 10.1152/ajprenal.00489.2016. [DOI] [PMC free article] [PubMed] [Google Scholar]
- 12.de Oliveira MG, Nascimento DM, Alexandre EC, Bonilla-Becerra SM, Zapparoli A, Mónica FZ, Antunes E. Menthol ameliorates voiding dysfunction in types I and II diabetic mouse model. Neurourol Urodyn 37: 2510–2518, 2018. doi: 10.1002/nau.23785. [DOI] [PubMed] [Google Scholar]
- 13.Densmore VS, Morton NM, Mullins JJ, Seckl JR. 11β-Hydroxysteroid dehydrogenase type 1 induction in the arcuate nucleus by high-fat feeding: A novel constraint to hyperphagia? Endocrinology 147: 4486–4495, 2006. doi: 10.1210/en.2006-0106. [DOI] [PubMed] [Google Scholar]
- 14.Dolber PC, Jin H, Nassar R, Coffman TM, Gurley SB, Fraser MO. The effects of Ins2(Akita) diabetes and chronic angiotensin II infusion on cystometric properties in mice. Neurourol Urodyn 34: 72–78, 2015. doi: 10.1002/nau.22511. [DOI] [PMC free article] [PubMed] [Google Scholar]
- 15.Dubuc PU. Transient postweaning expression of excessive fat deposition and diabetes mellitus in ob/ob mice. Growth Dev Aging 60: 145–151, 1996. [PubMed] [Google Scholar]
- 16.Fan EW, Chen LJ, Cheng JT, Tong YC. Changes of urinary bladder contractility in high-fat diet-fed mice: the role of tumor necrosis factor-α. Int J Urol 21: 831–835, 2014. doi: 10.1111/iju.12428. [DOI] [PubMed] [Google Scholar]
- 17.Frederich RC, Hamann A, Anderson S, Löllmann B, Lowell BB, Flier JS. Leptin levels reflect body lipid content in mice: evidence for diet-induced resistance to leptin action. Nat Med 1: 1311–1314, 1995. doi: 10.1038/nm1295-1311. [DOI] [PubMed] [Google Scholar]
- 18.Gomez CS, Kanagarajah P, Gousse AE. Bladder dysfunction in patients with diabetes. Curr Urol Rep 12: 419–426, 2011. doi: 10.1007/s11934-011-0214-0. [DOI] [PubMed] [Google Scholar]
- 19.Goto Y, Suzuki K, Ono T, Sasaki M, Toyota T. Development of diabetes in the non-obese NIDDM rat (GK rat). Adv Exp Med Biol 246: 29–31, 1988. doi: 10.1007/978-1-4684-5616-5_4. [DOI] [PubMed] [Google Scholar]
- 20.Halaas JL, Gajiwala KS, Maffei M, Cohen SL, Chait BT, Rabinowitz D, Lallone RL, Burley SK, Friedman JM. Weight-reducing effects of the plasma protein encoded by the obese gene. Science 269: 543–546, 1995. doi: 10.1126/science.7624777. [DOI] [PubMed] [Google Scholar]
- 21.He Q, Babcook MA, Shukla S, Shankar E, Wang Z, Liu G, Erokwu BO, Flask CA, Lu L, Daneshgari F, MacLennan GT, Gupta S. Obesity-initiated metabolic syndrome promotes urinary voiding dysfunction in a mouse model. Prostate 76: 964–976, 2016. doi: 10.1002/pros.23185. [DOI] [PMC free article] [PubMed] [Google Scholar]
- 22.Hill WG, Zeidel ML, Bjorling DE, Vezina CM. Void spot assay: recommendations on the use of a simple micturition assay for mice. Am J Physiol Renal Physiol 315: F1422–F1429, 2018. doi: 10.1152/ajprenal.00350.2018. [DOI] [PMC free article] [PubMed] [Google Scholar]
- 24.Ikeda H, Shino A, Matsuo T, Iwatsuka H, Suzuoki Z. A new genetically obese-hyperglycemic rat (Wistar fatty). Diabetes 30: 1045–1050, 1981. doi: 10.2337/diab.30.12.1045. [DOI] [PubMed] [Google Scholar]
- 25.Kim AK, Hill WG. Effect of filling rate on cystometric parameters in young and middle aged mice. Bladder (San Franc) 4: e28, 2017. doi: 10.14440/bladder.2017.88. [DOI] [PMC free article] [PubMed] [Google Scholar]
- 26.Kuller LH. Dietary fat and chronic diseases: epidemiologic overview. J Am Diet Assoc 97, Suppl: S9–S15, 1997. doi: 10.1016/S0002-8223(97)00724-4. [DOI] [PubMed] [Google Scholar]
- 27.Kvist SB, Selander RK. Maze-running and thigmotaxis in mice: applicability of models across the sexes. Scand J Psychol 33: 378–384, 1992. doi: 10.1111/j.1467-9450.1992.tb00926.x. [DOI] [PubMed] [Google Scholar]
- 28.Lai HH, Helmuth ME, Smith AR, Wiseman JB, Gillespie BW, Kirkali Z; Symptoms of Lower Urinary Tract Dysfunction Research Network (LURN) . Relationship between central obesity, general obesity, overactive bladder syndrome and urinary incontinence among male and female patients seeking care for their lower urinary tract symptoms. Urology 123: 34–43, 2019. doi: 10.1016/j.urology.2018.09.012. [DOI] [PMC free article] [PubMed] [Google Scholar]
- 29.Leiria LO, Sollon C, Calixto MC, Lintomen L, Mónica FZ, Anhê GF, De Nucci G, Zanesco A, Grant AD, Antunes E. Role of PKC and CaV1.2 in detrusor overactivity in a model of obesity associated with insulin resistance in mice. PLoS One 7: e48507, 2012. doi: 10.1371/journal.pone.0048507. [DOI] [PMC free article] [PubMed] [Google Scholar]
- 30.Lifford KL, Curhan GC, Hu FB, Barbieri RL, Grodstein F. Type 2 diabetes mellitus and risk of developing urinary incontinence. J Am Geriatr Soc 53: 1851–1857, 2005. doi: 10.1111/j.1532-5415.2005.53565.x. [DOI] [PubMed] [Google Scholar]
- 31.Like AA, Rossini AA. Streptozotocin-induced pancreatic insulitis: new model of diabetes mellitus. Science 193: 415–417, 1976. doi: 10.1126/science.180605. [DOI] [PubMed] [Google Scholar]
- 32.Liu G, Daneshgari F. Temporal diabetes- and diuresis-induced remodeling of the urinary bladder in the rat. Am J Physiol Regul Integr Comp Physiol 291: R837–R843, 2006. doi: 10.1152/ajpregu.00917.2005. [DOI] [PubMed] [Google Scholar]
- 33.Mongiu AK, McVary KT. Lower urinary tract symptoms, benign prostatic hyperplasia, and obesity. Curr Urol Rep 10: 247–253, 2009. doi: 10.1007/s11934-009-0041-8. [DOI] [PubMed] [Google Scholar]
- 34.Oyadomari S, Koizumi A, Takeda K, Gotoh T, Akira S, Araki E, Mori M. Targeted disruption of the Chop gene delays endoplasmic reticulum stress-mediated diabetes. J Clin Invest 109: 525–532, 2002. doi: 10.1172/JCI0214550. [DOI] [PMC free article] [PubMed] [Google Scholar]
- 35.Pelleymounter MA, Cullen MJ, Baker MB, Hecht R, Winters D, Boone T, Collins F. Effects of the obese gene product on body weight regulation in ob/ob mice. Science 269: 540–543, 1995. doi: 10.1126/science.7624776. [DOI] [PubMed] [Google Scholar]
- 36.Poladia DP, Bauer JA. Functional, structural, and neuronal alterations in urinary bladder during diabetes: investigations of a mouse model. Pharmacology 74: 84–94, 2005. doi: 10.1159/000083962. [DOI] [PubMed] [Google Scholar]
- 37.Pradidarcheep W, Wallner C, Dabhoiwala NF, Lamers WH. Anatomy and histology of the lower urinary tract. Handb Exp Pharmacol 202: 117–148, 2011. doi: 10.1007/978-3-642-16499-6_7. [DOI] [PubMed] [Google Scholar]
- 38.Rajandram R, Ong TA, Razack AH, MacIver B, Zeidel M, Yu W. Intact urothelial barrier function in a mouse model of ketamine-induced voiding dysfunction. Am J Physiol Renal Physiol 310: F885–F894, 2016. doi: 10.1152/ajprenal.00483.2015. [DOI] [PMC free article] [PubMed] [Google Scholar]
- 39.Robinson D, Toozs-Hobson P, Cardozo L. The effect of hormones on the lower urinary tract. Menopause Int 19: 155–162, 2013. doi: 10.1177/1754045313511398. [DOI] [PubMed] [Google Scholar]
- 40.Shinohara M, Masuyama T, Shoda T, Takahashi T, Katsuda Y, Komeda K, Kuroki M, Kakehashi A, Kanazaw Y. A new spontaneously diabetic non-obese Torii rat strain with severe ocular complications. Int J Exp Diabetes Res 1: 89–100, 2000. doi: 10.1155/EDR.2000.89. [DOI] [PMC free article] [PubMed] [Google Scholar]
- 41.Simon P, Dupuis R, Costentin J. Thigmotaxis as an index of anxiety in mice. Influence of dopaminergic transmissions. Behav Brain Res 61: 59–64, 1994. doi: 10.1016/0166-4328(94)90008-6. [DOI] [PubMed] [Google Scholar]
- 42.Surwit RS, Kuhn CM, Cochrane C, McCubbin JA, Feinglos MN. Diet-induced type II diabetes in C57BL/6J mice. Diabetes 37: 1163–1167, 1988. doi: 10.2337/diab.37.9.1163. [DOI] [PubMed] [Google Scholar]
- 43.Vignozzi L, Gacci M, Maggi M. Lower urinary tract symptoms, benign prostatic hyperplasia and metabolic syndrome. Nat Rev Urol 13: 108–119, 2016. doi: 10.1038/nrurol.2015.301. [DOI] [PubMed] [Google Scholar]
- 44.Wang J, Takeuchi T, Tanaka S, Kubo SK, Kayo T, Lu D, Takata K, Koizumi A, Izumi T. A mutation in the insulin 2 gene induces diabetes with severe pancreatic beta-cell dysfunction in the Mody mouse. J Clin Invest 103: 27–37, 1999. doi: 10.1172/JCI4431. [DOI] [PMC free article] [PubMed] [Google Scholar]
- 45.Wegner KA, Abler LL, Oakes SR, Mehta GS, Ritter KE, Hill WG, Zwaans BM, Lamb LE, Wang Z, Bjorling DE, Ricke WA, Macoska J, Marker PC, Southard-Smith EM, Eliceiri KW, Vezina CM. Void spot assay procedural optimization and software for rapid and objective quantification of rodent voiding function, including overlapping urine spots. Am J Physiol Renal Physiol 315: F1067–F1080, 2018. doi: 10.1152/ajprenal.00245.2018. [DOI] [PMC free article] [PubMed] [Google Scholar]
- 46.Yoshioka M, Kayo T, Ikeda T, Koizuni A. A novel locus, Mody4, distal to D7Mit189 on chromosome 7 determines early-onset NIDDM in nonobese C57BL/6 (Akita) mutant mice. Diabetes 46: 887–894, 1997. doi: 10.2337/diab.46.5.887. [DOI] [PubMed] [Google Scholar]
- 47.Yu W, Ackert-Bicknell C, Larigakis JD, MacIver B, Steers WD, Churchill GA, Hill WG, Zeidel ML. Spontaneous voiding by mice reveals strain-specific lower urinary tract function to be a quantitative genetic trait. Am J Physiol Renal Physiol 306: F1296–F1307, 2014. doi: 10.1152/ajprenal.00074.2014. [DOI] [PMC free article] [PubMed] [Google Scholar]


