Abstract
The seed morphology of three pseudocereal grains (PSCg), i.e. quinoa (Chenopodium quinoa Willd, Chenopodiaceae), buckwheat (Fagopyrum esculentum Moench, Polygonaceae) and amaranth (Amaranthus caudatus L., Amaranthaceae) was studied by light microscopy (LM) and Environmental Scanning Electron Microscopy coupled with Energy Dispersive Spectroscopy (ESEM-EDS). LM was used with visible light to evaluate either unstained sections or sections stained with Azan mixture, and with fluorescent light. The aim of the study was to compare the architecture of the three seeds in order to connect their morphology with nutrient localization. The Azan staining allowed for the visualization of the seed coat, the embryo - with its shoot apical meristem - and the radicle cell layers, whereas the use of fluorescence microscopy identified the cells rich in phenolic compounds. Finally, the ESEM-EDS analysis revealed that the seed coat of the quinoa was thinner than that of amaranth or buckwheat. In all PSCg, starch granules appeared to be located in large polygonal cells, surrounded by a thin cell wall. Several globoids of proteins were observed in the embryo cells. In the radicle section, the vascular bundles of the procambium were evident, while Amaranth only showed a consistent layer of calcium crystals, located between the embryo and the perisperm. The morphological differences of the three PSCg were discussed in the context of their structural resistance to processing technologies which impact on nutritional value of derived foods.
Key words: Pseudocereals, autofluorescence, Azan, environmental SEM, EDS
Introduction
Angiosperm plants are divided in two classes: monocotyledons and dicotyledons. This distinction is based on the number of seminal leaves of the embryo. The cereals belong to the monocotyledons, while the so-called pseudocereal grains (PSCg) belong to the dicotyledons. Cotyledons are organs which synthesize and store proteins, starch and lipids, to be used by the plantula during etherotrophic growth. In grasses embryos, cotyledon is enclosed in a thin protective sheath, while the membrane which protects the root is called coleorhiza.1
In most monocot and some dicot seeds, the food storing tissue is the endosperm, while the outermost layer contains the aleurone, rich of protein bodies and enzymes, and is protected by the seed coat. Such seeds are called “endospermic” seeds. Buckwheat (Fagopyrum esculentum Moench, Polygonaceae) belongs to this category. In the majority of dicots and in some monocots, the endosperm is consumed during seed development; consequently, food is stored in the cotyledons and in the perisperm. These are called “perispermic” seeds. Quinoa (Chenopodium quinoa Willd, Chenopodiaceae) and amaranth (Amaranthus cruentus L., Amaranthaceae) are included in this second class.
PSCg have received a great deal of attention due to their nutritional value and gluten free characteristics.2 They represent an important alternative to cereal flours for those people who suffer from celiac disease or gluten sensitivity syndrome.3 PSCg are rich in macronutrients, such as proteins, carbohydrates and lipids,4,5 as well as micronutrients, including vitamins, minerals6 and phenol compounds, mainly flavonoids, such as catechins, rutin and phytosterols, whose health benefits have been shown.7
Nutrient content and preservation during PSCg processing are of central importance for food technologists and nutritionists.8 In fact, PSCg are suitable not only as substitutes for cereals containing gluten, but also for the production of functional foods.9 Functional foods require the maintenance of the highest concentration of nutrients; hence, the processing would have to be specifically adapted to each type of PSCg.6,10,11 Indeed, PSCg show different external and internal seed architectures5,12 with consequent differences in nutrient distribution.13 These differences may lead to important losses in nutrients if the mechanical processing of the seeds is inadequate.10,14 In addition, correct handling of PSCg is also fundamental in the brewing process, which requires intact seeds for malting.15 For all of the above mentioned reasons, the morphological structure of PSCg is receiving growing attention, taking also into consideration that the knowledge of their fragile points could help to reduce seed losses and improve industrial production. 16
In this work, we performed morphological analyses of buckwheat, quinoa and amaranth seeds using light microscopy (LM) and Environmental Scanning Electron Microscopy, coupled with Energy Dispersive Spectroscopy (ESEM-EDS) in order to localize the nutrient reserves and perform elemental analyses of the seed compartments. The attention was particularly focused on the cell lines, where the phenol compounds are located. The study was conducted for comparative purposes in order to increase the knowledge for improving the technology of the PSGg transformation.
Materials and Methods
Light and fluorescence microscopy analysis
The seeds of buckwheat, quinoa and amaranth were obtained from a local agro-food company (Terra Bio, Urbino, PU, Italy) and used in both their hulled and dehulled forms. After seed softening by incubation in water, at a water/alkene ratio 4:1 (v/v) for 22 h, the seeds were fixed in 4% formalin solution for 2 h. Samples were then dehydrated with an increasing ethanol series (75-90-95-100%) then with toluene and finally immersed in liquid paraffin, using the Shandon Excelsior TM Processor (Thermo Electron Corporation, Waltham, MA, USA). After the processing cycle, the samples were embedded in paraffin blocks using a Tissue-Tek Tissue Embedding Console System (Diapath, Bergamo, Italy). The far ends of the cross sections of the seeds of buckwheat were pointed down. Quinoa and amaranth seeds were embedded whole.
The paraffin blocks were cut into 4-μm-thick sections with a RM2255 microtome (Leica Biosystem, Wetzlar, Germany). The sections were collected on slides treated with Capture Pen (Cancer Diagnostics Inc., Durham, NC, USA) to prevent separation of tissue samples and to ease extension procedures, and then kept overnight in an oven at 40°C. The slides were then deparaffinized with xylene, hydrated with ethanol and distilled water according to the alcohol sequence: 100-95-70% and finally distilled water. Both the deparaffinization and hydration processes were performed by a Autostainer XL ST5010 (Leica Biosystem; Wetzlar, Germany).
The sections obtained by using the above described procedures were divided into two groups. The former underwent staining with Azan trichrome. The latter did not undergo any staining procedure.
The staining with Azan trichrome was performed following the procedure proposed by Heidenhain, which uses three dyes, Azocarmine, Orange G and Aniline Blue. The Azocarmine allows for the staining of proteins and nucleic acids, the Orange G the staining of polysaccharides, whereas Aniline Blue is suitable for staining cellulose fibers.17
The examination of the stained slides was carried out using a camera ICC50W associated with a microscope Leica DM2500, whereas the unstained sections were examined using an Axioskop 2 fluorescence microscope (Carl Zeiss, Oberkochen, Germany), with an excitation wavelength of 365 nm and an emission of 418 nm in order to identify the autofluorescence of flavonoids.18
ESEM-EDS analysis
The analyses were performed as reported in a previous paper of the same research group.16 Briefly, immediately prior to the analyses, PSCg were cut into perpendicular slices (transversal or longitudinal sections) with a sharp stainless-steel razor. The slices were deposited onto the aluminum specimen stubs, previously covered with a conductive carbon adhesive disk (Taab Ltd., Berks, UK). A FEI Quanta 200 FEG Environmental Scanning Electron Microscope (FEI, Hillsboro, OR, USA), equipped with an energy dispersive X-ray spectrometer (Edax Inc., Mahwah, NJ, USA), was used. The analyses were performed by using a focalized electron beam in a vacuum electron gun pressure of 5.0 e-6 mbar. The ESEM was utilized in low vacuum mode with a specimen chamber pressure set from 0.80 to 0.91 mbar, an accelerating voltage of 25 kV, and a magnification ranging between 40 and 22,000x. The images were obtained by means of the back-scattered electron detector.
The spectrometer unit was equipped with an ECON (Edax Carbon Oxigen Nitrogen) 6 utw x-ray detector and Genesis Analysis software. Each sample was analyzed with a time count of 100 s and an Amp Time of 51, while the probe current was 290 μA.
Results
Figure 1 shows the transverse section of a buckwheat seed examined with the light microscopy. As the seed shape is pyramidal, the spatial organization of the cotyledons changes from bottom to top. In the bottom part of the seed (Figure 1A), the two cotyledons show a typical sinusoidal pattern and remain in tight contact with one another, as previously described.19 The endosperm largely covers the remaining area (Figure 1A). In the middle part of the seed (Figure 1B), the cotyledons are spirally packed around the center, which is represented by the radicle. The section of the radicle shows its concentric purple-stained cell circles. At the periphery, the cotyledons extend along the seed coat, whereas the endosperm is mostly restricted to the inner part of the cotyledon loops. Figure 1C shows the apical part of the seed section. In the center, part of the cotyledons and the circular structure of the root tip are evident, whereas at the periphery, the seed coat is depicted as well (Figure 1C). Figure 1D shows the cotyledons and a section of the radicle at a higher magnification. In this figure we can observe the following cell stratification: the epiderm in the outer layer, cortical and meristem cell lines in the intermediate layers and vascular bundles of the procambium in the center. Figure 1E shows the fluorescent cells of the aleurone layer, localized under the seed coat, whereas the endosperm is characterized by a pale fluorescent signal. Figure 1F shows the concentric root structure, exhibiting a strong fluorescent signal in the epiderm and procambium.
Figure 2 shows ESEM images of the buckwheat seed section. In Figure 2A, the typical “S” shape of the cotyledons can be observed in the middle of the triangular transverse section. Figure 2B shows a longitudinal seed section with the cotyledons and the root. The cotiledonary node and the embryonal axis are well defined.15
Figure 2C shows the cotyledons with their protective sheaths and the endosperm. Vascular holes are also detectable inside the cotyledons. Increasing the magnification (Figure 2D), the fine cellular structure of the cotyledons becomes evident as well as its protective sheath. The starchy granules are recognizable as large ridged structures, surrounded by a thin, 4-6 μm-thick cell wall.19 Figure 2E shows the cotyledon protective sheath exhibiting a row of vascular holes in the inner part. Figure 2F shows the seed coat with the pericarp, the outer and inner testa, followed by the tegmen and the protective sheath of the cotyledon. The seed coat was about 50 μm thick, whereas the thickness of the cotyledon sheaths was in the range 4-6 μm.19,20
Figure 1.
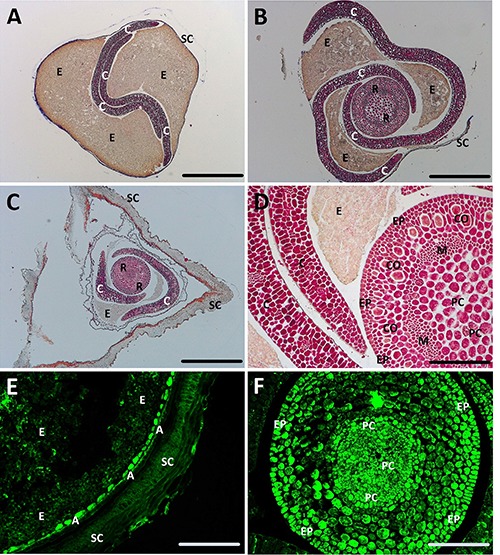
Light microscopy of transverse sections of buckwheat seed. A-D) Sections stained with Azan trichrome; E-F) unstained sections observed at fluorescence microscopy; A) bottom part of the seed; B) intermediate part; C) top of the seed. A, Aleurone; C, cotyledon; CO, cortical; E, endosperm; EP, epiderm outside; M, meristem; PC, procambium; R, radicle; SC, seed coat. Scale bars: A-C) 125 μm; D-F) 31 μm.
Figure 3 shows Azan staining and fluorescence of sections of a quinoa seed. Figure 3A shows the typical ellipsoidal shape of the curved embryo, with the cotyledons, the shoot apical meristem and the root. The embryo surrounds the perisperm, which stores starch. Figure 3B shows the fluorescence of the cotyledons, the micropylar endosperm and the root tip, in their point of convergence. The micropylar endosperm is interrupted, in correspondence with the root tip, due to the mechanical stress in the preparation of the sections. The chalazal endosperm separates the cotyledon compartment and the root cup21 and the chalzal seed coat. Indeed, the remaining part of the funicle appears markedly fluorescent. Figure 3C shows the Azan staining of the cotyledons, the shoot apical meristem, at higher magnification. The meristem shows lines of proliferating cells constituting the embryo proper.21 Figure 3D shows the shoot appendix at fluorescence microscopy with scattered spots of bright fluorescent cells. Figure 3E shows the Azan stain of the root, revealing the seed coat, the micropylar endosperm and the root tip cell organization. Figure 3F shows the fluorescent signal in the root tip and micropylar endosperm; the funicle and chalazal endosperm in bright green are evident as well. Figure 3G shows the pericarp and the seed coat with the testa, tegmen in contact with the peripheral endosperm after Azan staining. In the outer layer, the pericarp is constituted by large and papillose cells, while in the inner layer, the tegmen firmly attaches the peripheral endosperm to the seed coat.22 In the lower right corner of Figure 3G, the cotyledon, with its protective sheath, is also visible. Figure 3H shows the same structures as Figure 3G in fluorescence.
Figure 2.
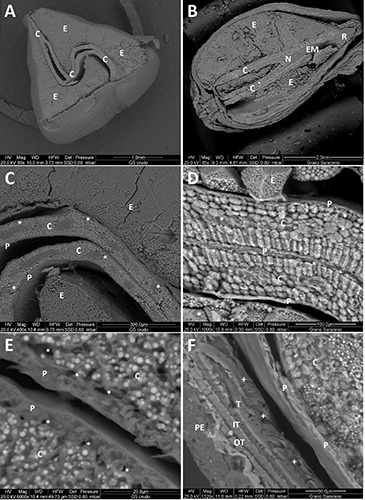
ESEM micrograph of sections of buckwheat seed. A) Transverse section; B) longitudinal section; C-F) cotyledon details. *, vascular holes; +, peripheral endosperm; C, cotyledon; E, endosperm; EM, embryo axis; IT, inner testa; N, node; OT, outer testa; P, protective sheath; PE, pericarp; R, radicle; T, tegmen.
Figure 4 shows ESEM-EDS images of the quinoa seed. In Figure 4A, the longitudinal section shows the circular embryo, enveloping the perisperm. In Figure 4B, the cotyledons and shoot apical meristem are evident, with the pericarp as well. Figure 4C shows the inner side of the pericarp and the root tip. The inner pericarp reveals a structure with a close network of scarves, dividing the root tip and the perisperm. Figure 4D shows the cross section of the quinoa seed. A wide perispermic zone is evident between the root on the right and the cotyledons on the left. Figure 4E shows a section of the two cotyledons, with the smooth surface of the protective sheaths. Figure 4F shows the root section, with the outer epiderm in the periphery, while in the middle, the vascular bundles of the procambium appear as a six-hole network around each cell. The cells of the root are full of globoids, (Figure 4G) containing proteins and phytates, as revealed by the EDS scanned surface of the surrounded area (Figure 4H). In fact, the ESEM-EDS elemental analysis peaks, showed a remarkable concentration of P, Mg and K (Figure 4H), suggesting that the composition of phytates, i.e. a six-fold dihydrogenphosphate ester of inositol, is in the form of Mg and K salts23. Peaks of C, O, and N indicated the presence of proteins (Figure 4H).
Figure 3.
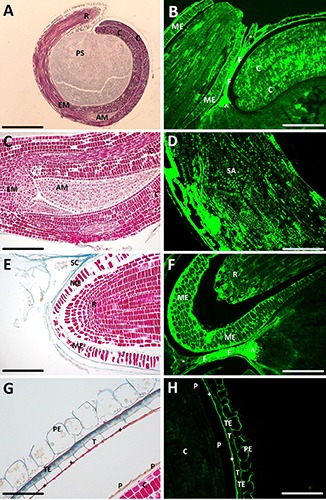
Light microscopy of transverse sections of quinoa seed. A,C,E,G) Sections stained with Azan trichrome; B,D,F,H) unstained sections observed at fluorescence microscopy. ^, chalazal endosperm; +, peripheral endosperm; °, chalazal seed coat; AM, apical meristem; C, cotyledon; EM, embryo axis; F, funicle; ME, micropylar endosperm; P, protective sheath; PE, pericarp; PS, perisperm; R, radicle; SA, shoot apex; SC, seed coat; T, tegmen; TE, testa. Scale bars: A) 200 μm; B) 80 μm; C) 55 μm; D,F) 45 μm; E) 43 μm; G) 24 μm; H) 50 μm.
Figure 4.
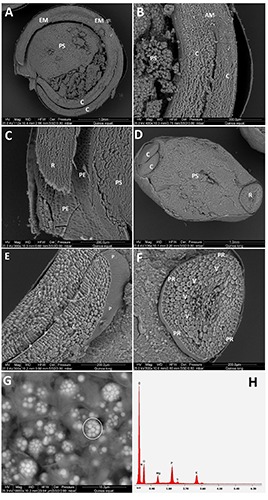
ESEM analysis of sections of quinoa seed. A) Transverse section; D) longitudinal section; B,C,E,F) cotyledon and root details; G) high magnification of globoids inside cells of the root typ’s cortical layer; the surrounded area represents the field for the analysis showed in H. H) Elemental composition of the cell globoids. AM, apical meristem; C, cotyledons; EM, embryo axis; P, protective sheath; PE, pericarp; PR, protoderm; PS, perisperm; R, radicle; V, vascular bundles.
Figure 5 shows the Azan trichrome staining and the fluorescence of the amaranth seed sections. The oval shape of the seed in Figure 5A shows part of the cotyledons and in particular the root with its shoot apical meristem. Figure 5B shows the shoot apical meristem at a higher magnification with the lines of cells generating the embryo axis; the perisperm shows uniform gray staining. Figure 5C shows the auto-fluorescence of the cotyledons, the peripheral endosperm and the seed coat. A zone, where the tegmen and the testa have lost their conjunction, is visible in the lower left corner; in the inner part of the seed, the protective sheath, which separates the cotyledons from the perysperm, also shows a bright fluorescence signal. Figure 5D shows the cotyledons with the chalazal endosperm and the perisperm, exhibiting a scattered fluorescence. Sporadic fluorescent spots are also present inside the cotyledons. Figure 5E shows the micropylar endosperm, characterized by a very strong fluorescence signal, and the root tip with the funicle. In Figure 5F, the cross section of the root is depicted and the fluorescence pattern of the micropylar endosperm, as seen in Figure 5E, is confirmed.
Figure 6 shows the ESEM analysis of the amaranth seed. Figure 6A shows the pericarp, the cotyledons and the root. The root apical meristem and the micropylar endosperm are detectable. The embryo and perisperm are organized in a similar way as in the quinoa seed. A line of Ca crystals, possibly oxalates, was detected on the edge of the perisperm. This calcified layer clearly appears in the amaranth cross section of Figure 6B, encircling the root and the cotyledons. Figure 6C shows details of the cotyledons, the shoot apical meristem and the seed coat, as well as the Ca rich membrane, as revealed by EDS analysis. The thickness of the seed coat is also appreciable. Figure 6D shows the cotyledons at higher magnification, with their globoid rich cells and protective sheath, which separates the two cotyledons. Figure 6E shows the radicle protective sheath at higher magnification with bright and sharp crystals deposited around the root. The square evidenced area represents the field analyzed by EDS in Figure 6H. The polygonal starch cells of the perisperm are evident as well; the globoid rich cells of the root are also clearly visible, displaying vascular bundles with hexagonal networks. Figure 6F reveals a detail of the pyramidal shape of the crystals at higher magnification of Figure 6E. The density of sharp crystals stored in the slit between the prismatic starch cells and the protective sheath is impressive. EDS analyses (Figure 6G) performed on globoids of Figure 6E reveals the relative amount of chemical elements that is compatible with the presence of phytates both in the form of Mg and K salts as well as in minor part in the form of Ca salts. The composition of the sharp crystals is defined at the EDS analysis by the high presence of Ca ions which are compatible with Ca-oxalates and in minimal part with Ca-phosphates (Figure 6H).
Figure 5.
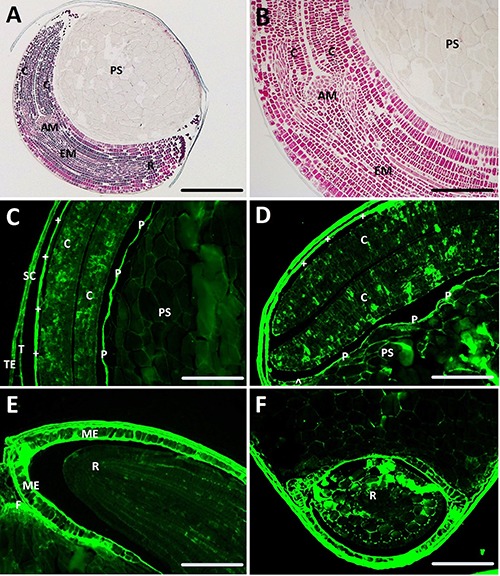
Light microscopy of sections of amaranth seed. A,B) Sections stained with the Azan trichrome; C,D,E,F) unstained sections observed at fluorescence microscopy. ^, chalazal endosperm; +, peripheral endosperm; AM, apical meristem; C, cotyledon; EM, embryo axis; F, funicle; ME, micropylar endosperm; P, protective sheath; PS, perisperm; R, radicle; SC, seed coat; T, tegmen; TE, testa. Scale bars: A) 100 μm; B) 25 μm; C) 50 μm; D) 22 μm; E,F) 36 μm.
Figure 6.
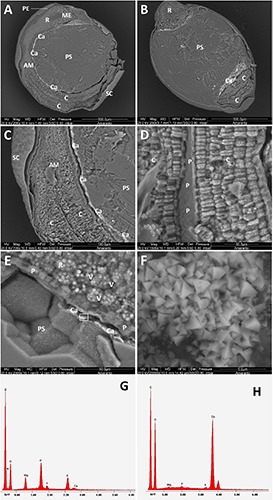
ESEM micrograph of sections of amaranth seed. A) Transverse section; B) longitudinal section; C,D,E) cotyledon, root and perisperm details; the evidenced area in E represents the field of the high magnification micrograph (F) showing a geometrical repetitive morphology of the crystals; G) elemental composition of the cell globoids; H) EDS analysis of the Ca crystals showed in F. AM, apical meristem; C, cotyledon; Ca, calcium crystals; ME, micropylar endosperm; P, protective sheath; PE, pericarp; PS, perisperm; R, radicle; SC, seed coat.
Discussion
The present analysis of quinoa, amaranth and buckwheat was conducted by using both LM and ESEM-EDS to obtain as many as possible morphological data in order to compare non-perispermic (buckwheat) vs. perispermic (quinoa and amaranth) PSCg. The extensive iconography presented herein helps the reader to fully appreciate the different architecture of the two categories of PSCg. Moreover, this comparison benefited from the non-conventional use of Azan trichrome, which is usually applied on human tissues. Indeed, the Azan staining provided an appreciable contrast among the different cell lines of the seeds, thanks to the three-component dyes.17 In addition, in unstained sections, fluorescence microscopy was able to highlight cells containing flavonoids, which are mainly represented by rutin and quercetin in PSCg.24 Finally, the ESEMEDS analysis provided the elemental composition of the parts of seeds, as well as the details of the seed organs at high resolution.16
In our opinion, the innovative aspect of this study is represented by the parallelism of application of different and complementary analysis techniques on three different types of PSCg, in an attempt to correlate morphological aspects, semi-quantitative analytical data and nutritional considerations. The comparative morphological analysis shows that quinoa and amaranth share a similar structural organization with few differences. On the other hand, buckwheat morphology is peculiar for many aspects that were evidenced by earlier studies in comparison with barley.15
In both quinoa and amaranth, the embryo, with its storage cotyledons and radicle, encircles the perisperm,22,25 full of starch polygonal cells, characterized by thin membranes.15 The shoot apical meristem, containing cell lines growing in the direction of both the root and the cotyledons, is detectable in the middle of the embryo. Cells of the embryo proper are longitudinally oriented and distinguishable from those of the outer layers of the root, which are perpendicular to the embryo proper. In the cotyledons and the radicle, the cells are full of globoids, which are protein filled storage vacuoles. Our ESEM-EDS elemental analysis revealed the presence of phytates mainly in the form of Mg and K salts. The cotyledon protective sheaths are thin and smooth; they separate the two cotyledons from the peripheral endosperm and allow for the cotyledons to quickly exchange nutrients with other seed compartments. 1,9 In the root, many vascular bundles were clearly visible around the globoid rich cells. Vascular bundles are important functional elements, as they provide a flux of water, oxygen and nutrients toward the germinating seed.1,21 In both quinoa and amaranth, the Azan trichrome stained the peripheral and micropylar endosperm in purple, due to the acidic content of nucleic acids and proteins of the cells, which quickly replicate during seed germination. 21 Fluorescence depicts the peripheral and micropylar endosperm cells in bright green, thus indicating the substantial presence of phenol compounds, which represent a protective nutrient reservoir for the replicating cells of the germ.21 The fluorescence showed the highest signal in the micropylar endosperm and caliptra, whose external cells are lost and substituted with new cells, which require a vigorous antioxidant defence guaranteed by the phenol pool.26 Indeed, the fluorescence signal was more intense in the seed coat and cotyledon membrane of amaranth compared to quinoa. This suggested the presence of larger amounts of phenols in amaranth.27 However a purely qualitative analysis, although it is conducted in situ in the seed, was performed, and a quantitative analysis of the fluorescence intensity was not performed. This it does not allow us to further define the differences between samples or in the different parts of the same sample.
The ESEM analysis showed that the seed coat is closely attached to the peripheral endosperm in both quinoa and amaranth, but the seed coat of amaranth was found to be slightly thicker. Indeed, quinoa presented a fragile seed coat in the equatorial region.27 This structural difference can influence the concentration of nutrients lost during the industrial processing phases, due to the breakage of the seeds. Another difference between quinoa and amaranth seeds, which was revealed by ESEM - EDS, lies in their mineral concentration. Indeed, amaranth shows a high concentration of Ca salts, possibly oxalates, which are absent in quinoa. The morphological analysis of buckwheat revealed its peculiar pattern of cotyledon organization. The cotyledons start from the cotyledonary node in the center of the pyramidal kernel, where the hypocotyls and the root are located,19 and extend along the testa showing several globoids inside the cells. The ESEM also revealed the radicle vascular bundles, organized as a hexagonal network around each cell to drain water and nutrients to the root. This large vascular system, also present in quinoa and amaranth, is one of the main reasons why PSCg are able to germinate more rapidly than true cereals.9 This morpho-functional aspect can underline the important role of PSCg in the malting industry.
The buckwheat endosperm is full of starchy granules, enclosed in prismatic cells with thin membranes, thus confirming their optimal bio-accessibility to the digestive enzymes, as previously demonstrated by Wijngaard et al.15 and Gregori and Kreft.20 The autofluorescence of the buckwheat aleurone layer confirms the important and stable presence of a nutrient reservoir containing several flavonoids.24,26 At present, the PSCg processing methods are very often the same as those used for true cereals, which have a completely different morphology and resistance to mechanical stresses.20 The three PSCg described in the present study, require tailor-made individual processing methods, based on our evidence. At present, buckwheat processing involves dehulling with heat treatments, abrasion to eliminate the saponins, which confer a bitter taste,14 followed by milling and sieving. Therefore, buckwheat, showing a very compact structure, appears more suitable to undergo extensive mechanical processing than amaranth and quinoa. Quinoa has a very thin pericarp fused with the peripheral and micropylar endosperm; hence, it is quite vulnerable during decortication, pearling and polishing.9 Accordingly, the type and intensity of mechanical treatments must be as gentle as possible, to avoid damage to the perispherm with the consequent loss of phenols, proteins and vitamins. Similar care must be taken in the processing of amaranth, although its pericarp is a little more resistant than that of quinoa. Therefore, the right kind of balanced processing methods must be developed to improve processing plants.10
Finally, fluorescence microscopy, extensively applied in this study, could be used to simply and routinely monitor the phenol concentration of seeds during prolonged storage, as these nutrients are known to be useful markers of the aging of vegetable prod ucts.28 In conclusion, the morphological analysis of PSCg by LM and/or ESEM provides significant information which can be used to optimize storage conditions and to develop tailor-made methods for converting seeds into flours with minimum nutrient losses.
Acknowledgements
The authors wish to thank the ARPAM, Pesaro Department (Pesaro, PU, Italy) for collaboration with the University of Urbino Carlo Bo in the management of the ESEM-EDS Laboratory. Dr. Andrea Guidarelli of the Department of Biomolecular Sciences at the University of Urbino “Carlo Bo” is also acknowledged for the skill technical assistance at the Fluorescence Microscopy Lab.
References
- 1.Rosenstrater KA, Evers AD. Kent’s technology of cereals. Sawston, UK: Woodhead Publ.; 2017. [Google Scholar]
- 2.Alvarez-Jubete L, Arendt EK, Gallagher E. Nutritive value and chemical composition of pseudocereals as gluten-free ingredients. Int J Food Sci Nutr 2009;60:240-57. [DOI] [PubMed] [Google Scholar]
- 3.Zevallos VF, Herencia LI, Chang F, Donnelly S, Ellis HJ, Ciclitira PJ. Gastrointestinal effects of eating Quinoa (Chenopodium quinoa Willd.) in celiac patients. Am J Gastroenterol 2014;109:270-8. [DOI] [PubMed] [Google Scholar]
- 4.Mota C, Santos M, Mauro R, Samman N, Matos AS, Torres D, et al. Protein content and amino acids profile of pseudocereals. Food Chem 2016;193:55-61. [DOI] [PubMed] [Google Scholar]
- 5.Wood SG, Lawson LD, Fairbanks DJ, Robison LR, Andersen WR. Seed lipid content and fatty acid composition of three quinoa cultivars. J Food Compos Anal 2016;6:41-4. [Google Scholar]
- 6.Tang Y, Tsao R. Phytochemicals in quinoa and amaranth grains and their antioxidant, anti-inflammatory, and potential health beneficial effects: a review. Mol Nutr Food Res 2017;61. doi: 10.1002/mnfr.201600767. [DOI] [PubMed] [Google Scholar]
- 7.Krkošková B, Mrázová Z. Prophylactic components of buckwheat. Food Res Int 2005;38:561-8. [Google Scholar]
- 8.Ruales J, Nair BM. Saponins, phytic acid, tannins and protease inhibitors in quinoa (Chenopodium quinoa Willd.) seeds. Food Chem 1993;48:137-13. [Google Scholar]
- 9.Abugoch James LE. Quinoa (Chenopodium quinoa Willd.): Composition, chemistry, nutritional, and functional properties. Adv Food Nutr Res 2009;58:1-31. [DOI] [PubMed] [Google Scholar]
- 10.Murty VS, Padhi P, Padhi D, Padhi D. A modified dehulling machine for abrasive dehulling of quinoa version 2.0. Int J Agric For Plant 2016;3:13-5. [Google Scholar]
- 11.Nisar Ahmad Mir NA, Riar CS, Singh S. Nutritional constituents of pseudo cereals and their potential use in food systems: A review. Trends Food Sci Tech 2019;75:170-80. [Google Scholar]
- 12.Katar D, Olgun M, Turan M. Analysis of morphological and biochemical characteristics of buckwheat (Fagopyrum esculentum Moench) in comparison with cereals. CyTA - J Food 2016;14:176-85. doi: 10.1080/19476337.2015.1076522. [Google Scholar]
- 13.Valcárcel-Yamani B, Caetano da Silva Lannes S. Applications of quinoa (Chenopodium Quinoa Willd.) and amaranth (Amaranthus Spp.) and their influence in the nutritional value of cereal based foods. Food Publ Health 2012;2:265-75. [Google Scholar]
- 14.Keriene I, Mankeviciene A, Bliznikas S, Cesnuleviciene R, Janaviciene S, Jablonskyte-Rasce D, et al. The effect of buckwheat groats processing on the content of mycotoxins and phenolic compounds. CyTA - J Food 2016;14:565-71. doi: 10.1080/19476337.2016.1176959. [Google Scholar]
- 15.Wijngaard HH, Renzetti S, Arendt EK. Microstructure of buckwheat and barley during malting observed by confocal scanning laser microscopy and scanning electron microscopy. J I Brewing 2007;113:34-41. [Google Scholar]
- 16.Antonini E, Zara C, Valentini L, Gobbi P, Ninfali P, Menotta M. Novel insights into pericarp, protein body globoids of aleurone layer, starchy granules of three cereals gained using atomic force microscopy and environmental scanning electronic microscopy. Eur J Histochem 2018;62:2869. doi: 10.4081/ejh.2018.2869. [DOI] [PMC free article] [PubMed] [Google Scholar]
- 17.Panato A, Antonini E, Bortolotti F, Ninfali P. The histology of grain caryopses for nutrient location: a comparative study of six cereals. Int J Food Sci Tech 2017;52:1238-45. [Google Scholar]
- 18.Fulcher RG. Fluorescence microscopy of cereals. J Food Struct 1982;1:167-75. [Google Scholar]
- 19.Kreft S, Kreft M. Localization and morphology of the buckwheat embryo. Fagopyrum 2000;17:15-9. [Google Scholar]
- 20.Gregori M, Kreft I. Breakable starch granules in a low-amylose buckwheat (Fagopyrum esculentum Moench) mutant. J Food Agric Environ 2012;10:258-62. [Google Scholar]
- 21.Becker MG, Hsu SW, Harada JJ, Belmonte MF. Genomic dissection of the seed. Front Plant Sci 2014;5:464. [DOI] [PMC free article] [PubMed] [Google Scholar]
- 22.Prego I, Maldonado S, Otegui M. Seed structure and localization of reserves in Chenopodium quinoa. Ann Bot 1998;82:481-8. [Google Scholar]
- 23.Lott JNA. Accumulation of seed reserves of phosphorus and other minerals. Murray DR, editor. Seed physiology, vol. 1 New York, NY: Academic Press; 1984. [Google Scholar]
- 24.Giménez-Bastida JA, Zielinski H, Piskula M, Zielinska D, Szawara-Nowak D. Buckwheat bioactive compounds, their derived phenolic metabolites and their health benefits. Mol Nutr Food Res 2017;61. doi: 10.1002/mnfr.201600475. [DOI] [PMC free article] [PubMed] [Google Scholar]
- 25.Irving DW, Becker R. Seed structure and composition of potential new crops. Food Microstruct 1985;4:43-53. [Google Scholar]
- 26.Burrieza HP, López-Fernández MP, Maldonado S. Analogous reserve distribution and tissue characteristics in quinoa and grass seeds suggest convergent evolution. Front Plant Sci 2014;5:546. [DOI] [PMC free article] [PubMed] [Google Scholar]
- 27.Gibson LJ. The hierarchical structure and mechanics of plant materials. J R Soc Interface 2012;9:2749-66. [DOI] [PMC free article] [PubMed] [Google Scholar]
- 28.Frati A, Antonini E, Ninfali P. Industrial freezing, cooking and storage differently affect antioxidant nutrients in vegetables. Watson R, Preedy V, editors. Fruits, vegetables, and herbs: Bioactive foods in health promotion. Cambridge, MA: Academic Press; 2016. [Google Scholar]


