

Abstract
In this study, we analyzed age variation in the association between obesity status and US adult mortality risk. Previous studies have found that the association between obesity and mortality risk weakens with age. We argue that existing results were derived from biased estimates of the obesity-mortality relationship because models failed to account for confounding influences from respondents' ages at survey and/or cohort membership. We employed a series of Cox regression models in data from 19 cross-sectional, nationally representative waves of the US National Health Interview Survey (1986–2004), linked to the National Death Index through 2006, to examine age patterns in the obesity-mortality association between ages 25 and 100 years. Findings suggest that survey-based estimates of age patterns in the obesity-mortality relationship are significantly confounded by disparate cohort mortality and age-related survey selection bias. When these factors are accounted for in Cox survival models, the obesity-mortality relationship is estimated to grow stronger with age.
Keywords: cohort, life course, mortality, obesity, United States
There is now ample evidence and widespread agreement that a massive epidemic of obesity has spread across the United States (1). What is less clear and much more thoroughly debated are the public health consequences the epidemic confers. Concern over the epidemic is spurred by evidence of strong links between obesity and disability and between obesity and life-threatening diseases such as diabetes, heart disease, stroke, and multiple types of cancer (2–17). In this view, the public health consequences are probably already large and are only likely to grow as the prevalence of obesity expands and the duration of exposure accumulates across cohorts.
Another strand of investigation has invigorated a different view of the epidemic's public health consequences. This approach applies a seemingly straightforward gauge of the epidemic's impact by assessing the link between obesity and US adult mortality risk. The results of these inquiries are startling in that they appear to directly challenge claims that the epidemic has or will induce a toll on the public's health. The obesity-mortality association is not as large as expected and often appears to be robust only among the extremely obese (i.e., persons with a body mass index (BMI; weight (kg)/height (m)2) of 35 or higher) (18, 19). Moreover, the association is estimated to diminish with age, so as to suggest, for example, that for middle-aged people (age 40–65 years) obesity is a significant risk factor for mortality, but for older people (age ≥65 years) it is not significantly associated with increased mortality risk—or, as some evidence suggests, might even confer a survival advantage (20–25). Further, significant differences in relative mortality risk do not necessarily denote substantively large absolute differences in survival (26). Thus, the significant differences in relative survival observed between the obese and normal-weight populations at younger ages do not translate into substantively large differences in longevity (19). For some investigators, the accumulated evidence concerning the obesity-mortality link reveals that stated public health concerns have been overhyped—constituting more of a “moral panic” than a “public health crisis” (27).
Interestingly, however, assessment of the association between obesity and mortality is not as straightforward as it might seem, especially with the kinds of data that have been deployed to address the question. In the data sources typically used, answering the question of interest requires careful control for year of birth (cohort) and age at interview in order to precisely estimate the obesity-mortality association by age. To our knowledge, no study carried out to date has implemented these controls in a large, nationally representative data set, thereby leaving the exact nature of the obesity-mortality association potentially biased and the implications for public health obscure. We aimed to address these important potential biases and to determine whether and to what extent the obesity-mortality association is altered when these biases are taken into account, and whether we need to rethink the public health importance of increasing obesity in the US population.
There are compelling reasons to believe that age-specific estimates of the obesity-mortality relationship may be affected by respondents' ages at the time of survey and/or by respondents' birth cohorts. For instance, “healthy participant effects” are common in survey data, especially pertaining to health-related outcomes such as mortality (28). We might expect confounding from survey selection to be quite strong when estimating age-varying outcomes, especially in data obtained from samples that exclude institutionalized populations. That is, surveys' exclusion criteria are strongly associated with respondents' ages and health status, and thus survey selection especially biases estimates of age-specific health outcomes. In addition, exclusion criteria are probably even more pronounced in the US obese population. For instance, noninstitutionalized obese older persons who are healthy enough to participate fully in the National Health Interview Survey (NHIS) are likely to constitute a substantially healthier population than the older institutionalized obese population. We hypothesize that the effect of confounding by institutionalization and differential frailty on age-specific mortality risk is relatively greater in the obese population than in the normal-weight population, and thus survey selection bias will be stronger for obese respondents in the NHIS than for normal-weight respondents.
Regarding the importance of cohort confounding, recent research has shown temporal reductions in US adult mortality rates to be overwhelmingly related to cohort, not period, phenomena (29–32). Additionally, because age and cohort are highly collinear, the estimated age patterns of hazards observed in survey data may be partly due to differences between cohorts' mortality risks. Thus, analyses of age patterns of mortality risk using survey data such as NHIS data must account for disparate cohort variation in mortality risk, especially when exploring age variation in mortality.
In the current study, we fitted 3 nested Cox survival models that revealed the importance of healthy participant bias and cohort membership for investigation of age patterns in the association between obesity and US adult mortality risk. Evidence suggests that accounting for variation in 5-year birth cohorts, as well as obesity differences in age-related selection bias, significantly improves the fit of models of obesity differences in US survival across 10-year age groups. Further, contrary to existing results, findings from models that address confounding reveal that the association between obesity and mortality risk strengthens with age.
MATERIALS AND METHODS
Study population
Data from 19 continual waves of the NHIS (1986–2004) were linked to death records in the National Death Index using a 14-point identification scheme (33). The resulting National Health Interview Survey Linked Mortality Files (NHIS-LMF) provided annual data on individual-level mortality status for eligible respondents between the survey date and December 31, 2006. The unique structure of the NHIS-LMF 1986–2006 data set combines continuous cross-sectional waves of nationally representative data with individual-level longitudinal information on mortality status for up to 21 years. Because of this, the data provide sufficiently numerous instances of multiple age-at-survey, attained-age, and cohort combinations to model stable estimates for all 3 time dimensions. NHIS data that had been concatenated and normalized by the Minnesota Population Center (University of Minnesota, Minneapolis, Minnesota) and made available for public use as the Integrated Health Interview Series were combined with NHIS data obtained directly from the National Center for Health Statistics using survey year and respondents' personal identification numbers (33, 34).
The final sample was composed of 373,185 US adult men and 416,908 US adult women aged 25–84.9 years at the time of survey, with 64,443 deaths and 58,937 deaths occurring between attained ages 25.3 years and 99.9 years in the male and female samples, respectively (see Table 1). Accounting for the clustered sampling design of the NHIS and using proportional weights makes the results representative of the mortality risk of the US noninstitutionalized population aged 25–84 years between the years 1986 and 2006 (35).
Table 1.
Characteristics of the Study Sample, by Sex, United States, 1986–2004a
| Women's Sample |
Men's Sample |
|||||||
|---|---|---|---|---|---|---|---|---|
| No. | % (SD) | Mean (SD) | Range | No. | % (SD) | Mean (SD) | Range | |
| Age at survey, years | 48.46 (15.87) | 25.0–84.9 | 47.31 (15.09) | 25.0–84.9 | ||||
| Age at exit, years | 60.90 (15.16) | 25.0–99.9 | 59.62 (14.18) | 25.0–99.9 | ||||
| Birth year | 1944.64 (16.20) | 1901–1974 | 1945.61 (15.49) | 1901–1974 | ||||
| Survey year | 1993.11 (4.85) | 1986–2004 | 1992.92 (4.75) | 1986–2004 | ||||
| Education | ||||||||
| Less than high school | 83,123 | 19.94 (39.95) | 72,368 | 19.39 (39.54) | ||||
| High school graduation or equivalent | 159,440 | 38.24 (48.60) | 127,383 | 34.13 (47.42) | ||||
| Some college | 91,523 | 21.95 (41.39) | 77,165 | 20.68 (40.50) | ||||
| Bachelor's degree or higher | 82,822 | 19.87 (39.90) | 96,269 | 25.80 (43.75) | ||||
| Annual family-level income | ||||||||
| Less than federal poverty line | 64,317 | 15.43 (36.12) | 38,037 | 10.19 (30.26) | ||||
| Between federal poverty line and $45,000 | 218,175 | 52.33 (49.95) | 194,219 | 52.04 (49.96) | ||||
| ≥$45,000 | 134,416 | 32.24 (46.74) | 140,929 | 37.76 (49.48) | ||||
| Marital status | ||||||||
| Married | 260,505 | 62.49 (48.42) | 274,790 | 73.63 (44.06) | ||||
| Divorced/separated | 60,300 | 14.46 (35.17) | 37,245 | 9.98 (29.97) | ||||
| Widowed | 50,425 | 12.09 (32.61) | 10,870 | 2.91 (16.82) | ||||
| Never married | 45,678 | 10.96 (31.23) | 50,280 | 13.47 (34.14) | ||||
| Race/ethnicity | ||||||||
| Hispanic | 40,496 | 9.71 (29.61) | 34,618 | 9.28 (29.01) | ||||
| Non-Hispanic white | 306,072 | 73.41 (44.18) | 286,628 | 76.81 (42.21) | ||||
| Non-Hispanic black | 56,984 | 13.67 (34.35) | 39,645 | 10.62 (30.81) | ||||
| Non-Hispanic other | 13,356 | 3.20 (17.61) | 12,294 | 3.29 (17.85) | ||||
| Region of residence | ||||||||
| Northeast | 87,178 | 20.91 (40.67) | 76,189 | 20.42 (40.31) | ||||
| Midwest | 100,944 | 24.21 (42.84) | 92,396 | 24.76 (43.16) | ||||
| South | 141,788 | 34.01 (47.37) | 124,118 | 33.26 (47.11) | ||||
| West | 86,998 | 20.87 (40.64) | 80,482 | 21.57 (41.13) | ||||
| Obesity statusb | ||||||||
| BMIc 18.5–29.9 | 339,674 | 81.48 (38.85) | 310,480 | 83.20 (37.39) | ||||
| Grade 1 obesity | 51,739 | 12.41 (32.97) | 48,901 | 13.10 (33.74) | ||||
| Grade 2 obesity | 17,539 | 4.21 (20.07) | 10,968 | 2.94 (16.89) | ||||
| Grade 3 obesity | 7,956 | 1.91 (13.68) | 2,836 | 0.76 (8.70) | ||||
| Deceased | 58,937 | 14.14 (34.84) | 64,443 | 17.27 (37.80) | ||||
| Total | 373,185 | 416,908 | ||||||
Abbreviations: BMI, body mass index; SD, standard deviation.
a Data were obtained from the National Health Interview Survey Linked Mortality Files.
b Grade 1 obesity, BMI 30.0–34.9; grade 2 obesity, BMI 35.0–39.9; grade 3 obesity, BMI ≥40.0.
c Weight (kg)/height (m)2.
Time metric for survival analysis
Respondents' individual-level survival through December 31, 2006, was estimated using Cox regression models. Age at the time of censoring or death (i.e., attained age) was used as the time metric and was calculated using a number of measures. First, respondents' birth months and years were obtained at the time of survey and were used to create a variable for quarter-year of birth. These were combined with year and quarter-year of survey to calculate age at survey. Quarter-years of exposure were calculated based on quarter-year of survey and either quarter-year of death or time of censoring at December 31, 2006. These quarter-years of exposure were then added to age at survey to estimate respondents' attained age. In the male sample, 2,111 unique attained ages between 25.333 years and 99.917 years were recorded, and in the female sample there were 2,053 attained ages across the respective age range. Survey adjustment methods available in Stata 12 (StataCorp LP, College Station, Texas) were used to adjust for the clustered sampling design of the NHIS, and proportional weights were used to make the results representative of the mortality experience of the US noninstitutionalized population aged 25–84 years between the years 1986 and 2006.
Independent variables
Survival of the normal-weight/overweight population—measured as having a BMI between 18.5 and 29.9 at the time of survey—was compared with the survival times of populations with 3 grades of obesity: grade 1 obese (BMI 30.0–34.9), grade 2 obese (BMI 35.0–39.9), and grade 3 obese (BMI ≥40.0). Respondents with an estimated BMI less than 18.5 were dropped from the sample because an “underweight” BMI is strongly associated with preexisting illnesses and increased mortality risk (respondents with an “underweight” BMI accounted for 0.73% of the male sample and 3.44% of the female sample). Respondents' BMI was calculated by the National Center for Health Statistics from self-reported height and weight, measured without shoes. Some research has shown that BMI estimates calculated from respondents' self-reported height and weight do not differ substantively from clinical measurements (19). However, other research has shown that self-reported weight in the NHIS is biased by proxy reports and general underreporting of weight (36, 37). Results from sensitivity analyses accounting for biases are consistent with those currently presented and discussed, and these additional results are available upon request.
Analyses were stratified by sex, and the final models controlled for national region of residence, race/ethnicity, educational attainment, annual family-level income, marital status, age at survey, and birth cohort. Region of residence was measured as living in the Northeast, the Midwest, the South, or the West at the time of survey, and race/ethnicity was categorized by respondents' self-report as Hispanic, non-Hispanic white, non-Hispanic black, or non-Hispanic other. Marital status was measured using the categories married, widowed, divorced/separated, and never married, and cohort membership was accounted for using 5-year groupings ranging from 1900–1904 to 1970–1974. Because of sparse data in the 1975–1979 birth cohort, respondents born after 1974 were dropped from all analyses (6 deaths occurred in the male sample among respondents born after 1974, and only 5 occurred in the respective female sample). Educational attainment was categorized as less than 12 years of schooling, high school graduation or the equivalent, some college, and bachelor's degree or higher, and family-level income was categorized as earning less than the federal poverty line, greater than the federal poverty line but less than $45,000, or $45,000 or more.
To control for health behaviors for which data were not available for many of the study participants, we performed analyses on a subsample of the NHIS-LMF for waves 1997–2003, in which measurement of such variables was accomplished. Specifically, respondents' alcohol consumption (heavy, moderate, or none), smoking status (current smoker, former smoker, or never smoker), and frequency of exercise (heavy, moderate, or none) were additionally included in the models. Estimates of age patterns in the association between obesity and mortality risk using these data were consistent with those found in the larger data set. Because of this, only results from the full NHIS-LMF 1986–2006 data set are presented and discussed. Table 1 presents descriptive statistics for all model covariates in the NHIS-LMF 1986–2006, stratified by sex.
Statistical analyses
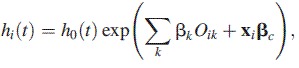
To explore how alternative specifications of survival times affect estimates of the obesity-mortality association, we fitted 3 survival models, stratified by sex. Model 1 was a Cox proportional hazards model:
 |
(1) |
where the hazard function for the ith individual, hi(t), is conditional on covariates xi and obesity class (Ok) and where βk are the coefficients pertaining to the kth obesity class (k = 1,…, 3) and βc is the vector of coefficients pertaining to x.
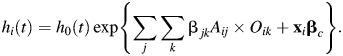
Model 2 was a Cox model with grouped age-dependency of obesity:
 |
(2) |
Here the hazard function for the ith individual is conditional on covariates xi and the age × obesity interactions. βjk corresponds to the 21 possible combinations of the seven 10-year age groups Aj (j 25–34.9, …, ≥85) and the 3 obesity classes Ok (k = 1, …, 3), and βc denotes the estimates of the remaining covariates (x).
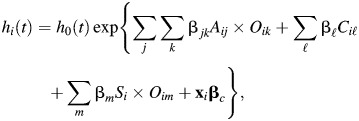
Model 3 was a Cox model with grouped age-dependency of obesity, controlling for age at survey and cohort:
 |
(3) |
where βjk is the vector of coefficients corresponding to the 21 interactions of age group and obesity class as specified in model 2, βl are the estimated coefficients of the fourteen 5-year birth cohorts (Cl, l = 1905–1909, …, 1970–1974), βm are interactions between the centered linear age-at-survey term (S) (ranging from 25 years to 84.9 years and centered on mean values) and the obesity classes Om (m = 1, …, 3), and  corresponds to the coefficients of the remaining covariates (x).
The time metric in all survival models was attained age, and left-truncation was accounted for by starting respondents' exposure at their age at survey. The first two models are most often employed by researchers to investigate the association between obesity and adult mortality risk. Model 1 assumes that the association between obesity status and mortality risk is proportional across the age range, while model 2 assumes that the association is conditional on one's age group. However, neither model accounts for variation in mortality risk by age at survey (i.e., age-related survey selection bias) or cohort membership. We estimate model 3, which extends model 2 to account for mortality variation in birth cohorts and obesity variation in the association between age at survey and mortality risk. The functional form of the relationship between age at survey and mortality risk is quadratic, so we include both centered age at survey and centered age at survey squared.
We fitted several models to explore age variation in the relationship between obesity status and individual mortality hazards. For instance, we stratified model 1 by obesity status and obtained obesity-specific smoothed baseline hazards (see Web Figure 1, available at http://aje.oxfordjournals.org/). We then compared the grade 1, grade 2, and grade 3 baseline hazards with the normal-weight/overweight baseline hazards to estimate obesity hazard ratios across the age range. Because these hazard ratios were found to increase with age, we proceeded to fit model 3. Furthermore, we conducted several sensitivity analyses by limiting age at survey to single-year and 3-year age bands and refitted model 2. That is, we explored age variation in the relationship between obesity status and mortality at select ranges of age at survey. For example, model 2 was fitted only for US men and women who were aged 55–57, 60–62, 65–67, and 75–77 years, to guard against extrapolating the linear estimates of age at survey in model 3. Estimates showed that variation in the association with obesity status in men's and women's mortality hazards increased with age for each specific subsample. Therefore, we were confident that we were not forcing or extrapolating the estimate of age at survey in model 3. (All analyses and results are available upon request.)
RESULTS
Hazard ratios for US male mortality between the normal-/overweight population and the grade 1 obese, grade 2 obese, and grade 3 obese populations, respectively, are presented in Table 2. Table 3 presents respective hazard ratios for US adult women.
Table 2.
Estimated Hazard Ratios from Cox Survival Models Examining the Associations Between Obesity, Age, and Mortality in Adult Men, United States, 1986–2006a
| Model 1b (n = 373,185) |
Model 2 (n = 822,602) |
Model 3 (n = 822,602) |
||||
|---|---|---|---|---|---|---|
| HR | 95% CI | HR | 95% CI | HR | 95% CI | |
| Obesity statusc (referent, BMId 18.5–29.9) | ||||||
| Grade 1 obesity | 1.11 | 1.09, 1.14 | ||||
| Grade 2 obesity | 1.42 | 1.36, 1.49 | ||||
| Grade 3 obesity | 2.14 | 1.97, 2.33 | ||||
| Obesity status by age group, years | ||||||
| Grade 1 obesity | ||||||
| 25–34 | 1.06 | 0.80, 1.40 | 0.82 | 1.64, 1.10 | ||
| 35–44 | 1.26 | 1.12, 1.41 | 1.04 | 1.09, 1.17 | ||
| 45–54 | 1.18 | 1.09, 1.28 | 1.10 | 1.02, 1.19 | ||
| 55–64 | 1.15 | 1.09, 1.21 | 1.25 | 1.18, 1.33 | ||
| 65–74 | 1.10 | 1.05, 1.15 | 1.39 | 1.29, 1.51 | ||
| 75–84 | 1.12 | 1.07, 1.17 | 1.59 | 1.42, 1.78 | ||
| ≥85 | 0.98 | 0.90, 1.07 | 1.53 | 1.33, 1.76 | ||
| Grade 2 obesity | ||||||
| 25–34 | 2.08 | 1.39, 3.71 | 1.51 | 1.00, 2.28 | ||
| 35–44 | 1.90 | 1.59, 2.28 | 1.51 | 1.22, 1.87 | ||
| 45–54 | 1.67 | 1.48, 1.89 | 1.54 | 1.36, 1.75 | ||
| 55–64 | 1.49 | 1.35, 1.64 | 1.66 | 1.48, 1.85 | ||
| 65–74 | 1.36 | 1.25, 1.48 | 1.81 | 1.57, 2.10 | ||
| 75–84 | 1.30 | 1.19, 1.43 | 2.02 | 1.66, 2.46 | ||
| ≥85 | 1.09 | 0.89, 1.32 | 1.87 | 1.39, 2.53 | ||
| Grade 3 obesity | ||||||
| 25–34 | 3.72 | 2.08, 6.66 | 2.20 | 1.15, 4.18 | ||
| 35–44 | 3.17 | 2.45, 4.09 | 2.17 | 1.57, 2.99 | ||
| 45–54 | 2.53 | 2.13, 3.01 | 2.20 | 1.82, 2.67 | ||
| 55–64 | 2.52 | 2.16, 2.95 | 2.90 | 2.46, 3.42 | ||
| 65–74 | 1.69 | 1.41, 2.02 | 2.62 | 2.04, 3.37 | ||
| 75–84 | 1.69 | 1.37, 2.08 | 3.26 | 2.25, 4.73 | ||
| ≥85 | 1.45 | 0.80, 2.64 | 3.68 | 1.68, 8.10 | ||
| Age at surveye | 1.01 | 1.00, 1.01 | ||||
| Age at survey squared | 1.00 | 1.00, 1.00 | ||||
| Grade 1 obesity × age at survey | 0.99 | 0.98, 0.99 | ||||
| Grade 2 obesity × age at survey | 0.98 | 0.97, 0.99 | ||||
| Grade 3 obesity × age at survey | 0.97 | 0.96, 0.99 | ||||
| Birth cohort (referent, 1900–1904) | ||||||
| 1905–1909 | 1.01 | 0.91, 1.11 | ||||
| 1910–1914 | 1.00 | 0.91, 1.10 | ||||
| 1915–1919 | 0.98 | 0.89, 1.08 | ||||
| 1920–1924 | 0.92 | 0.83, 1.02 | ||||
| 1925–1929 | 0.87 | 0.77, 0.96 | ||||
| 1930–1934 | 0.81 | 0.72, 0.90 | ||||
| 1935–1939 | 0.73 | 0.65, 0.83 | ||||
| 1940–1944 | 0.69 | 0.60, 0.78 | ||||
| 1945–1949 | 0.67 | 0.58, 0.77 | ||||
| 1950–1954 | 0.68 | 0.59, 0.79 | ||||
| 1955–1959 | 0.66 | 0.56, 0.77 | ||||
| 1960–1964 | 0.58 | 0.48, 0.70 | ||||
| 1965–1969 | 0.51 | 0.41, 0.65 | ||||
| 1970–1974 | 0.50 | 0.35, 0.70 | ||||
Abbreviations: BMI, body mass index; CI, confidence interval; HR, hazard ratio.
a Data were obtained from the National Health Interview Survey Linked Mortality Files.
b All models adjusted for educational attainment, income, marital status, region of residence, and race/ethnicity.
c Grade 1 obesity, BMI 30.0–34.9; grade 2 obesity, BMI 35.0–39.9; grade 3 obesity, BMI ≥40.0.
d Weight (kg)/height (m)2.
e Age at survey was centered on the mean value of 47.31 years.
Table 3.
Estimated Hazard Ratios from Cox Survival Models Examining the Associations Between Obesity, Age, and Mortality in Adult Women, United States, 1986–2006a
| Model 1b (n = 416,908) |
Model 2 (n = 924,041) |
Model 3 (n = 924,041) |
||||
|---|---|---|---|---|---|---|
| HR | 95% CI | HR | 95% CI | HR | 95% CI | |
| Obesity statusc (referent, BMId 18.5–29.9) | ||||||
| Grade 1 obesity | 1.11 | 1.08, 1.14 | ||||
| Grade 2 obesity | 1.37 | 1.32, 1.43 | ||||
| Grade 3 obesity | 1.90 | 1.80, 2.00 | ||||
| Obesity status by age group, years | ||||||
| Grade 1 obesity | ||||||
| 25–34 | 1.10 | 0.76, 1.58 | 0.73 | 0.51, 1.07 | ||
| 35–44 | 1.28 | 1.11, 1.49 | 0.97 | 0.82, 1.14 | ||
| 45–54 | 1.29 | 1.17, 1.42 | 1.15 | 1.05, 1.27 | ||
| 55–64 | 1.27 | 1.19, 1.35 | 1.39 | 1.30, 1.49 | ||
| 65–74 | 1.14 | 1.09, 1.20 | 1.54 | 1.43, 1.65 | ||
| 75–84 | 1.08 | 1.04, 1.13 | 1.72 | 1.56, 1.91 | ||
| ≥85 | 0.99 | 0.95, 1.04 | 1.79 | 1.58, 2.04 | ||
| Grade 2 obesity | ||||||
| 25–34 | 1.35 | 0.76, 2.39 | 0.94 | 0.53, 1.69 | ||
| 35–44 | 1.38 | 1.09, 1.75 | 1.07 | 0.82, 1.41 | ||
| 45–54 | 1.54 | 1.36, 1.73 | 1.39 | 1.23, 1.58 | ||
| 55–64 | 1.54 | 1.38, 1.72 | 1.67 | 1.49, 1.88 | ||
| 65–74 | 1.45 | 1.35, 1.57 | 1.89 | 1.65, 2.17 | ||
| 75–84 | 1.35 | 1.26, 1.44 | 2.02 | 1.69, 2.43 | ||
| ≥85 | 1.12 | 1.01, 1.25 | 1.87 | 1.48, 2.35 | ||
| Grade 3 obesity | ||||||
| 25–34 | 2.29 | 1.20, 4.38 | 1.41 | 0.72, 2.78 | ||
| 35–44 | 2.64 | 2.11, 3.29 | 1.87 | 1.43, 2.44 | ||
| 45–54 | 2.13 | 1.85, 2.45 | 1.85 | 1.59, 2.14 | ||
| 55–64 | 2.32 | 2.08, 2.60 | 2.55 | 2.28, 2.87 | ||
| 65–74 | 2.00 | 1.81, 2.21 | 2.78 | 2.37, 3.25 | ||
| 75–84 | 1.60 | 1.42, 1.80 | 2.72 | 2.06, 3.49 | ||
| ≥85 | 1.31 | 1.10, 1.55 | 2.58 | 1.88, 3.53 | ||
| Age at surveye | 1.00 | 0.99, 1.00 | ||||
| Age at survey squared | 1.00 | 1.00, 1.00 | ||||
| Grade 1 obesity × age at survey | 0.98 | 0.98, 0.98 | ||||
| Grade 2 obesity × age at survey | 0.98 | 0.98, 0.99 | ||||
| Grade 3 obesity × age at survey | 0.98 | 0.97, 0.99 | ||||
| Birth cohort (referent, 1900–1904) | ||||||
| 1905–1909 | 0.85 | 0.79, 0.92 | ||||
| 1910–1914 | 0.86 | 0.79, 0.92 | ||||
| 1915–1919 | 0.85 | 0.79, 0.92 | ||||
| 1920–1924 | 0.85 | 0.78, 0.93 | ||||
| 1925–1929 | 0.83 | 0.76, 0.91 | ||||
| 1930–1934 | 0.78 | 0.71, 0.87 | ||||
| 1935–1939 | 0.75 | 0.68, 0.84 | ||||
| 1940–1944 | 0.70 | 0.62, 0.79 | ||||
| 1945–1949 | 0.65 | 0.57, 0.75 | ||||
| 1950–1954 | 0.65 | 0.56, 0.76 | ||||
| 1955–1959 | 0.66 | 0.56, 0.79 | ||||
| 1960–1964 | 0.64 | 0.52, 0.78 | ||||
| 1965–1969 | 0.63 | 0.49, 0.82 | ||||
| 1970–1974 | 0.72 | 0.49, 1.07 | ||||
Abbreviations: BMI, body mass index; CI, confidence interval; HR, hazard ratio.
a Data were obtained from the National Health Interview Survey Linked Mortality Files.
b All models adjusted for educational attainment, income, marital status, region of residence, and race/ethnicity.
c Grade 1 obesity, BMI 30.0–34.9; grade 2 obesity, BMI 35.0–39.9; grade 3 obesity, BMI ≥40.0.
d Weight (kg)/height (m)2.
e Age at survey was centered on the mean value of 48.46 years.
Results from model 1 that do not address confounding by healthy participant bias or cohort memberships are consistent with findings from many existing studies on the obesity-mortality association. For US men and women, grade 2 obesity and grade 3 obesity significantly and substantively increase the mortality hazard, as does grade 1 obesity, but the substantive association with mortality is relatively smaller than the association for grade 2 or grade 3 obesity. Results from model 2, which estimates age variation in the association between obesity and US adult mortality risk but does not account for confounding by healthy participant bias or cohort membership, are also consistent with previous findings. Estimates from model 2 suggest that the strength of the association between obesity status and individual hazards significantly diminishes with age in both the male and female populations. These patterns are most clearly shown in Figure 1, which plots fitted hazard ratios from models 1 and 2 by age for both the male and female samples.
Figure 1.

Estimated mortality hazard ratios from models 1 (proportional) and 2 (grouped age coefficients) for obese persons (body mass index (BMI; weight (kg)/height (m)2) ≥30.0) versus normal-weight and overweight persons (BMI 18.5–29.9) in the United States, by sex, 1986–2006. Data were obtained from the National Health Interview Survey Linked Mortality Files. Models 1 and 2 were adjusted for educational attainment, income, marital status, and region of residence. The estimated proportional hazard ratio from model 1 is indicated by a gray line; the estimated age-specific hazard ratio from model 2 is indicated by black bars. Men's results are shown in column 1, women's results in column 2. Grade 1 obesity (BMI 30.0–34.9) is shown in row 1, grade 2 obesity (BMI 35.0–39.9) in row 2, and grade 3 obesity (BMI ≥40.0) in row 3.
Results from model 3, however, provide evidence that the diminishing age-obesity associations in model 2 result from the confounding influences of age at survey and birth cohort. Indeed, model 3 in Table 2 shows that age at survey and birth cohort are both significantly associated with US men's mortality hazard, and also that the association between age at survey and mortality risk varies significantly by obesity status. Results from model 3 in Table 3 indicate that this is also the case for US women's mortality hazards. Consistent with previous research, significant and substantive cohort reductions in US adult mortality risk are found in both men and women (29–32, 38). In addition, consistent with our hypothesis, mortality differences by age at survey are significantly conditioned by obesity status. Increases in age at survey are associated with smaller mortality hazards at older ages, and the substantive strength of these hazards increases with greater obesity.
These findings support the contention that survey selection bias is stronger in the obese populations than in the normal-weight population, and not accounting for this disparate survey selection biases estimates of obesity differences in age-specific mortality risk. Indeed, after controlling for disparate cohort mortality and the interaction between obesity status and age at survey, the associations between grade 1, grade 2, and grade 3 obesity and adult mortality risk grow substantively stronger with age. This is most clearly shown in Figure 2, which plots fitted hazard ratios between the grade 1 obese, grade 2 obese, and grade 3 obese populations and the normal-/overweight population, respectively, from model 3. Results for US men are graphed on the left-hand side, and results for women are graphed on the right-hand side. Furthermore, fitted smoothed hazards from obesity-stratified model 3 are plotted in Web Figure 1, and Web Figure 2 shows absolute differences in BMI hazards. Findings show significant and substantively large absolute differences in mortality by obesity status, which grow significantly wider across the age range.
Figure 2.

Estimated mortality hazard ratios from model 3 for obese persons (body mass index (BMI; weight (kg)/height (m)2) ≥30.0) versus normal-weight and overweight persons (BMI 18.5–29.9) in the United States, by sex, 1986–2006. Data were obtained from the National Health Interview Survey Linked Mortality Files. Model 3 was adjusted for educational attainment, income, marital status, region of residence, birth cohort, age at survey, and the 2-way interaction between obesity status and age at survey. The estimated age-specific hazard ratio is indicated by black bars, and 95% confidence intervals are indicated by dashed lines. Men's results are shown in column 1, women's results in column 2. Grade 1 obesity (BMI 30.0–34.9) is shown in row 1, grade 2 obesity (BMI 35.0–39.9) in row 2, and grade 3 obesity (BMI ≥40.0) in row 3.
Once cohort variation in mortality and the 2-way interactions between obesity and age at survey are accounted for, the association between obesity status and mortality risk grows significantly stronger with age. Moreover, the association grows both relatively and absolutely larger across the age range, revealing substantively large and meaningful differences in mortality risk between the obese and normal-/overweight populations across the adult life course.
DISCUSSION
Selecting an appropriate time metric has been shown to be an important factor in accurately fitting survival models (39–42). Attained age has been demonstrated to be a more meaningful survival metric than calendar time, especially when the outcome of interest pertains to health or mortality. Much less attention, however, has been paid to the broader question of temporal dimensions of covariates' associations with the outcome of interest. Yet both age at survey and cohort membership are confounded with attained age, and not controlling for these temporal dimensions may bias estimates of covariates' age-varying associations with health outcomes. Regarding the US obesity-mortality relationship, we find evidence that the association between obesity and individual mortality risk varies significantly with both age at survey and attained age, and also that cohort variation in mortality risk significantly confounds estimates of age-specific mortality hazards. Consequently, researchers must be mindful of these multiple time dimensions and rethink the association between obesity, age, and mortality risk across the life course. Heretofore, however, research has not accounted for these confounders, and as a result, the bulk of existing public health literature has suggested that the association between obesity status and mortality risk either is age-invariable or substantially weakens with increasing age. Consequently, the public health threat of the US obesity epidemic has been criticized by many researchers. However, our results show that existing findings stem from survival models that incorrectly estimate the obesity-mortality relationship in the United States. Indeed, after accounting for age-related survey selection bias and cohort differences in mortality risk, the associations between grade 1, grade 2, and grade 3 obesity and US men's and women's adult mortality risk grow substantively stronger with age.
These findings have profound implications for future research, health policy, and health-care services in the United States. The health of the US population is increasingly being shaped by forces associated with both an aging population and rising obesity prevalence (43–47). Some research has downplayed the significance of these 2 factors' relationship because the health and survival consequences of obesity have been found to be smaller, nonexistent, or even reversed at older ages. However, our results caution against framing the obesity epidemic as a “moral panic” in which the harm administered stems more from ill-advised hyperbole than from the real-life consequences of obesity per se (27). In light of our findings, we are, on the contrary, much more concerned about inappropriate denial of the epidemic's consequences for US mortality. Our results suggest that major public health consequences will track with the epidemic and that efforts to stem its growth are probably well worth the investment.
ACKNOWLEDGMENTS
Author affiliations: Robert Wood Johnson Foundation Health and Society Scholars Program, Columbia University, New York, New York (Ryan K. Masters); Department of Sociology, College of Liberal Arts, University of Texas at Austin, Austin, Texas (Daniel A. Powers); and Departments of Epidemiology and Sociomedical Sciences, Mailman School of Public Health, Columbia University, New York, New York (Bruce G. Link).
We thank the Robert Wood Johnson Foundation Health and Society Scholars Program for its financial support. We also thank Drs. Robert A. Hummer, Peter S. Bearman, and Julien O. Teitler and participants in the Robert Wood Johnson Foundation Health and Society Scholars Program at Columbia University for their helpful advice.
Conflicts of interest: none declared.
REFERENCES
- 1.Wang Y, Beydoun MA. The obesity epidemic in the United States—gender, age, socioeconomic, racial/ethnic, and geographic characteristics: a systematic review and meta-regression analysis. Epidemiol Rev. 2007;29(1):6–28. doi: 10.1093/epirev/mxm007. [DOI] [PubMed] [Google Scholar]
- 2.Berrington de Gonzalez A, Sweetland S, Spencer E. A meta-analysis of obesity and the risk of pancreatic cancer. Br J Cancer. 2010;89(3):519–523. doi: 10.1038/sj.bjc.6601140. [DOI] [PMC free article] [PubMed] [Google Scholar]
- 3.Calle EE, Kaaks R. Overweight, obesity and cancer: epidemiological evidence and proposed mechanisms. Nat Rev Cancer. 2004;4(8):579–591. doi: 10.1038/nrc1408. [DOI] [PubMed] [Google Scholar]
- 4.Carmichael AR. Obesity as a risk factor for development and poor prognosis of breast cancer. BJOG. 2006;113(10):1160–1166. doi: 10.1111/j.1471-0528.2006.01021.x. [DOI] [PubMed] [Google Scholar]
- 5.Carroll KK. Obesity as a risk factor for certain types of cancer. Lipids. 1998;33(11):1055–1059. doi: 10.1007/s11745-998-0305-8. [DOI] [PubMed] [Google Scholar]
- 6.Chow W, Gridley G, Fraumeni JF, et al. Obesity, hypertension, and the risk of kidney cancer in men. N Engl J Med. 2000;343(18):1305–1311. doi: 10.1056/NEJM200011023431804. [DOI] [PubMed] [Google Scholar]
- 7.Field AE, Coakley EH, Must A, et al. Impact of overweight on the risk of developing common chronic diseases during a 10-year period. Arch Intern Med. 2001;161(13):1581–1586. doi: 10.1001/archinte.161.13.1581. [DOI] [PubMed] [Google Scholar]
- 8.Frezza EE, Wachtel MS, Chiviva-Internati M. Influence of obesity on the risk of developing colon cancer. Gut. 2006;55(2):285–291. doi: 10.1136/gut.2005.073163. [DOI] [PMC free article] [PubMed] [Google Scholar]
- 9.Giovannucci E, Ascherio A, Rimm EB, et al. Physical activity, obesity, and risk for colon cancer and adenoma in men. Ann Intern Med. 1995;122(5):327–334. doi: 10.7326/0003-4819-122-5-199503010-00002. [DOI] [PubMed] [Google Scholar]
- 10.Larsson SC, Permert J, Håkansson N, et al. Overall obesity, abdominal adiposity, diabetes and cigarette smoking in relation to the risk of pancreatic cancer in two Swedish population-based cohorts. Br J Cancer. 2005;93(11):1310–1315. doi: 10.1038/sj.bjc.6602868. [DOI] [PMC free article] [PubMed] [Google Scholar]
- 11.Michaud DS, Giovannucci E, Willett WC, et al. Physical activity, obesity, height, and the risk of pancreatic cancer. JAMA. 2001;286(8):921–929. doi: 10.1001/jama.286.8.921. [DOI] [PubMed] [Google Scholar]
- 12.Murphy TK, Calle EE, Rodriguez C, et al. Body mass index and colon cancer mortality in a large prospective study. Am J Epidemiol. 2000;152(9):847–854. doi: 10.1093/aje/152.9.847. [DOI] [PubMed] [Google Scholar]
- 13.Must A, Spadano J, Coakley EH, et al. The disease burden associated with overweight and obesity. JAMA. 1999;282(16):1523–1529. doi: 10.1001/jama.282.16.1523. [DOI] [PubMed] [Google Scholar]
- 14.Okosun IS, Choi S, Matamoros T, et al. Obesity is associated with reduced self-rated general health status: evidence from a representative sample of white, black, and Hispanic Americans. Prev Med. 2001;32(5):429–436. doi: 10.1006/pmed.2001.0840. [DOI] [PubMed] [Google Scholar]
- 15.Pan SYl, Johnson KC, Ugnat AM, et al. Association of obesity and cancer risk in Canada. Am J Epidemiol. 2004;159(3):259–268. doi: 10.1093/aje/kwh041. [DOI] [PubMed] [Google Scholar]
- 16.Pi-Sunyer FX. The obesity epidemic: pathophysiology and consequences of obesity. Obes Res. 2002;10(2):97S–104S. doi: 10.1038/oby.2002.202. [DOI] [PubMed] [Google Scholar]
- 17.Rapp K, Schroeder J, Klenk J, et al. Obesity and incidence of cancer: a large cohort study of over 145,000 adults in Austria. Br J Cancer. 2005;93(9):1062–1067. doi: 10.1038/sj.bjc.6602819. [DOI] [PMC free article] [PubMed] [Google Scholar]
- 18.Manson JE, Bassuk SS, Hu FB, et al. Estimating the number of deaths due to obesity: can the divergent findings be reconciled? J Womens Health. 2006;16(2):168–176. doi: 10.1089/jwh.2006.0080. [DOI] [PubMed] [Google Scholar]
- 19.Mehta NK, Chang VW. Mortality attributable to obesity among middle-aged adults in the United States. Demography. 2009;46(4):851–872. doi: 10.1353/dem.0.0077. [DOI] [PMC free article] [PubMed] [Google Scholar]
- 20.Corrada MM, Kawas CH, Mozaffar F, et al. Association of body mass index and weight change with all-cause mortality in the elderly. Am J Epidemiol. 2006;163(10):938–949. doi: 10.1093/aje/kwj114. [DOI] [PMC free article] [PubMed] [Google Scholar]
- 21.Janssen I, Mark AE. Elevated body mass index and mortality risk in the elderly. Obes Rev. 2007;8(1):41–59. doi: 10.1111/j.1467-789X.2006.00248.x. [DOI] [PubMed] [Google Scholar]
- 22.Bender R, Jöckel KH, Trautner C, et al. Effect of age on excess mortality in obesity. JAMA. 1999;281(16):1498–1503. doi: 10.1001/jama.281.16.1498. [DOI] [PubMed] [Google Scholar]
- 23.Kuk JL, Arden CI. Influence of age on the association between various measures of obesity and all-cause mortality. J Am Geriatr Soc. 2009;57(11):2077–2084. doi: 10.1111/j.1532-5415.2009.02486.x. [DOI] [PubMed] [Google Scholar]
- 24.Stevens J, Cai J, Juhaeri, et al. Consequences of the use of different measures of effect to determine the impact of age on the association between obesity and mortality. Am J Epidemiol. 1999;150(4):399–407. doi: 10.1093/oxfordjournals.aje.a010019. [DOI] [PubMed] [Google Scholar]
- 25.Stevens JJ, Cai, Pamuk ER, et al. The effect of age on the association between body-mass index and mortality. N Engl J Med. 1998;338(1):1–7. doi: 10.1056/NEJM199801013380101. [DOI] [PubMed] [Google Scholar]
- 26.Harper S, King NB, Meersman SC, et al. Implicit value judgments in the measurement of health inequalities. Milbank Q. 2010;88(1):4–29. doi: 10.1111/j.1468-0009.2010.00587.x. [DOI] [PMC free article] [PubMed] [Google Scholar]
- 27.Campos P, Saguy A, Ernsberger P, et al. The epidemiology of overweight and obesity: public health crisis or moral panic? Int J Epidemiol. 2005;35(1):55–60. doi: 10.1093/ije/dyi254. [DOI] [PubMed] [Google Scholar]
- 28.Medes de Leon CF. Aging and the elapse of time: a comment on the analysis of change. J Gerontol. 2007;62B(3):S198–S202. doi: 10.1093/geronb/62.3.s198. [DOI] [PubMed] [Google Scholar]
- 29.Finch CE, Crimmins EM. Inflammatory exposure and historical changes in human life-spans. Science. 2004;305(5691):1736–1739. doi: 10.1126/science.1092556. [DOI] [PubMed] [Google Scholar]
- 30.Yang Y. Trends in U.S. adult chronic disease mortality, 1960–1999: age, period, and cohort variations. Demography. 2008;45(2):387–416. doi: 10.1353/dem.0.0000. [DOI] [PMC free article] [PubMed] [Google Scholar]
- 31.Masters RK. Uncrossing the U.S. black-white mortality crossover: the role of cohort forces in life course mortality risk. Demography. 2012;49(3):773–797. doi: 10.1007/s13524-012-0107-y. [DOI] [PMC free article] [PubMed] [Google Scholar]
- 32.Masters RK, Hummer RA, Powers DA. Educational differences in U.S. adult mortality: a cohort perspective. Am Sociol Rev. 2012;77(4):548–572. doi: 10.1177/0003122412451019. [DOI] [PMC free article] [PubMed] [Google Scholar]
- 33.National Center for Health Statistics. The National Health Interview Survey (1986–2004) Linked Mortality Files, Restricted-use File Layout. Hyattsville, MD: National Center for Health Statistics; 2006: http://www.cdc.gov/nchs/ (Accessed February 2010) [Google Scholar]
- 34.Minnesota Population Center and State Health Access Data Assistance Center. Integrated Health Interview Series: Version 4.0. Minneapolis, MN: University of Minnesota; 2011. [Google Scholar]
- 35.Office of Analysis and Epidemiology, National Center for Health Statistics. The National Health Interview Survey (1986–2004) Linked Mortality Files, Mortality Follow-Up Through 2006: Matching Methodology, May 2009. Hyattsville, MD:: National Center for Health Statistics; 2009. (http://www.cdc.gov/nchs/data/datalinkage/matching_methodology_nhis_final.pdf. (Accessed February 2010) [Google Scholar]
- 36.Reither EN, Utz RL. A procedure to correct proxy-reported weight in the National Health Interview Survey, 1976–2002. Popul Health Metr. 2009;7(2):1–10. doi: 10.1186/1478-7954-7-2. [DOI] [PMC free article] [PubMed] [Google Scholar]
- 37.Reither EN. Madison, WI: University of Wisconsin-Madison; 2005; Why are our waistlines expanding? Age-period-cohort analyses of the obesity epidemic and a critical examination of mass preparation theory. doctoral dissertation http://search.library.wisc.edu/catalog/ocm63683241) (Accessed November 2011. [Google Scholar]
- 38.Fogel RW. Changes in the disparities in chronic diseases during the course of the 20th century. Perspect Biol Med. 2005;48(1S):S150–S165. [PubMed] [Google Scholar]
- 39.Korn EL, Grabard BI, Midthune D. Time-to-event analysis of longitudinal follow-up survey: choice of the time-scale. Am J Epidemiol. 1997;145(1):72–80. doi: 10.1093/oxfordjournals.aje.a009034. [DOI] [PubMed] [Google Scholar]
- 40.Thiébaut ACM, Bénichou J. Choice of time-scale in Cox's model analysis of epidemiologic cohort data: a simulation study. Stat Med. 2004;23(24):3803–3820. doi: 10.1002/sim.2098. [DOI] [PubMed] [Google Scholar]
- 41.Verweij PJM, Houwelingen HC. Time-dependent effects of fixed covariates in Cox regression. Biometrics. 1995;51(4):1550–1556. [PubMed] [Google Scholar]
- 42.Singer JD, Willett JB. Applied Longitudinal Analysis: Modeling Change and Event Occurrence. New York, NY: Oxford University Press; 2003. [Google Scholar]
- 43.Olshansky SJ, Passaro DJ, Hershow RC, et al. A potential decline in life expectancy in the United States in the 21st century. N Engl J Med. 2005;352(11):1138–1145. doi: 10.1056/NEJMsr043743. [DOI] [PubMed] [Google Scholar]
- 44.Reither EN, Hauser RM, Yang Y. Do birth cohorts matter? Age-period-cohort analyses of the obesity epidemic in the United States. Soc Sci Med. 2009;69(10):1439–1448. doi: 10.1016/j.socscimed.2009.08.040. [DOI] [PMC free article] [PubMed] [Google Scholar]
- 45.Reither EN, Olshansky J, Yang Y. New forecasting methodology indicates more disease and earlier mortality ahead. Health Aff. 2011;30(8):1562–1568. doi: 10.1377/hlthaff.2011.0092. [DOI] [PMC free article] [PubMed] [Google Scholar]
- 46.Ogden CL, Carroll MD, Curtin LR, et al. Prevalence of overweight and obesity in the United States, 1999–2004. JAMA. 2006;295(13):1549–1555. doi: 10.1001/jama.295.13.1549. [DOI] [PubMed] [Google Scholar]
- 47.Flegal KM, Carroll MD, Ogden CL, et al. Prevalence and trends in obesity among U.S. adults, 1999–2008. JAMA. 2010;303(3):235–241. doi: 10.1001/jama.2009.2014. [DOI] [PubMed] [Google Scholar]