Abstract
Cancer has traditionally been studied from a basic science perspective, focusing on the underlying biology, physiology, and biochemistry. Engineering has supplemented this effort via the development of technology, e.g., microscopy. In recent times, engineering and the physical sciences have positioned themselves as approaches on par with the traditional basic sciences to tackle the study of cancer. Mathematical modeling and computational simulation have become key elements of this engineering-focused effort, evaluating the growth of tumors and their response to therapy as problems that could benefit from a systems analysis perspective. Building upon previous work in this field, here is developed a modeling framework to help evaluate the response of tumors to the combination of chemotherapy and immunotherapy, focusing on non-small cell lung cancer (NSCLC). With system parameters set with patient tumor-specific parameters, the longer term goal of this work is to advance personalized cancer treatment.
I. Introduction
The role of the immune system in cancer progression and response to treatment is increasingly recognized as critical to the success of therapy [1]. In particular, the innate immune system plays a large role in tumor detection and suppression [2], with macrophages being key cells that can migrate or are already resident in many organs of the body [3]. In lung cancer, which is the cause of most of the deaths from cancer worldwide, macrophages resident in the lung have both tumor-suppressive and tumor-promoting roles [4]. Polarization to the M1 phenotype enables release of cytotoxic nitric oxide (NO), while polarization to the M2 phenotype leads to release of growth factors and other cytokines conducive to tumor growth [5]. This macrophage polarization is fluid, with partial or full sharing of phenotypic characteristics occurring along the range of polarization based on the tumor microenvironment conditions. In this manner, tumors may drive the macrophage polarization to their benefit, thus thwarting the innate immune response [5].
Chemotherapy is the established treatment modality for advanced stage lung cancer. In contrast, immunotherapy for lung cancer is for the most part considered an experimental treatment, as the conditions that lead to treatment success or failure, including drug strength, are still poorly understood [6]. Consequently, the combination of chemotherapy and immunotherapy as a treatment option presents unique challenges due to the complexity of the interactions between drugs and their effects, immune system cells, tumor cells, and their microenvironment. A purely experimental approach has so far proven inadequate to elucidate these interactions.
Mathematical modeling enables abstracting complex system interactions in order to study them individually or in combination. When modeling biological phenomena, models have typically represented these phenomena as a continuum (e.g., tissues), as discrete elements (e.g., individual cells), or as a (hybrid) combination of both (e.g., individual cells within tissues), thus enabling the study of biology at different physical scales. Modeling has been applied to the study of tumor growth (e.g., [7]), cancer chemotherapy (e.g., [8]), and cancer immunotherapy (e.g., [9]). This paper presents a modeling framework to help study the combination of all three, focusing on NSCLC as a representative tumor system.
II. Methods
A. Tumor Growth
The tumor growth component builds upon recent work [10] and is based on [11]. A small nodule is initially simulated in a Cartesian grid of blood vessels representing a normally spaced capillary grid, with vessel parameters calibrated to deliver sufficient oxygen and nutrients to normal tissue [10]. The microenvironment has the following regions: normal (host) tissue, proliferating (tumor) tissue, hypoxic tissue with insufficient oxygen for proliferation, and necrotic tissue with insufficient oxygen for viability. Darcy’s law is applied to describe tumor growth with velocity vc [11]:
| (1) |
where μ is tissue mobility related to cell-cell and cell-matrix adhesion, P is oncotic pressure, χE is haptotaxis, and E is extracellular matrix density. Assuming uniform density in proliferating tissue, the change in velocity is [11]:
| (2) |
where λp is the (non-dimensionalized) tumor proliferation rate. Hypoxic tissue releases tumor angiogenic factors (TAF, e.g., vascular endothelial growth factor or VEGF), which diffuse into the surroundings, providing a chemotactic gradient for capillary growth and for macrophage migration.
B. Angiogenesis and Oxygen Transport
The angiogenesis component, adapted from [12], describes the growth and maturation of a tumor-induced neovascular network with blood flow. New vessels sprout and grow in response to gradients of TAF, and are influenced by pressure from the proliferating tissue. Oxygen σ is supplied from the vasculature and diffuses with coefficient Dσ into the surrounding tissue. Oxygen is taken up by host cells with rate λσ,host, by tumor cells with rate λσ,tumor in the proliferating and λσ,hypoxic in the hypoxic regions, and decays with rate λσ,necrotic in the necrotic tissue [11]:
| (3) |
where x is position in space, t is time, 1vessel indicates the vasculature location, p is tumor solid pressure, h is the hematocrit in the vasculature (following [11]), and λσ is the respective uptake rate. The extravasation λσ,ev is modulated by the extravascular interstitial pressure pi scaled by the effective pressure pe [11].
C. Macrophages
Monocytes and macrophages are simulated as discrete entities using a cellular automaton algorithm [13]. Monocytes extravasate from vessels in proportion to the local concentration of macrophage chemoattractants (e.g., TAF), and polarize into M1 or M2 phenotypes in proportion to the local concentration of cytokines released by proliferating and hypoxic tissue [13] as well as the immunotherapy drug strength and local concentration. Monocytes and macrophages migrate through the interstitium along gradients of oxygen, pressure, and chemoattractants. Movement in one of four directions along the computational grid is determined semi-stochastically, similar to their differentiation [13].
M1 cytotoxicity is simulated with death rate λNO in the immediate vicinity of the macrophage (1M1), since NO has a short half-life with limited diffusivity [13]:
| (4) |
M2 macrophages release growth factors F that positively affect proliferating tissue with rate λM2 [13]:
| (5) |
where λF is the effect of M2 growth factor on tumor tissue proliferation and λM is the tumor native proliferation rate.
Mass balance (steady-state conditions) for a particular cytokine concentration C (dimensionless units) produced by viable (proliferating or hypoxic) tumor tissue is [14]:
| (6) |
where DC is diffusivity and λC,prod, λC,circ and λC,decay are (non-dimensional, ranging from 0 to 1) cytokine production, wash-out into circulation, and decay rates, respectively.
D. Chemotherapy
Transport of drug s with strength λs,effect, here paclitaxel (PTX), a representative NSCLC drug, is simulated from the location of extravasation from the vasculature. Drug diffusivity is Ds. Uptake by tumor and normal cells and wash-out from the interstitial space are included as a combined effect in the rate λs,uptake, which reflects the drug half-life (assumed to be similar to the half-life in plasma) [15]:
| (7) |
Assuming a constant vascular extravasation transfer rate λs,TR, the drug extravasation is [16]:
| (8) |
where kp,i represents the weight of the convective transport component of small molecules. Drug concentration in the vasculature follows first order kinetics for a constant drug infusion: Cs,t = 1 - e−αt, with α based on an average half-life of 5.8 h for PTX for 6 to 24 h infusion [17]. Once the infusion is stopped, the concentration falls exponentially: Cs,t = e−αt.
E. Immunotherapy
Transport of a (generic) immunotherapeutic agent N affecting macrophage polarization is simulated from the location of extravasation from the vasculature following a single bolus administration:
| (9) |
where λN,ev is the vascular extravasation transfer rate and λN.decay is the decay rate. The agent locally stimulates M2 macrophages to polarize to an M1 phenotype, proportional to agent strength λN.effect and local agent concentration.
For all diffusion equations, zero Neumann conditions are assumed at the boundaries [11].
E. Macrophage and Drug Effects on Tumor Growth
Macrophage effects λM1 and λM2, and chemotherapy drug effect λs,effect, are included in the tumor proliferation rate λp:
| (10) |
Tissue degrades in the necrotic region with rate G, assuming that necrotic debris is constantly degraded and fluid is removed [11].
F. Parameter Values and Numerical Implementation
The main model parameters are in Table I (all other parameters are as in [10]). Cytokine characteristics follow previous work that evaluated protein diffusivity based on molecular weight [14]. Details of the numerical implementation are in [10] and references therein.
TABLE I.
Main Model Parameters
| Parameter Description | Value | Reference |
|---|---|---|
| Tumor tissue threshold for hypoxia | 0.5750 | [10] |
| Tumor tissue threshold for necrosis | 0.5700 | [10] |
| Cell degradation rate in necrotic region G | 0.3 a | [10] |
| O2 transfer rate from vasculature λσ,ev | 5 a | [11] |
| O2 diffusivity Dσ | 1 a | [11] |
| O2 uptake rate by proliferating tumor cells | 1.5 a | [11] |
| O2 uptake rate by hypoxic tumor cells | 1.3 a | [11] |
| O2 uptake rate by host microenvironment | 0.12 a | [11] |
| O2 decay rate in necrotic tissue | 0.35 a | [11] |
| Tumor native proliferation rate (day−1) λM | 0.5 a | Calibrated b |
| PTX transfer rate from vasculature λs,ev | 5 a | [15] |
| PTX diffusivity Ds | 0.6 a | [18] |
| PTX cellular uptake rate λs,uptake | 1.5 a | [15] |
| PTX drug effect λs,effect | 7.5 | Calibrated c |
| M1 NO induced death rate λNO | 5 /s | Calibrated b |
| M1 differentiation scaling coefficient | 3 | Calibrated b |
| M2 induced proliferation rate λF | 1000 /s | Calibrated b |
| M2 differentiation scaling coefficient | 33 | Calibrated b |
| Immune drug transfer rate from vasc. λN,ev | 0.5 | Calibrated d |
| Immune drug diffusivity DN | 0.25 | Calibrated d |
| Immune drug strength λN.effect | 0, 5, 9 | Calibrated d |
| Immune drug decay rate λN.decay | 1.25 | Calibrated d |
| Cytokine production rate λC,prod | 1.0 e | [13] |
| Cytokine diffusivity DC | 0.005 a | [13] |
| Cytokine wash-out rate into vasculature λC,circ | 0.006 a | [13] |
| Cytokine decay rate λC,decay | 0.001 a | [13] |
Value is non-dimensionalized by the diffusivity of oxygen [19] (1 × 10⁻⁵ cm2 s−1)
Calibrated to match NSCLC nodule growth observed in [18].
Calibrated to approximate a half-maximal inhibitory drug concentration.
Calibrated for drug to achieve a range of M1/M2 ratios as in [20].
Value is rescaled by the production rate of VEGF-165 protein, a typical TAF molecule.
III. Results
A. Tumor Growth Influenced by Macrophages
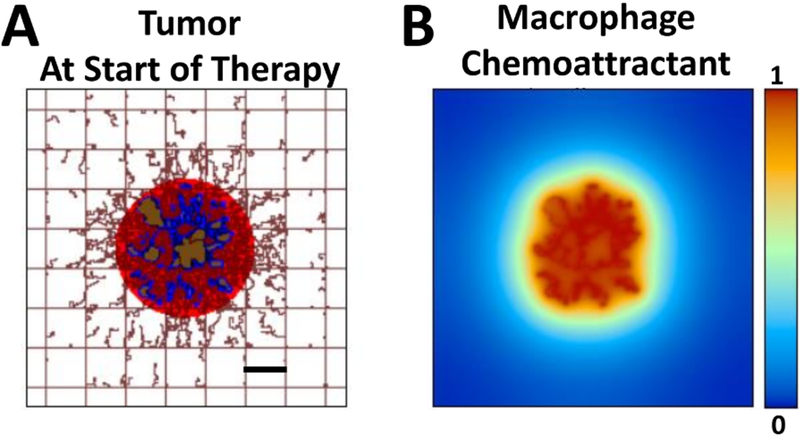
The simulated NSCLC tumor nodule at 30 d after initiation is shown in Fig. 1 at the start of therapy.
Figure 1.
Simulated tumor at start of therapy. (A) Tumor is shown with proliferative (red), hypoxic (blue), and necrotic (brown) regions. Capillaries in the surrounding tissue are depicted by the rectangular grid, indicating a normal vascular structure providing adequate oxygen and nutrients to the tissue. Capillary sprouts are growing in the direction of the tumor, in response to angiogenic factors released by hypoxic tissue. (B) Concentration (non-dimensional units) of a generic macrophage chemoattractant, such as VEGF, released by tumor tissue. Bar=250 μm.
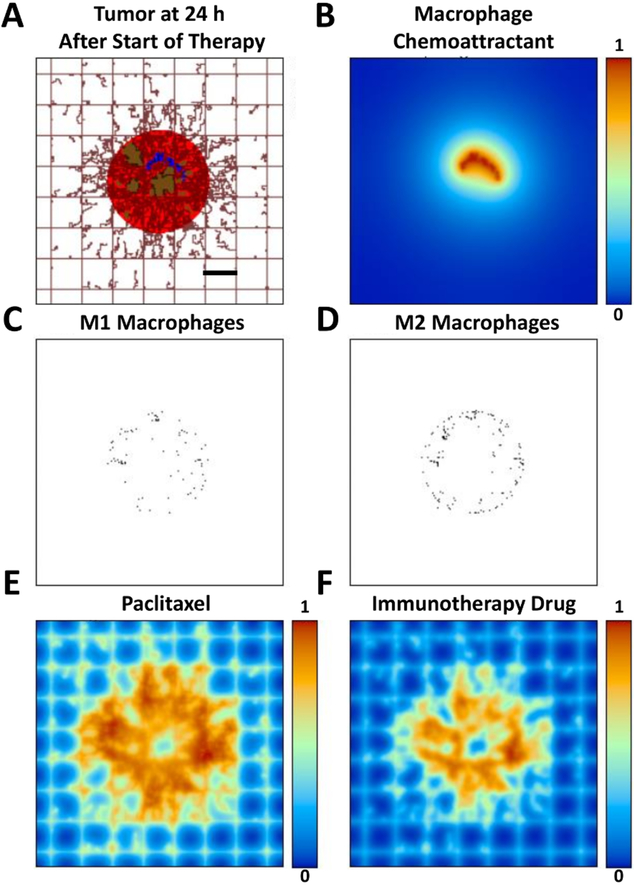
The tumor consists of proliferative, hypoxic and necrotic tissue regions. Monocyte infiltration begins at the onset of hypoxia, and differentiation into M1 or M2 phenotypes is driven by chemoattractants (e.g., TAF) released by hypoxic tissue in the micro-environment. In the model, M1 phenotypes tend to cluster within the tumor nodule, while M2 phenotypes spread around in the immediate tumor periphery.
B. Effect of Immunotherapy on Macrophage Population
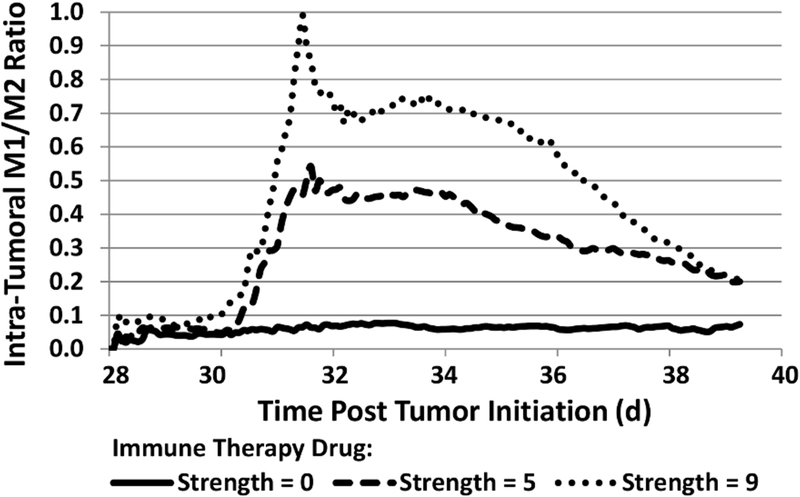
It has been shown that NSCLC tumors with an M1/M2 ratio of 0.9 offered improved survival over those with a ratio of 0.1 [20]. Accordingly, immunotherapy dose strengths were simulated to achieve macrophage ratios in between this range of ratios. Fig. 2 shows the M1/M2 ratios for each case, thus defining the immunotherapeutic drug strength for each case, with the immunotherapy timed so that the ratios peak at the same time as the PTX in circulation.
Figure 2.
Evolution of intra-tumoral macrophage populations (expressed as M1/M2 ratio) during immunotherapy of various drug strengths (non-dimensinal units) started on day 30 post tumor initiation.
C. Tumor Response to Chemotherapy and Immunotherapy
The simulated tumor at 24 h after exposure to PTX and the immunotherapy is shown in Fig. 3, along with the macrophage distributions and the drug concentrations.
Figure 3.
Simulated tumor 24 h after start of therapy. (A) Tumor has started to shrink in response to exposure to the therapy. (B) Hypoxic tissue is reduced, leading to a decrease in release of macrophage chemoattractants (e.g., VEGF). (C) Type 1 macrophages are infiltrating the tumor, while (D) Type 2 macrophages tend to remain in the tumor periphery. (E) Distribution of PTX (concentration in non-dimensional units). (F) Distribution of immunotherapeutic drug (concentration in non-dimensional units). Bar=250 μm.
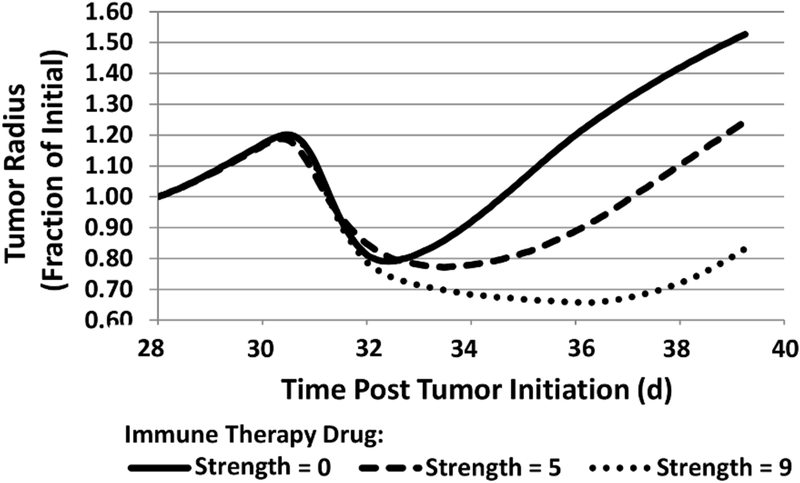
The tumor radius in time is shown in Fig. 4, indicating that the immunotherapy affects the duration of tumor regression but not necessarily its rate of regrowth post treatment.
Figure 4.
Progression of tumor radius in response to chemotherapy combined with immunotherapy of various strengths (non-dimensional units), started at 30 d post tumor initiation.
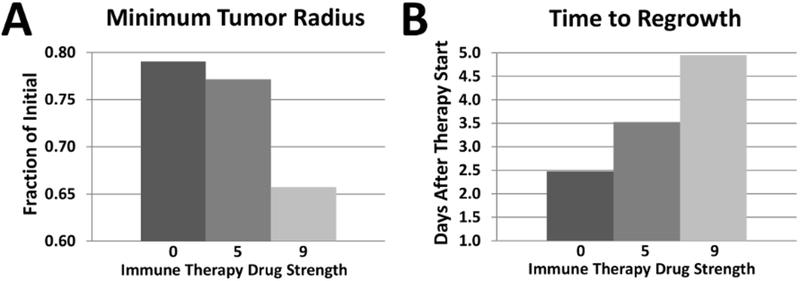
The extent of the tumor response is summarized in Fig. 5, showing that the combination of PTX and strongest immuno-therapy achieves the highest response, as expected, yet this response is nonlinear with respect to the magnitude of the immunotherapy drug strength affecting the macrophage repolarization. Fine-tuning this strength to achieve M1/M2 ratios that lead to tumor remission would need to be customized to particular tumor and therapy parameters.
Figure 5.
Tumor response to combined chemotherapy and immuno-therapy. (A) Minimum tumor radius achieved for range of immunotherapy drug strengths. (B) Time for tumor to resume growth after therapy.
IV. Discussion
Building upon previous modeling of tumor growth [10][11], chemotherapy [16][18], and tumor-associated macrophages [13], this work presents a framework to evaluate tumor response to the combination of chemotherapy and immunotherapy, focusing on macrophage repolarization in the tumor microenvironment. Tumor growth and chemotherapy parameters were set to simulate a NSCLC nodule being treated with paclitaxel. The system offers the capability to explore variation in therapy parameters, including dosing, drug strength, and effect, and their combination across various immuno- and chemotherapeutics.
Much work remains to make modeling systems such as this one clinically relevant. Patient measureable parameters, including tumor size, vascularization density and macrophage presence could be evaluated from imaging and histology. Parameters that might be considered biologically similar across patients, e.g., oxygen diffusivity in tissue and drug cellular uptake rates, could be set from previous measurements, as in this study. Expansion of the model to include additional patient tumor-specific information, such as genomic, transcriptomic and metabolomic data, might enhance system predictivity, with the ultimate goal of personalizing therapy efficacy and enhancing patient outcomes.
Acknowledgments
Research supported by U.S. National Institutes of Health/National Cancer Institute Grant R15CA203605.
Contributor Information
Louis T. Curtis, Bioengineering Department, University of Louisville, Louisville, KY 40292 USA
Hermann B. Frieboes, Bioengineering Department and James Graham Brown Cancer Center, University of Louisville, Louisville, KY 40292 USA
References
- [1].Apetoh L, Ghiringhelli F, Tesniere A, et al. , “Toll-like receptor 4–dependent contribution of the immune system to anticancer chemo-therapy and radiotherapy,” Nat. Med, vol. 13, pp. 1050–1059, 2007. [DOI] [PubMed] [Google Scholar]
- [2].Liu Y, and Zeng G, “Cancer and Innate Immune System Interactions: Translational Potentials for Cancer Immunotherapy,” J. Immunother, vol. 35, pp. 299–308, 2012. [DOI] [PMC free article] [PubMed] [Google Scholar]
- [3].Zhu J, Zhi Q, Zhou BP, et al. , “The Role of Tumor Associated Macrophages in the Tumor Microenvironment: Mechanism and Functions,” Anticancer Agents Med. Chem, vol. 16, pp. 1133–1141, 2016. [DOI] [PubMed] [Google Scholar]
- [4].Conway EM, Pikor LA, Kung SH, et al. , “Macrophages, Inflammation, and Lung Cancer,” Am. J. Respir. Crit. Care Med, vol. 193, pp. 116–130, 2016. [DOI] [PubMed] [Google Scholar]
- [5].Jackute J, Zemaitis M, Pranys D, et al. , “Distribution of M1 and M2 macrophages in tumor islets and stroma in relation to prognosis of non-small cell lung cancer,” BMC Immunol, vol. 19, p. 3, 2018. [DOI] [PMC free article] [PubMed] [Google Scholar]
- [6].Anagnostou VK and Brahmer JR, “Cancer Immunotherapy: A Future Paradigm Shift in the Treatment of Non–Small Cell Lung Cancer,” Clin. Cancer Res, vol. 21, pp. 976–984, 2015. [DOI] [PubMed] [Google Scholar]
- [7].Byrne HM, “Dissecting cancer through mathematics: from the cell to the animal model,” Nat. Rev. Cancer, vol. 10, pp.221–320, 2010. [DOI] [PubMed] [Google Scholar]
- [8].Barbolosi D, Ciccolini J, Lacarelle B, Barlési F, and André N, “Computational oncology--mathematical modelling of drug regimens for precision medicine,” Nat Rev. Clin. Oncol, vol. 13, pp. 242–542, 2016. [DOI] [PubMed] [Google Scholar]
- [9].Castiglione F and Piccoli B, “Cancer immunotherapy, mathematical modeling and optimal control,” J. Theor. Biol, vol. 247, pp. 723–732, 2007. [DOI] [PubMed] [Google Scholar]
- [10].Wu M, Frieboes HB, McDougall SR, et al. , “The effect of interstitial pressure on tumor growth: Coupling with the blood and lymphatic vascular systems,” J. Theor. Biol, vol. 320, pp. 131–151, 2013. [DOI] [PMC free article] [PubMed] [Google Scholar]
- [11].Macklin P, McDougall S, Anderson ARA, et al. , “Multiscale modelling and nonlinear simulation of vascular tumour growth,” J. Math. Biol, vol. 58, pp. 765–798, 2009. [DOI] [PMC free article] [PubMed] [Google Scholar]
- [12].McDougall SR, Anderson ARA, and Chaplain MAJ, “Mathematical modelling of dynamic adaptive tumour-induced angiogenesis: Clinical implications and therapeutic targeting strategies,” J. Theor. Biol, vol. 241, pp. 564–589, 2006. [DOI] [PubMed] [Google Scholar]
- [13].Mahlbacher G, Curtis LT, Lowengrub J, and Frieboes HB, “Mathematical modeling of tumor-associated macrophage interactions with the cancer microenvironment,” J. Immunother. Cancer, vol. 6, p. 10, 2018. [DOI] [PMC free article] [PubMed] [Google Scholar]
- [14].Frieboes HB, Curtis LT, Wu M, Kani K, and Mallick P, “Simulation of the Protein-Shedding Kinetics of a Fully Vascularized Tumor,” Cancer Inform, vol. 14, pp. 163–175, 2015. [DOI] [PMC free article] [PubMed] [Google Scholar]
- [15].Ware MJ, Curtis LT, Wu M, et al. , “Pancreatic adenocarcinoma response to chemotherapy enhanced with non-invasive radio frequency evaluated via an integrated experimental/computational approach,” Sci. Rep, vol. 13, p. 3437, 2017. [DOI] [PMC free article] [PubMed] [Google Scholar]
- [16].van de Ven AL, Wu M, Lowengrub J, et al. , “Integrated intravital microscopy and mathematical modeling to optimize nanotherapeutics delivery to tumors,” AIP Adv, vol. 2, p. 11208, 2012. [DOI] [PMC free article] [PubMed] [Google Scholar]
- [17].Chandolu V and Dass CR, “Treatment of lung cancer using nanoparticle drug delivery systems,” Curr. Drug Discov. Technol, vol. 10, pp. 170–176, 2013. [DOI] [PubMed] [Google Scholar]
- [18].Curtis LT, England CG, Wu M, Lowengrub J, and Frieboes HB, “An interdisciplinary computational/experimental approach to evaluate drug-loaded gold nanoparticle tumor cytotoxicity,” Nanomedicine (Lond), vol. 11, pp. 197–216, 2016. [DOI] [PMC free article] [PubMed] [Google Scholar]
- [19].Nugent LJ and Jain RK, “Extravascular diffusion in normal and neoplastic tissues,” Cancer Res, vol. 44, pp. 238–244, 1984. [PubMed] [Google Scholar]
- [20].Ma J J, Liu L, Che G, Yu N, Dai F, and You Z, “The M1 form of tumor-associated macrophages in non-small cell lung cancer is positively associated with survival time,” BMC Cancer, vol. 10, p. 112, 2010. [DOI] [PMC free article] [PubMed] [Google Scholar]


