Abstract
Noble metal nanoparticles are well known for their strong interactions with light through the resonant excitations of the collective oscillations of the conduction electrons on the particles, the so-called surface plasmon resonances. The close proximity of two nanoparticles is known to result in a red-shifted resonance wavelength peak, due to near-field coupling. We have subsequently employed this phenomenon and developed a new approach to glucose sensing, which is based on the aggregation and disassociation of 20-nm gold particles and the changes in plasmon absorption induced by the presence of glucose. High-molecular-weight dextran-coated nanoparticles are aggregated with concanavalin A (Con A), which results in a significant shift and broadening of the gold plasmon absorption. The addition of glucose competitively binds to Con A, reducing gold nanoparticle aggregation and therefore the plasmon absorption when monitored at a near-red arbitrary wavelength. We have optimized our plasmonic-type glucose nano-sensors with regard to particle stability, pH effects, the dynamic range for glucose sensing, and the observation wavelength to be compatible with clinical glucose requirements and measurements. In addition, by modifying the amount of dextran or Con A used in nanoparticle fabrication, we can to some extent tune the glucose response range, which means that a single sensing platform could potentially be used to monitor μM → mM glucose levels in many physiological fluids, such as tears, blood, and urine, where the glucose concentrations are significantly different.
Keywords: Gold colloids, Tunable glucose sensors, Plasmonic nanosensors, Interparticle coupling, Small molecule sensing, Surface plasmon resonance
The aggregation of noble metal nanoparticles, which can be induced by specific bioaffinity reactions, has produced a practical tool for the development of colorimetric detection of DNA hybridization [1–3], immunoassays [4], and the controlled assembly of nanoparticles [5]. Nanogold1 particles are used in multifarious applications due to their useful optical and electronic properties, exhibiting a strong surface plasmon resonance (SPR) in aqueous media at ≈520 nm [6,7], where the resonant frequency of the nanoparticle is known to be dependent on its size, shape, material properties, surrounding medium, and proximity to other nanoparticles [8]. Both experimental and theoretical studies have shown that the resonant wavelength of two close-proximity and coupled nanoparticles is significantly redshifted from that of the individual particles, where the shift decays approximately exponentially with increasing particle spacing, decreasing to almost zero when the gap between two particles exceeds about 2.5 times the particles’ sizes [8]. Given this property and the fact that gold nanoparticles are amenable to the attachment of biomolecules or ligands through well-known thiol chemistry [9], they potentially become a very attractive tool for biological sensing. Indeed, their generally low susceptibility to biofouling (nonspecific absorption) has allowed several noble metal nanosensors based on absorption measurements [4], light scattering [5,10,11], ratiometric light scattering [12], transmission electron microscopy [11], and small-angle X-ray scattering [11] to be realized. Subsequently we have designed, developed, and tested a range of nanogold glucose sensors and, to the best of our knowledge, their use in glucose sensing has not been explored.
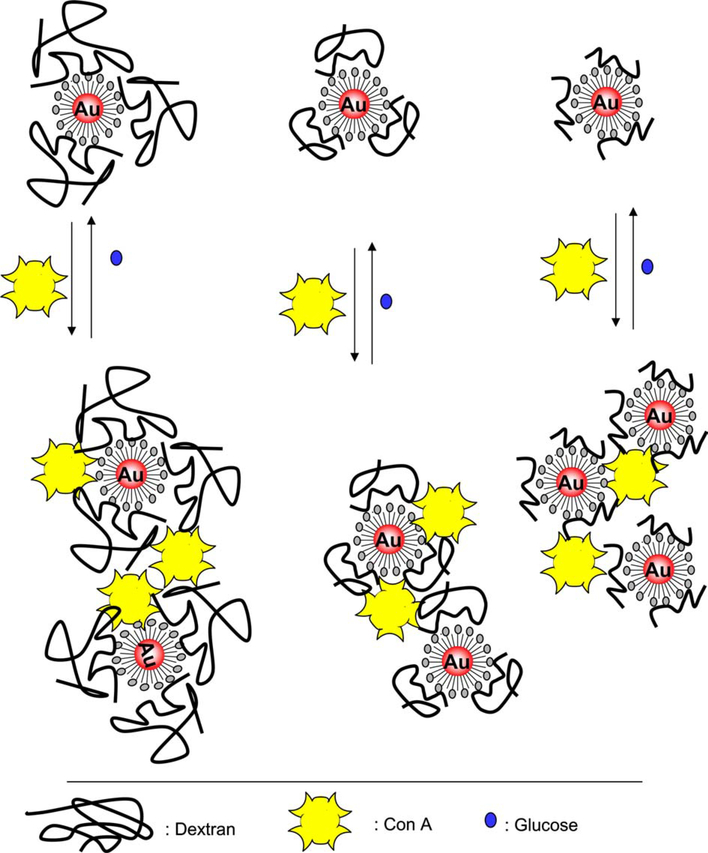
The importance of glucose testing and determination in the management of diabetes needs no introduction. Yet after several decades of intense research, still no method is available for the continuous noninvasive monitoring of blood glucose nor is a generic technology that could be applied across the board for glucose sensing in other physiological fluids. In fact the invasive nature of glucose monitoring in blood, primarily undertaken by “finger pricking,” has further fueled the search for non-invasive technologies [13–21] which can potentially monitor physiological glucose in fluids such as urine and tears. We note the work of Badugu et al. [13–15], which has recently reported the development of a glucose-sensing contact lens, where the concentration of glucose in tears tracks blood glucose levels, which are ≈10-fold higher [13,22]. In this paper we report how dextran-coated gold nanoparticles, which have been aggregated by the controlled addition of Con A, provide a useful sensing aggregate (Fig. 1) that shows plasmon changes in the presence of glucose, which is widely known to competitively bind Con A [23,24]. By tuning the dextran molecular weight and concentration of Con A, used to form the sensing aggregate, we are able to tune the dynamic glucose sensing range. Given that the nanosensing aggregate is preferentially stable at physiological pH and functions optically in tears, urine, and blood, we believe that our technique moves us closer toward the goal of a generic platform for physiological glucose sensing.
Fig. 1.
Glucose sensing mechanism: the dissociation of Con A-aggregated dextran-coated gold nanoparticles.
Experimental
Materials
Gold nanoparticle dispersions (monodisperse, either 20 or 10 nm average particle diameter), concanavalin A from Canavalia ensiformis, dextran (average molecular weight: 64,000, 170,000, and 505,000), hydrogen peroxide, sulfuric acid, sodium phosphate monobasic, phosphate-buffered saline (PBS), absolute ethanol, 2-(2-aminoethoxy)ethanol (AEE), and N-hydroxy-2,5- pyrrolidinedione (NHS) were obtained from Sigma. 16-Mercaptohexadecanoic acid (16-MHDA) and polyoxyethylene [20], sorbitan monolaurate (Tween 20), epichlorohydrin, 2-methoxyethyl ether (diglyme), and nitric acid were obtained from Aldrich. N-3-(dimethylaminopropyl)-N′-ethyl-carbodiimide (EDC) was obtained from Fluka. All chemicals were used as received.
Buffers and solutions
Sodium phosphate monobasic buffer solution was prepared to a 10mM concentration at pH 7. PBS was dissolved in deionized water and the pH was adjusted to 7.4. Exact pH values for buffer solutions were obtained using a Beckman pH meter. Deionized water (>18 MΩ/cm) was used in the preparation of all buffer solutions. All glassware was washed with “piranha solution” (3:7 30% H2O2/H2SO4) prior to use.
Solutions of 0.50 mM 16-MHDA were prepared in degassed ethanol. Tween 20 solutions were prepared in sodium phosphate buffer at pH 7.
Surface modification of the nanogold: preparation of the aggregate glucose nanosensors
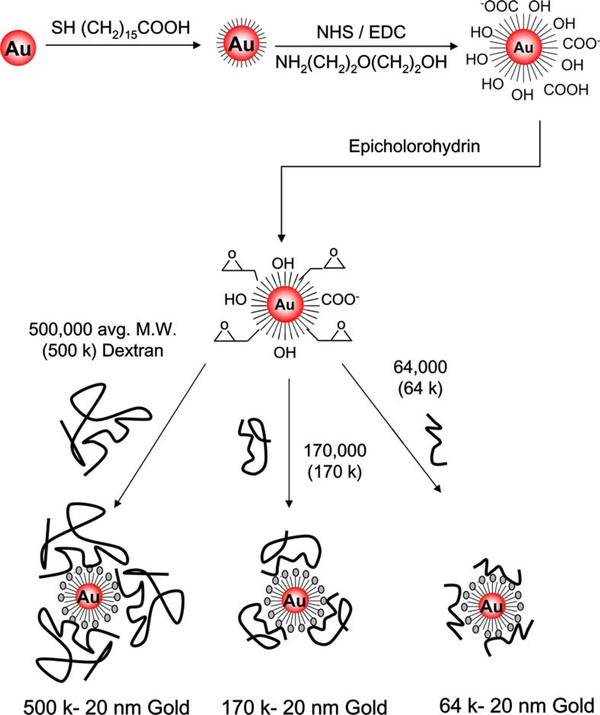
The immobilization of dextran on gold nanoparticles was performed using the following four steps: (I) chemisorption of a long-chain carboxyl-terminated alkane thiol on gold nanoparticles as described previously [25], (II) activation of surface carboxyl groups using EDC and NHS and covalent attachment of AEE, (III) activation of hydroxyl groups using epicholorohydrin, and (IV) covalent coupling of dextran (Fig. 2).
Fig. 2.
Synthetic scheme for the preparation of the dextran-coated gold nanoparticles.
Gold nanoparticle dispersions with concentrations of 0.80 nM for 20-nm and 8nM for 10-nm gold colloids (determined by measuring absorbance at 520 nm and using extinction coefficients of 1.25 × 10⁹ and 1.21 × 10⁸ M−1 cm−1 for 20- and 10-nm gold, respectively; Sigma) were degassed with nitrogen before use. Equal volumes (400 μl) of gold nanoparticle dispersions (0.80 nM/8 nM, before mixing) and Tween 20 (1.82 mg/ml, before mixing) in pH 7 buffer were gently mixed and allowed to stand for 30 min for the physisorption of the Tween 20 to the gold nanoparticles [25]. Then 400 μl of 0.50 mM 16-MHDA was added and the final mixture (final concentrations: [gold nanoparticles] = 0.27 nM/2.67 nM; [Tween 20] = 0.61 mg/ml; [16-MHDA] = 0.17 mM) was allowed to stand for 3 h for the chemisorption of 16-MHDA to be completed on the gold colloids, while simultaneously displacing Tween 20 [25]. To remove excess 16-MHDA and Tween 20, the final mixture was centrifuged (three times for 15 min at 16,060g; the supernatants were discarded after each cycle) and resuspended in phosphate buffer (with 1.82 mg/ml Tween 20 at pH 7). 16-MHDA-modified gold colloids that remained in the centrifugate were then reacted with a mixture of freshly prepared 50 mM NHS and 200 mM EDC solution (in phosphate buffer without Tween 20) for 5 min. The resulting nanoparticle dispersion was centrifuged (5 min, 16,060g) and, after discarding the supernatant, the remaining NHS-ester-alkane-thiol-modified gold nanoparticles were reacted with a freshly prepared solution of AEE (2% v/v) for 10 min. Excess AEE was removed by centrifugation (5 min, 16,060g, at least three times). The retentate that contained AEE modified-gold nanoparticles was centrifuged (5 min, 16,060g). The hydroxyl groups on the AEE-modified-gold nanoparticles were activated with 0.6 M epicholorohydrin solution in a 1:1 mixture of 0.4 M NaOH and diglyme for 4 h at room temperature. The nanoparticle dispersion was then centrifuged for 10 min at 16,060g, resuspended in diglyme, and centrifuged again to remove the excess epicholorohydrin. The centrifugate, containing AEE-modified-gold nanoparticles with active epoxide groups, was incubated in dextran solution (0.1 M NaOH) for 20 h [26]. Finally, dextran-modified gold nanoparticles were centrifuged for 15 min at 16,060g, resuspended in 0.1 M NaOH, and centrifuged four more times to remove the excess dextran. All solutions of dextran-coated gold nanoparticles were stored in polypropylene centrifuge tubes in the dark to prevent light-induced flocculation of the nanoparticles and oxidation of the alkane thiols [27].
Methods
All absorption measurements were performed using a Varian UV/VIS 50 Spectrophotometer using quartz cuvettes (Starna). Standard Varian kinetic software and Sigma Plot 8.0 were used in the data analysis.
Results and discussion
Fabrication of the glucose-sensing aggregates
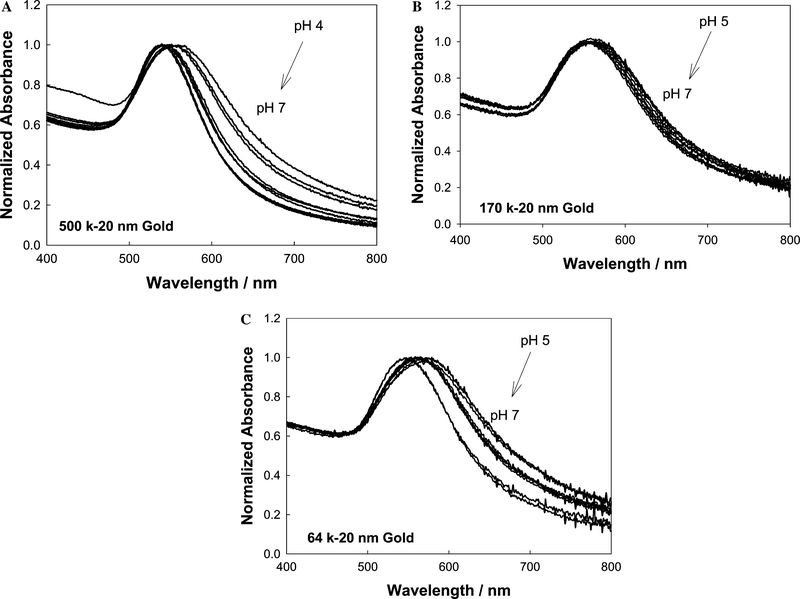
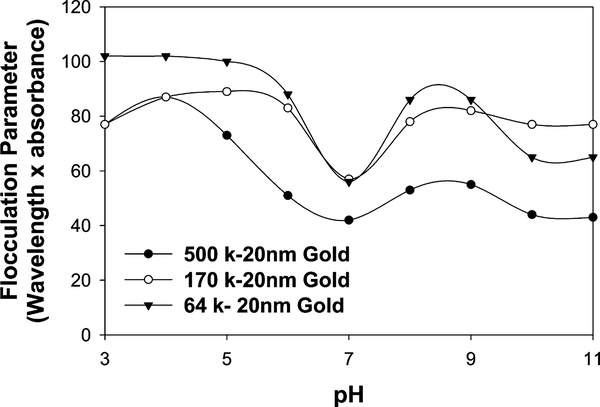
For the building of plasmonic nanogold glucose sensors it is important to consider the pH effects on the stability of the sensing aggregates. Fig. 3 shows the normalized absorption spectra of the dextran-coated nanoparticles considered in this study as a function of pH. As shown in Figs. 1 and 2 and described under Experimental, three model nanogold systems were considered, namely 500-, 170-, and 64-k dextran-coated 20-nm gold. From Fig. 3, we can see that the dextran-coated nanogold plasmon absorption band is typically red-shifted and broader at lower pH values than at physiological pH values for all three model systems. As has been previously reported [8,12], the aggregation of nanogold results in a broadening of the absorption spectrum at wavelengths longer than 600 nm and a shift in the SPR peak. We have found that the aggregation of the dextran-coated nanoparticles in solution depends on several parameters, such as pH and ionic strength, which is thought to be due to the balance of forces, attractive van der Waals forces and repulsive electrostatic forces, between the nanoparticles. The flocculation parameter [25,27,28] is the integrated absorption between 600 and 800 nm and provides further evidence for the extent of aggregation; (see Fig. 4), which indicates a notable difference in nanoparticle stability at approx neutral pH. For physiological glucose sensing, this is ideal, especially given that physiologies usually do not experience notable changes in pH. The reduced flocculation parameter at pH 7 (improved particle stability) is thought to be a function of residual carboxylic acid groups that may be still present on the nanogold surface after reaction with AEE (Fig. 2, step 2), and we have thus depicted this by the presence of carboxylic acid groups throughout Fig. 2. We have estimated the conversion of the carboxylic acids groups shown in Fig. 2, step 2 to be ≈80% [29]. Interestingly, the 500-k dextran nanogold shows better particle stability than the 170- and 64-k dextran-coated nanogold particles, which we have attributed to the dextran size. In any event the presence of unreacted carboxylic acid groups allows for better particle stability at a neutral pH. Subsequently all glucose sensing studies were undertaken at a solution pH of 7.
Fig. 3.
Normalized absorbance spectra of dextran-coated gold nanoparticles 500 k (A), 170 k (B), and 64 k (C) in different buffers with the pH varying between 3 and 11.
Fig. 4.
Flocculation parameter versus the pH of the medium.
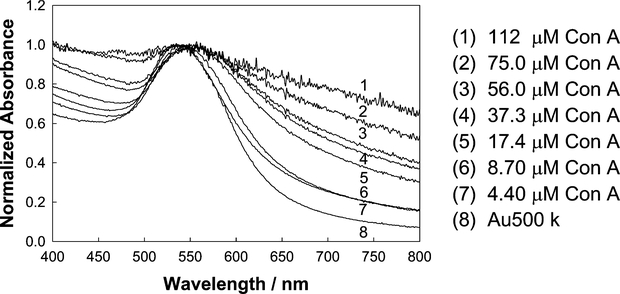
As depicted in Fig. 1, the sensing aggregate works by the dissociation of Con A-aggregated dextran-coated nanogold particles upon addition of glucose. Con A is a well-known multivalent protein (four binding sites at pH 7) [23,24], which allows for at least two different dextran-coated nanoparticles to cross-link, due to the affinity between dextran and Con A [23,24,30]. The addition of Con A both broadens and redshifts the absorption spectra of the dextran-coated nanogold particles, a function of interparticle coupling due to the close proximity of the nanogold particles (Fig. 5). For our samples the aggregation could also be seen visually with a color change from pinky-red to purple upon aggregation.
Fig. 5.
Normalized absorption spectra of 500 k dextran-coated 20-nm nanogold, cross-linked with different concentrations of Con A.
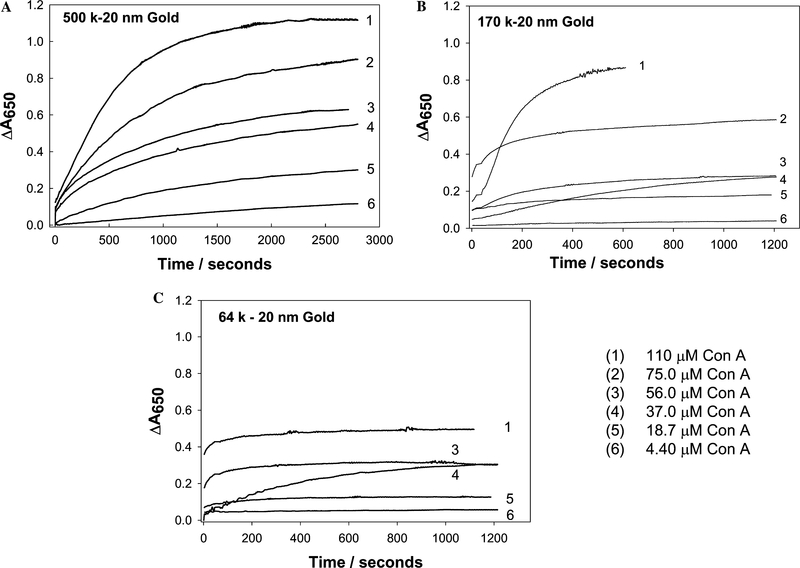
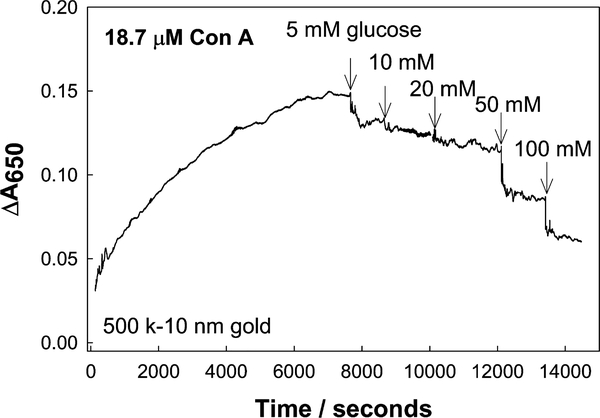
We chose an arbitrary near-red single wavelength where the absorption changes appeared to be the greatest after Con A addition (Fig. 5). Fig. 6 shows the time-dependent change of absorbance at 650 nm for the dextran-coated nanogold particles with different concentrations of Con A. The greatest changes in ΔA650 were observed for the 500 k dextran-coated particles, (Fig. 6A), with relatively smaller changes observed for the 64 k dextran- coated nanogold particles. The changes in absorption (ΔA650 = measured abs. − initial abs. at time t = 0) could be modeled moderately well by a growth exponential function of the form
| (1) |
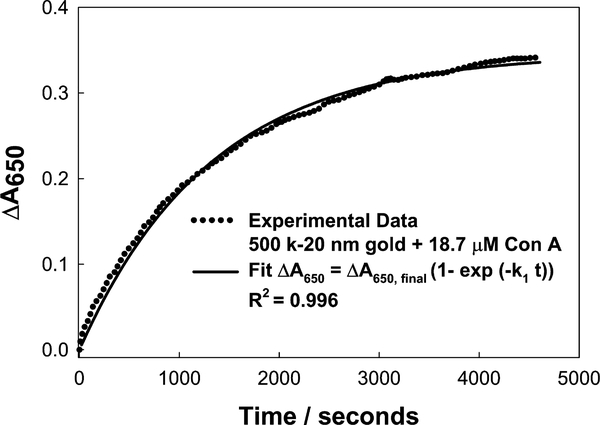
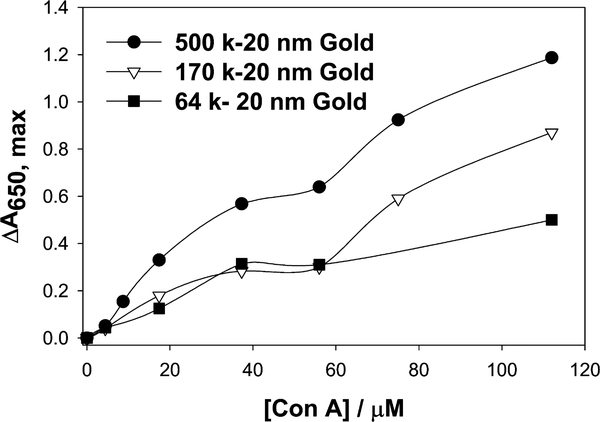
where ΔA650 is the Δ650-nm absorbance at time t, ΔA650(final) is the Δ650-nm final plateau absorbance, and k1 is the rate constant for the rate of change of absorbance, due to dextran-coated nanogold aggregation (units s−1), Fig. 7. For the three different dextran molecular weights considered for nanosensor fabrication, we typically saw both a greater rate of absorption change due to the aggregation of the nanoparticles, and a greater final (plateau) ΔA650 value, i.e., ΔA650(final) (Fig. 6 and Table 1), for the 500 k dextran-coated nanogold particles. By plotting the maximum plateau values (past their 95% ΔA650 values) as a function of Con A concentration this can readily be seen (Fig. 8). One possible explanation for this observation could be the availablility of dextran on the surface of the nanogold for Con A binding, where the molecular weight of Con A is approximately 104,000 Da (pH 7), and the extent of interaction between Con A and dextran is limited by the size of the dextran. Hence as the size of the dextran is decreased the possibilities for cross-linking are reduced.
Fig. 6.
Time-dependent change in absorbance at 650 nm for 500 k dextran coated gold nanoparticles (A), 170 k dextran-coated gold nanoparticles (B), and 64 k dextran-coated gold nanoparticles (C) with different initial amounts of Con A.
Fig. 7.
Change in absorbance at 650 nm for 500 k dextran-coated gold nanoparticles: experimental data and the model fit.
Table 1.
| [CON A] (mM) | 500 k |
170 k |
64 k |
||||||
|---|---|---|---|---|---|---|---|---|---|
| ΔA650, final | k1 (s−1) | R2 | ΔA650, final | k1 (s−1) | R2 | ΔA650, final | k1 (s−1) | R2 | |
| 4.40 | 0.056 | 3.87 × 10⁻⁴ | 0.988 | 0.037 | 4.13 × 10⁻³ | 0.804 | — | — | — |
| 18.7 | 0.340 | 7.65 × 10⁻⁴ | 0.996 | 0.167 | 9.37 × 10⁻³ | 0.780 | 0.122 | 0.29 × 10⁻³ | 0.500 |
| 37.0 | 0.535 | 1.40 × 10⁻³ | 0.956 | 0.311 | 1.81 × 10⁻³ | 0.991 | 0.311 | 2.80 × 10⁻³ | 0.995 |
| 56.0 | 0.611 | 1.60 × 10⁻³ | 0.944 | 0.271 | 5.39 × 10⁻³ | 0.956 | 0.304 | 0.69 × 10⁻³ | 0.560 |
| 75.0 | 0.892 | 1.81 × 10⁻³ | 0.912 | 0.551 | 10.9 × 10⁻³ | 0.916 | — | — | — |
| 110 | 1.122 | 1.94 × 10⁻³ | 0.996 | 0.912 | 5.30 × 10⁻³ | 0.993 | — | — | — |
Fig. 8.
Maximum change in absorbance at 650 nm for dextran-coated gold nanoparticles versus the concentration of Con A used.
It is also worth noting that the true form of the equation for the rate of change of absorbance, i.e., Eq. (1), is probably
| (2) |
where A0 is the initial ΔA650 absorbance, with an expected A0 = 0 by definition. However, the fact that A0 ≠ 0 (visually in Fig. 6) simply reflects the time for Con A addition and mixing before/when absorbance measurements began, i.e., a result of diffusion-limited cluster aggregation [31,32]. In any event Eq. (1) provides a simple and useful approximation.
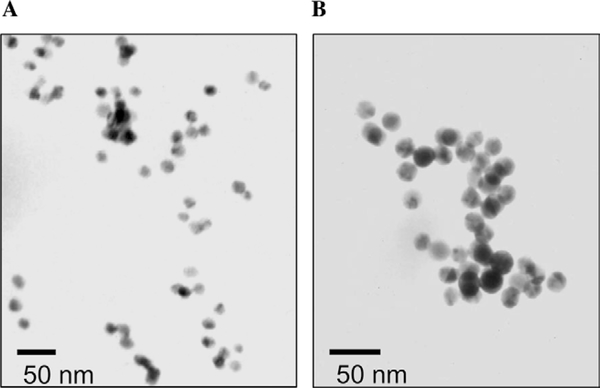
Finally it is informative to consider the TEM images2 of the dextran-coated nanogold, before and after addition of Con A. Fig. 9 shows one representative set of images. Initially the dextran-coated nanogold particles are well separated from each other (unaggregated) but, after the addition of Con A, they are observed to be mostly aggregated (Fig. 9A and B, respectively), forming the glucose sensing aggregates.
Fig. 9.
TEM images of 170 k dextran-coated 20-nm gold nanoparticles before (A) and after (B) the addition of 110 mM Con A.
Plasmonic glucose sensing
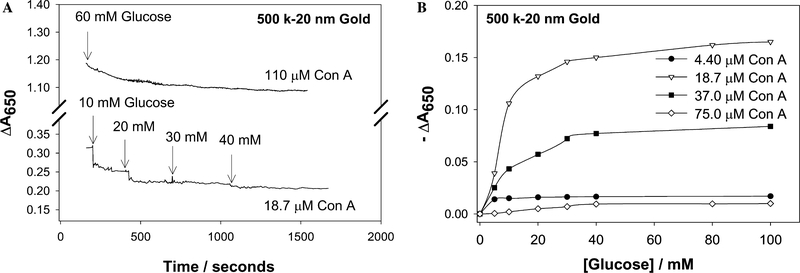
There have been continued efforts to develop optical-based methods for glucose detection [19–21,33–40]. Several solution-based fluorescence methods have been based on the glucose binding protein Con A, and a polysaccharide, typically dextran, which serves as a competitive ligand for glucose [30]. Typically for fluorescence-based glucose sensors, the Con A is labeled with a fluorescent donor and the dextran with an acceptor, but the labels can readily be reversed [30]. The binding of Con A and dextran results in decreases in both fluorescence intensity and lifetime of the donor. However, the addition of glucose competes for the glucose binding sites on Con A, releasing Con A from the acceptor and resulting in increases in the intensity, lifetime, and phase angles [30]. In our systems, the aggregation of the dextran-coated nanogold with Con A results in both a red-shift and a broadening of the gold plasmon absorption. In manner analogous to that of the FRET systems, based on dextran and Con A as described above, the presence of glucose competes with dextran-coated colloids for Con A binding sites, resulting in the dissociation of the Con A-aggregated nanogold (Fig. 1). This results in a decrease in the absorbance of the nanogold when monitored at an arbitrary near-red 650-nm wavelength (Figs. 10–12).
Fig. 10.
Time-dependent cumulative change in absorbance at 650 nm for 500 k dextran-coated gold nanoparticles after the addition of glucose (A), Cumulative change in absorbance at 650 nm for 500 k dextran-coated gold nanoparticles versus the concentration of glucose (B).
Fig. 12.
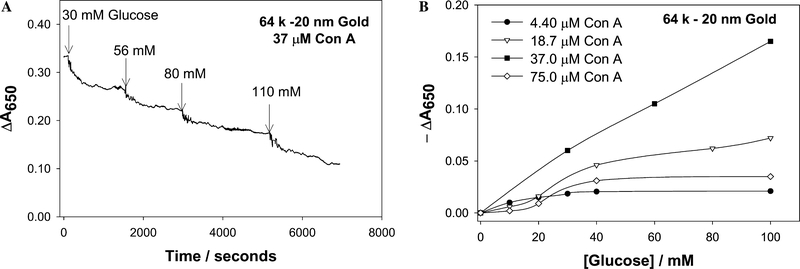
Time-dependent cumulative change in absorbance at 650 nm for 64 k dextran-coated gold nanoparticles after the addition of glucose (A), Cumulative change in absorbance 650 nm for 64 k dextran-coated gold nanoparticles versus the concentration of glucose (B).
Upon addition of glucose the 500 k dextran-coated nanogold particles show a cumulative decrease in the absorbance at 650 nm, where all systems studied had been preaggregated past then 95% maximum ΔA650 value. We typically found that the effective concentration range for Con A was between 4.40 and 75 μM. The dissociation of the particles with glucose was insignificant when the Con A concentration was lower than ≈4.40 μM, and thus the recovery of the signal −ΔA650 was too small for practical applications. Too high a concentration of Con A resulted in the complete aggregation and almost flocculation and precipitation of the system, where the amount of glucose subsequently used (>100 mM) was barely enough to cause competitive dissociation. Attractive glucose responses were, however, obtained when dextran-coated nanogold was aggregated with 18–37 μM Con A (Fig. 10B). For the 18.7 μM Con A system, a most attractive glucose dynamic sensing range was observed (1–40 mM), noting that the blood glucose level is 3–8 mM for a healthy person and increases to 2–40 mM in diabetics [22]. For tear glucose, these values are typically 10-fold lower, ranging from 500 μM to several mM glucose [13–15], well within the sensing capabilities of this system.
The decrease in ΔA650 as a function of cumulative glucose addition, i.e., −ΔA650, can be modeled according to
| (3) |
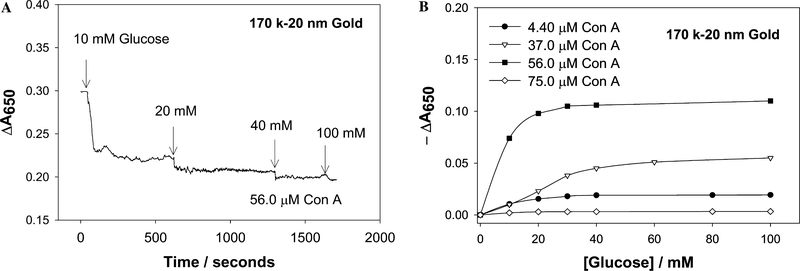
where k2 is the rate of absorption change, which is thought proportional to the rate of dissociation of the nanogold. The respective kinetic data for the three nanogold systems studied are shown in Figs. 10B, 11B, and 12B and in Table 2.
Fig. 11.
Time-dependent cumulative change in absorbance at 650 nm for 170 k dextran-coated gold nanoparticles after the addition of glucose (A), Cumulative change in absorbance 650 nm for 170 k dextran-coated gold nanoparticles versus the concentration of glucose (B).
Table 2.
| [CON A] (mM) | 500 k |
170 k |
64 k |
||||||
|---|---|---|---|---|---|---|---|---|---|
| −ΔA650, final | k2 (mM−1) | R2 | −ΔA650, final | k2 (mM−1) | R2 | −ΔA650, final | k2 (mM−1) | R2 | |
| 4.40 | 0.016 | 0.366 | 0.996 | 0.020 | 0.080 | 0.999 | 0.064 | 0.064 | 0.607 |
| 18.7 | 0.162 | 0.083 | 0.989 | — | — | — | 0.108 | 0.011 | 0.987 |
| 37.0 | 0.083 | 0.066 | 0.977 | 0.061 | 0.029 | 0.987 | 0.446 | 0.005 | 0.996 |
| 56.0 | — | — | — | 0.109 | 0.114 | 0.999 | — | — | — |
| 75.0 | 0.011 | 0.033 | 0.978 | 0.003 | 0.097 | 0.997 | 0.043 | 0.020 | 0.846 |
Similar responses to glucose were observed when 170 and 64 k dextran-coated nanogold particles were used (Figs. 11 and 12, respectively). Again the changes in absorption were negligible when both low and high concentrations of Con A were used. Interestingly the response to glucose saturated again at ≈40 mM glucose, providing a useful physiological glucose sensing range. However, the response of the 64 k dextran-coated nanogold, aggregated with 37 μM Con A, reproducibly showed an increase in −ΔA650 as a function of glucose addition. This is a notable, almost linear, glucose response and is thought to be due to the fact that the initial extent of aggregation is smaller for these sensing aggregates, cf. Fig. 6, and thus the amount of glucose required for dissociation was less, i.e., the dissociation was easier. However, the 64 k dextran-coated nanoparticles typically flocculated and precipitated after 6–8 h, whereas the 500 k dextran-coated nanoparticles were observed to be much more stable with time.
Finally, we investigated the role of reduced gold colloid size, i.e., sensing aggregates derived from only 10-nm nanogold (Fig. 13). We typically found that 500 k dextran-coated 10-nm nanogold showed slightly greater ΔA650 values as compared to the 20-nm aggregates: the reduced colloid size is thought to reduce the total amount of dextran in the sample, given the same density of colloids, and to maintain particle stability. While this result suggests the possibility of tunable glucose sensing ranges by using different sizes of equally coated gold nanoparticles, our experience reveals a greater level of complexity when working with the smaller nanoparticles. One particular difficulty lies in their separation and recovery by centrifugation from the reactants.
Fig. 13.
Time-dependent change in absorbance at 650 nm for 500 k dextran-coated 10-nm gold nanoparticles and the subsequent reduction in ΔA650 by the addition of glucose, i.e., −ΔA650.
Conclusions
We have explored the possibility of glucose sensing using novel nanogold sensing aggregates, where glucose competitively displaces Con A from Con A-aggregated dextran-coated gold colloids. Our findings reveal that our approach can readily determine millimolar changes in glucose solution at physiological pH in a continuous manner, thus providing a new glucose sensing platform. Moreover, the glucose sensing range of the aggregates can be slightly tuned depending on the size of the gold colloids employed, the molecular weight of the dextran, and concentration of Con A used to form the sensing aggregates.
We chose a near-red arbitrary wavelength to monitor our dissociation process, but other suitable wavelengths could readily be chosen depending on the nature of the sample being investigated and in accordance with the maximum absorbance changes that would be required (see Fig. 5). We also note that the greatest extend of aggregation, surprisingly, does not produce the greatest dynamic range of glucose sensing (Figs. 10–12). In this study we chose a 650-nm observation wavelength, which is optically compatible across the board for use in glucose determination in tears, urine, and blood, areas of active physiological glucose research.
Finally it is informative to consider the possible use of our sensing aggregates for ratiometric light scattering sensing [12]. It has been reported that the light scattered from individual colloids can be equivalent to the intensity of 105 fluorescent molecules [41–43]. Upon first examination there appeared to be little use of the scattered light for sensing. The scattered light does not have the information content of fluorescence and did not appear to provide an opportunity for measurements which are not sensitive to total intensity, such as anisotropy or wavelength-ratiometric measurements [30]. However, we have recently realized that shifts in the plasmon absorption should be detectable by the extent of light scattered at various incident wavelengths. In our initial studies using avidin/biotin binding to induce the clustering of colloids, we have found that the ratio of light scattered at two incident wavelengths could be used to determine the extent of colloid aggregation. Importantly, the ratio of scattered intensities was independent of the total colloid concentration over a wide range of colloid concentrations [12]. Also the scattered intensity was somewhat brighter than a solution of rhodamine B at the same optical density. Subsequently our new findings [12] strongly suggest that wavelength-ratiometric light scattering by our sensing aggregates may be a new generic technology for glucose sensing or indeed for other bioaffinity assays that produce colloid aggregation. Further details will be reported from our laboratories in due course.
Acknowledgments
This work was supported by the National Center for Research Resources (RR-08119).
Footnotes
Abbreviations used: AEE, 2-(2-aminoethoxy)ethanol; Con A, concanavalin A; EDC, N-3-(dimethylaminopropyl)-N’-ethyl-carbodiimide; diglyme, 2-methoxyethyl ether; FRET, fluorescence resonance energy transfer; 16-MHDA, 16-mercaptohexadecanoic acid; nanogold, 20-nm-diameter gold colloids; NHS, N-hydroxy-2,5-pyrrolidinedione; PBS, phosphate-buffered saline; SPR, surface plasmon resonance; TEM, transmission electron micrograph.
It should be noted that as a result of the subjective nature of the TEM images and the related artifacts resulting from solvent evaporation and interactions with the TEM substrate, the measurement of aggregate exact sizes was deemed unreliable by TEM. Hence in this study, TEM images were used only to verify the aggregation/dissociation of the sensing system.
References
- [1].Storhoff JJ, Elghanian R, Mucic RC, Mirkin CA, Letsinger RL, One- pot colorimetric differentiation of polynucleotides with single base imperfections using gold nanoparticle probes, J. Am. Chem. Soc 120 (1998) 1959–1964. [Google Scholar]
- [2].Reynolds RA, Mirkin CA, Letsinger RL, Homogeneous, nanoparticle- based quantitative colorimetric detection of oligonucleotides, J. Am. Chem. Soc 122 (2000) 3795–3796. [Google Scholar]
- [3].Elghanian R, Storhoff JJ, Mucic RC, Letsinger RL, Mirkin CA, Selective colorimetric detection of polynucleotides based on the distance- dependent optical properties of gold nanoparticles, Science 277 (1997) 1078–1081. [DOI] [PubMed] [Google Scholar]
- [4].Sastry M, Lala N, Patil V, Chavan SP, Chittiboyina AG, Optical absorption study of the biotin- avidin interaction on colloidal silver and gold particles, Langmuir 14 (1998) 4138–4142. [Google Scholar]
- [5].Cobbe S, Connolly S, Ryan D, Nagle L, Eritja R, Fitzmaurice DJ, DNA- controlled assembly of protein-modified gold nanocrystals, J. Phys. Chem. B 107 (2003) 470–477. [Google Scholar]
- [6].Nath N, Chilkoti A, A colorimetric gold nanoparticle sensor to interrogate biomolecular interactions in real time on a surface, Anal. Chem. 74 (2002) 504–509. [DOI] [PubMed] [Google Scholar]
- [7].Collier CP, Vossmeyer T, Heath JR, Nanocrystal superlattices, Annu. Rev. Phys. Chem. 49 (1998) 371–404. [DOI] [PubMed] [Google Scholar]
- [8].Su K-H, Wei Q-H, Zhang X, Mock JJ, Smith DR, Schultz S, Interparticle coupling effects on plasmon resonances of nanogold particles, Nano Lett. 3 (2003) 1087–1090. [Google Scholar]
- [9].Ulman A, An Introduction to Ultrathin Organic Films: from Langmuir- Blodgett to Self-Assembly, Academic Press, Boston, MA, 1991. [Google Scholar]
- [10].Connolly S, Cobbe S, Fitzmaurice D, Effects of ligand-receptor geometry and stoichiometry on protein-induced aggregation of biotin modified colloidal gold, J. Phys. Chem. B 105 (2001) 2222–2226. [Google Scholar]
- [11].Connolly S, Rao SN, Fitzmaurice D, Characterization of protein aggregated gold nanocrystals, J. Phys. Chem. B 104 (2000) 4765–4776. [Google Scholar]
- [12].Roll D, Malicka J, Gryczynski I, Gryczynski Z, Lakowicz JR, Metallic colloid wavelength-ratiometric scattering sensors, Anal. Chem 75 (2003) 3108–3113. [DOI] [PMC free article] [PubMed] [Google Scholar]
- [13].Badugu R, Lakowicz JR, Geddes CD, Towards the noninvasive continuous monitoring of physiological glucose using a novel monosaccharide-sensing contact lens, Anal. Chem 76 (2004) 610–618. [DOI] [PMC free article] [PubMed] [Google Scholar]
- [14].Badugu R, Lakowicz JR, Geddes CD, Opthalmic glucose sensing: A novel monosaccharide sensing disposable contact lens, Analyst (2004) in press. [DOI] [PMC free article] [PubMed] [Google Scholar]
- [15].Badugu R, Lakowicz JR, Geddes CD, A glucose sensing contact lens: A noninvasive technique for continuous physiological glucose monitoring, J. Fluoresc 13 (2003) 371–374. [DOI] [PMC free article] [PubMed] [Google Scholar]
- [16].Dicesare N, Lakowicz JR, Spectral properties of fluorophores combining the boronic acid group with electron donor group or withdrawing groups, Implication in the development if fluorescence probes for saccarides, J. Phys. Chem. A 105 (2001) 6834–6840. [DOI] [PMC free article] [PubMed] [Google Scholar]
- [17].Dicesare N, Lakowicz JR, A new highly fluorescent probe for monosaccharides based on donor-acceptor diphenyloxazole, Chem. Commun (2001) 2022–2023. [DOI] [PMC free article] [PubMed] [Google Scholar]
- [18].Dicesare N, Pinto MR, Schanze KS, Lakowicz JR, Saccharide detection based on amplified fluorescence quenching of a water soluble poly(phenylene ethylene) by a boronic functionalized benzyl viologen derivative, Langmuir 18 (2002) 7785–7787. [DOI] [PMC free article] [PubMed] [Google Scholar]
- [19].D’auria S, Dicesare N, Gryczynski I, Gryczynski Z, Rossi M, Lakowicz JR, A thermophilic apoglucose dehydrogenase as non-consuming glucose sensor, Biochem. Biophys. Res. Commun 274 (2000) 727–731. [DOI] [PubMed] [Google Scholar]
- [20].Talosa L, Gryczynski I, Eichorn LR, Dattelbaum JD, Castelleno FN, Rao G, Lakowicz JR, Glucose sensors for low cost lifetime-based sensing using a genetically engineered protein, Anal. Biochem. 267 (1999) 114–120. [DOI] [PMC free article] [PubMed] [Google Scholar]
- [21].Meadows D, Schultz JS, Fiber optic biosensor based on fluorescence energy transfer, Talanta 35 (1988) 145–150. [DOI] [PubMed] [Google Scholar]
- [22].Dicesare N, Lakowicz JR, Charge transfer fluorescent probes using boronic acids for monosaccharide signaling, J. Biomed. Optics 7 (2002) 538–545. [DOI] [PMC free article] [PubMed] [Google Scholar]
- [23].Ballerstadt R, Schultz JS, A fluorescence affinity hollow fiber sensor for continuous transdermal glucose monitoring, Anal. Chem 72 (2000) 4185–4192. [DOI] [PubMed] [Google Scholar]
- [24].Yoshizumi A, Kanayama N, Maehara Y, Ide M, Kitano H, Self-assembled monolayer of sugar-carrying polymer chain: sugar balls from 2- methacryloyloxyethyl D-glucopyranoside, Langmuir 15 (1999) 482–488. [Google Scholar]
- [25].Aslan K, Pérez-Luna VH, Surface modification of colloidal gold by chemisorption of alkane thiols in the presence of a nonionic surfactant, Langmuir 18 (2002) 6059–6065. [Google Scholar]
- [26].Lofas S, Johnson B, A novel hydrogel matrix on gold surfaces in surface plasmon resonance sensors for fast and efficient covalent immobilization of ligands, J. Chem. Soc. Commun (1990) 1526–1528. [Google Scholar]
- [27].Weisbecker CS, Merritt MG, Whitesides GM, Molecular self-assembly of aliphatic thiols on gold colloids, Langmuir 12 (1996) 3763–3772. [Google Scholar]
- [28].Mayya KS, Patil V, Sastry M, On the stability of carboxylic acid derivatized gold colloidal particles: The role of colloidal solution pH studied by optical absorption spectroscopy, Langmuir 13 (1997) 3747–3944. [Google Scholar]
- [29].Lahiri J, Isaacs L, Grzyboowski B, Carbeck JD, Whitesides GM, Biospecific binding carbonic anhydrase to mixed SAMs presenting benzenesulfonamide ligands: A model system for studying lateral steric effects, Langmuir 15 (1999) 7186–7198. [Google Scholar]
- [30].Lakowicz JR, Principles of Fluorescence Spectroscopy, second ed., Kluwer/Academic Plenum Publishers, New York, 1997. [Google Scholar]
- [31].Schultess G.K.v., Benedek GB, Blois RWD, Experimental measurements of the temporal evolution of cluster size distribution for high functionality antigens cross-linked by antibody, Macromolecules 16 (1983) 434–440. [Google Scholar]
- [32].Lynch NJ, Kilpatrick PK, Carbonell RG, Aggregation of ligand-modified liposomes by specific interactions with proteins. 1. Biotinylated liposomes and avidin, Biotechnol. Bioeng 50 (1996) 151–168. [DOI] [PubMed] [Google Scholar]
- [33].Tolosa L, Malak H, Rao G, Lakowicz JR, Optical assay for glucose based on the luminescence decay time of the long wavelength dye Cy5, Sensors Actuators B 45 (1997) 93–99. [DOI] [PMC free article] [PubMed] [Google Scholar]
- [34].Robinson MR, Eaton RP, Haaland DM, Koepp GW, Thomas EV, Stallard BR, Robinson PL, Noninvasive glucose monitoring in diabetic patients: A preliminary evaluation, Clin. Chem 38 (1992) 1618–1622. [PubMed] [Google Scholar]
- [35].Heise HM, Marbach R, Koschinsky TH, Gries FA, Noninvasive blood glucose sensors based on near-infrared spectroscopy, Ann. Occup. Hyg 18 (1994) 439–447. [DOI] [PubMed] [Google Scholar]
- [36].March WF, Rabinovitch B, Adams R, Wise JR, Melton M, Ocular glucose sensor, Trans. Am. Soc. Artif. Intern. Organs 28 (1982) 232–235. [PubMed] [Google Scholar]
- [37].Rabinovitch B, March WF, Adams RL, Noninvasive glucose monitoring of the aqueous humor of the eye, Part 1, Measurement of very small optical rotations, Diabetes Care 5 (1982) 254–258. [DOI] [PubMed] [Google Scholar]
- [38].Schier GM, Moses RG, Gan IET, Blair SC, An evaluation and comparison of reflolux liand Glucometer II, two new portable reflectance meters for capillary blood glucose determination, Diabetes Res. Clin. Pract 4 (1988) 177–181. [DOI] [PubMed] [Google Scholar]
- [39].Clarke W, Becker DJ, Cox D, Santiago JV, White NH, Betschart J, Eckenrode K, Levandoski LA, Prusinki EA, Simineiro LM, Snyder AL, Tideman AM, Yaegar T, Evaluation of a new system for self blood glucose monitoring, Diabetes Res. Clin. Pract 4 (1988) 209–214. [DOI] [PubMed] [Google Scholar]
- [40].Trettnak W, Wolfbeis OS, Fully reversible fiber-optic glucose biosensor based on the intrinsic fluorescence of glucose-oxidase, Anal. Chim. Acta 221 (1989) 195–203. [Google Scholar]
- [41].Yguerabide J, Yguerabide EE, Light-scattering submicroscopic particles as highly fluorescent analogs and their use as tracer labels in clinical and biological applications. I. Theory, Anal. Biochem 262 (1998) 137–156. [DOI] [PubMed] [Google Scholar]
- [42].Yguerabide J, Yguerabide EE, Light-scattering submicroscopic particles as highly fluorescent analogs and their use as tracer labels in clinical and biological applications. II. experimental characterization, Anal. Biochem 262 (1998) 157–176. [DOI] [PubMed] [Google Scholar]
- [43].Schultz S, Smith DR, Mock JJ, Schultz DA, Single-target molecule detection with nonbleaching multicolor immunolabels, Proc. Natl. Acad. Sci. USA 97 (2000) 996–1001. [DOI] [PMC free article] [PubMed] [Google Scholar]


