Abstract
Emerging data indicate that structural analogs of bisphenol A (BPA) such as bisphenol S (BPS), tetrabromobisphenol A (TBBPA), and bisphenol AF (BPAF) have been introduced into the market as substitutes for BPA. Our previous study compared in vitro testicular toxicity using murine C18-4 spermatogonial cells and found that BPAF and TBBPA exhibited higher spermatogonial toxicities as compared with BPA and BPS. Recently, we developed a novel in vitro three-dimensional (3D) testicular cell co-culture model, enabling the classification of reproductive toxic substances. In this study, we applied the testicular cell co-culture model and employed a high-content image (HCA)-based single-cell analysis to further compare the testicular toxicities of BPA and its analogs. We also developed a machine learning (ML)-based HCA pipeline to examine the complex phenotypic changes associated with testicular toxicities. We found dose- and time-dependent changes in a wide spectrum of adverse endpoints, including nuclear morphology, DNA synthesis, DNA damage, and cytoskeletal structure in a single-cell-based analysis. The co-cultured testicular cells were more sensitive than the C18 spermatogonial cells in response to BPA and its analogs. Unlike conventional population-averaged assays, single-cell-based assays not only showed the levels of the averaged population, but also revealed changes in the sub-population. Machine learning-based phenotypic analysis revealed that treatment of BPA and its analogs resulted in the loss of spatial cytoskeletal structure, and an accumulation of M phase cells in a dose- and time-dependent manner. Furthermore, treatment of BPAF-induced multinucleated cells, which were associated with altered DNA damage response and impaired cellular F-actin filaments. Overall, we demonstrated a new and effective means to evaluate multiple toxic endpoints in the testicular co-culture model through the combination of ML and high-content image-based single-cell analysis. This approach provided an in-depth analysis of the multi-dimensional HCA data and provided an unbiased quantitative analysis of the phenotypes of interest.
Keywords: high-content image, single-cell analysis, machine learning, in vitro co-culture model, bisphenol A, bisphenol S, bisphenol AF, tetrabromobisphenol A, testicular toxicity
Bisphenol A (BPA) is a high production-volume chemical widely used in consumer products, thermal papers, medical devices, and dental sealants (Rochester, 2013). Exposure to BPA is ubiquitous and occurs mainly through ingestion, inhalation, and dermal contact (Kang et al., 2006; Vandenberg et al., 2007). Bisphenol A was detected in 90% of the United States population in urine samples (Calafat et al., 2008; Lakind and Naiman, 2011). As a known endocrine disruptor, BPA has been shown to interfere with hormonal and homeostatic systems (Braun et al., 2011; Carwile and Michels, 2011; Ehrlich et al., 2012; Lang et al., 2008; Lassen et al., 2014). Bisphenol A exposure has also been associated with reproductive dysfunctions, including reduction of testicular weight and sperm count, alteration of hormone levels, and impairment of spermatogenesis (Jin et al., 2013; Pacchierotti et al., 2008; Sakaue et al., 2001; Tiwari and Vanage, 2013; Wang et al., 2016). Structural analogs of BPA have since been introduced into the market as BPA substitutes, sharing similar manufacturing applications to BPA. Emerging evidence indicates that BPA analogs had been found in food products and in human urine samples and these chemicals interacted with various physiological receptors (Driffield et al., 2008; Kitamura et al., 2005; Liao and Kannan, 2013; Liao et al., 2012; Stossi et al., 2014). However, the toxicological data concerning BPA analogs are still limited. In our previous study, we compared the spermatogonial toxicities of BPA with its analogs: bisphenol S (BPS), bisphenol AF (BPAF), and tetrabromobisphenol A (TBBPA) using the murine spermatogonial C18-4 cell line. We found that BPAF and TBBPA exhibited higher spermatogonial toxicities compared with BPA and BPS, including alterations in nuclear morphology, cell cycle, DNA damage response, and perturbation of the cytoskeleton (Liang et al., 2017). Although using a spermatogonial cell line provided mechanistic insights into the testicular toxicities of BPA and its analogs, it lacked the multicellular complexity and organ-like structures needed to mimic the physiological conditions as observed in vivo. Recently, we developed an in vitro testicular cell co-culture model, which exhibited a unique three-dimensional (3D) structure when compared with single-cell culture models (Yin et al., 2017). This testicular cell co-culture model was able to recapitulate the multicellular complexity and organ-like structure observed in vivo. It enabled the classification of reproductive toxic substances with high specificity and sensitivity (Yin et al., 2017). Therefore, the purpose of this study was to apply the testicular cell co-culture model to further examine the testicular toxicities of BPA and its analogs.
With the recent advances in automated fluorescence microscopy and quantitative image analysis, high-content analysis (HCA) enables the measurements of unbiased phenotypic multi-parametric endpoints at a single-cell level, and provides both temporal and spatial measurements of cellular biological phenotypes associated with adverse health outcomes (Buchser et al., 2004; Mattiazzi Usaj et al., 2016; Zanella et al., 2010). This approach has been used to characterize adverse outcome pathways and develop predictive models for toxicity evaluation (Elmore et al., 2014; Merrick et al., 2015; Ramm et al., 2019; Shukla et al., 2010). High-content analysis provides large-scale image-based data; however, the analysis of these image datasets becomes a major hindrance, as the quantification of these cellular phenotypes of interest has created a time- and labor-intensive environment with low reproducibility (Sommer and Gerlich, 2013). In addition, the variability of cell response is always present to some degree in any population of cells, and the endpoint response may not reflect the behaviors of any individual cell. This can especially occur when the population contains several phenotypically distinct subpopulations. Therefore, demand is increasing for an advanced computational approach to explore the inherent structure of multi-dimensional data and provide unbiased assessments of a variety of phenotypes. In response to this need, supervised machine learning (ML) has emerged as a powerful approach in classifying cellular heterogeneity using nonlinear multi-parametric algorithms on HCA data (Altschuler and Wu, 2010; Bray and Carpenter, 2018; Hennig et al., 2017; Sommer and Gerlich, 2013). These algorithms are able to learn from the trained datasets labeled with pre-defined phenotypic classes and automatically infer the rules used to classify the full dataset. This type of ML has been applied to examine the dynamic changes of the genome and proteome in single-cell imaging (Chong et al., 2015; Neumann et al., 2010); however, its applications in toxicology have not fully been explored. In this study, we applied the testicular cell co-culture model and employed an HCA-based single-cell analysis to compare the testicular toxicities of BPA and its analogs. We developed a ML-based HCA pipeline to examine the complex phenotypic changes associated with testicular toxicities. We found the dose- and time-dependent changes in a wide spectrum of adverse endpoints, including nuclear morphology, DNA synthesis, DNA damage, and cytoskeletal structure in a single-cell-based analysis. The co-cultured testicular cells were more sensitive than the C18-4 spermatogonial cells in response to BPA and its analogs (Liang et al., 2017). Unlike conventional population-averaged readouts such as the BrdU assay, the single-cell-based assay not only showed the overall changes of the averaged population, but also revealed changes in the sub-population. Machine learning-based phenotypic analysis revealed that treatment of BPA and its analogs resulted in the loss of spatial cytoskeletal structure, and an accumulation of M phase cells in a dose- and time-dependent manner. Treatment of BPAF induced multinucleated cells, which were associated with altered DNA damage response and impaired cellular actin filaments. Overall, we demonstrated a new and effective means to evaluate multiple toxic endpoints in the testicular cell co-culture model through the combination of ML and high-content phenotypic-based single-cell analysis, which can provide a rapid and objective high-throughput screening platform for future environmental toxicity testing.
MATERIALS AND METHODS
Chemicals
Dulbecco’s Modified Eagle Medium (DMEM), Modified Eagle’s Medium/Nutrient Mixture F-12 (DME/F12), horse serum, and penicillin-streptomycin were purchased from GE Healthcare Life Sciences (Logan, Utah). Fetal bovine serum (FBS), 4, 4′-(propane-2, 2-diyl) diphenol (BPA, ≥99%), 4, 4′-sulfonyldiphenol (BPS, 98%), 2, 2′, 6, 6′-Tetrabromo-4, 4′-isopropylidenediphenol (TBBPA, 97%), and neutral red (NR) were purchased from Sigma-Aldrich (St Louis, Missouri). Nu-Serum was purchased from BD BioScience (Redford, Massachusetts). 4-[1, 1, 1, 3, 3, 3-Hexafluoro-2-(4-hydroxyphenyl) propan-2-yl]phenol (BPAF, 98%) was purchased from Alfa Aesar (Ward Hill, Massachusetts). 5-Bromo-2′-deoxyuridine (BrdU, 99%) was purchased from Thermo Scientific (Waltham, Massachusetts). Paraformaldehyde (4%) was purchased from Boston Bioproducts (Ashland, Massachusetts).
Establishment of testicular cell co-culture model and treatment
The testicular cell co-culture model was established as reported previously (Yin et al., 2017). Mouse spermatogonial cell line C18 was established via germ cells isolated from the testes of 6-day-old Balb/c mice (Hofmann et al., 2005a,b). This cell line was selected as it showed morphological features of type A spermatogonia; expressed testicular germ cell-specific genes such as GFRA1, Dazl, and Ret and stem cell-specific genes such as Piwi12 and Prame11 (Hofmann et al., 2005a). Mouse Leydig (TM3) and Sertoli (TM4) cell lines were purchased from ATCC, and these cells were isolated from prepubertal mouse gonads. C18 cells were maintained in DMEM composed of 5% FBS, and 100 U/ml streptomycin and penicillin in a 33°C, 5% CO2 humidified environment in a sub-confluent condition, and were passaged every 3–4 days; TM3 and TM4 cells were cultured in DME/F12 composed of 1.25% FBS, 2.5% horse serum, and 100 U/ml streptomycin and penicillin at 37°C, 5% CO2 in a sub-confluent condition, and were passaged every 2–3 days. When the cells reached 70%–80% confluency, a total of 1.5 × 10⁴ cells per well were inoculated into a 96-well plate. The percentages of spermatogonial, Sertoli, and Leydig cells in the co-culture model were 80%, 15%, and 5%, respectively. The co-cultures were maintained in DMEM composed of 2.5% Nu-serum, in a 33°C, 5% CO2 humidified environment. After overnight incubation, the co-cultures reached 100% confluency and were then treated with BPA, BPS, BPAF, and TBBPA at the indicated doses and time-periods.
Cell viability with NR uptake assay
Cell viability was determined with the NR uptake assay to find the suitable dose range for the HCA. The NR uptake assay is based on the ability of viable cells to incorporate NR dye into their lysosomes, whereas leaving the dead cells unstained (Repetto et al., 2008). The co-cultured cells were treated with various doses of BPA or BPS (25, 50, 100, 200, and 400 μM) and BPAF or TBBPA (2.5, 5, 10, 25, and 50 μM) for 24, 48, and 72 h; 0.01% DMSO was set as the vehicle control. About 3 h prior to the indicated treatment time, the culture medium was replaced by fresh medium containing NR (50 μg/ml) followed by washing with phosphate-buffered saline (PBS). The NR dye was eluted with 100 μl of a 0.5% acetic acid/50% ethanol solution. The plate was then gently shaken, and absorbance values were measured at 540 nm with a Synergy HT microplate reader (Tecan, Sunrise). Cell viability was presented as a percentage of the mean of vehicle controls after subtracting background readings.
High-content assays
High-content assays, including nuclear morphology, cell cycle, DNA damage responses, and perturbation of the cytoskeleton were established as previously described (Liang et al., 2017). Co-cultures were treated with various doses of BPA or BPS (5, 10, 25, 50, and 100 μM) and BPAF or TBBPA (1, 2.5, 5, 10, and 15 μM) for 24, 48, and 72 h. The cells were then permeabilized by a 0.1% Triton X-100/PBS and blocked and then incubated with a mouse anti-phospho-histone H2AX (Ser139) (γ-H2AX) overnight at 4°C. After the cells were washed with PBS, they were then incubated with goat anti-mouse Dylight 650 and Hoechst 33342. Prior to image acquisition, the cells were stained with Alexa Fluor 488 Phalloidin for 30 min to highlight F-actin filaments (Liang et al., 2017). Multi-channel images were then automatically acquired using an ArrayScan VTI HCS reader upgraded with LED Light Engine Module and the HCS Studio 2.0 software (Thermo Scientific). About 36 fields (images) per well per channel were acquired at ×20 magnification using a Hamamatsu ROCA-ER digital camera in combination with a ×0.63 coupler and Carl Zeiss microscope optics in auto-focus mode. Channel 1 (Ch1) was used to detect Hoechst (BGRFR 384_15), channel 2 (Ch2; BGRFR 485_20) was used to detect F-actin, and channel 3 (Ch3; BGRFR 650_13) was used to detect the γ-H2AX. For DNA synthesis high-content assay, we employed the thymidine analog BrdU incorporation assay to evaluate the DNA synthesis. BrdU staining procedure followed the previous protocol (Liang et al., 2017). Two-channel staining for the BrdU assay was applied, Ch1 was used to detect Hoechst (BGRFR 384_15) and Ch2 (BGRFR 549_15) was used to detect the BrdU.
High-content image analysis
Multi-channel images were analyzed using HCS Studio 2.0 Target Activation BioApplication. Using the Hoechst staining channel (Ch1), the nuclear boundary of each cell was defined by segmentation (Figure 3B). Segmentation uses local changes in pixel intensity, as well as the shape of the object, to find the border region. Then primary object identification used a smoothing uniform value of 1, and a thresholding isodat value at −0.87. Objects located on the border were excluded. The resulting definition of the border and object contained within is called a mask. The mask for the Hoechst channel was designated as a region of interest. Channel 2 applied BGRFR 485_20 to identify the F-actin staining with a primary object mask modification factor of 12. BGRFR 650_13 was applied in Ch3 and identified the γ-H2AX staining with a primary object mask modification factor of 0. Multiple parameters of nuclei were quantified for each cell, including nuclei number, nuclear area, shape, and total intensity. Nuclear shape measurements included: nuclear smoothness, P2A, a parameter defined as the ratio of nuclear perimeter squared to 4π × nuclear area (perimeter2/4π × nuclear area) and nuclear roundness, LWR, a parameter defined as the ratio of nuclear length to width. For a fairly round and smooth object, the values for P2A and LWR were around 1.0. The total intensity was defined as the total pixel intensity within a cell in the respective channel. The total and average intensities of BrdU, γ-H2AX, and F-actin of the individual cells were quantified. With 36 images per well, at least 5000 cells were analyzed, and single-cell-based data were extracted for further nuclear morphology, DNA synthesis, DNA damage response, and cytoskeletal analysis. The experiments were performed with at least 4 biological replicates and repeated twice.
Figure 3.
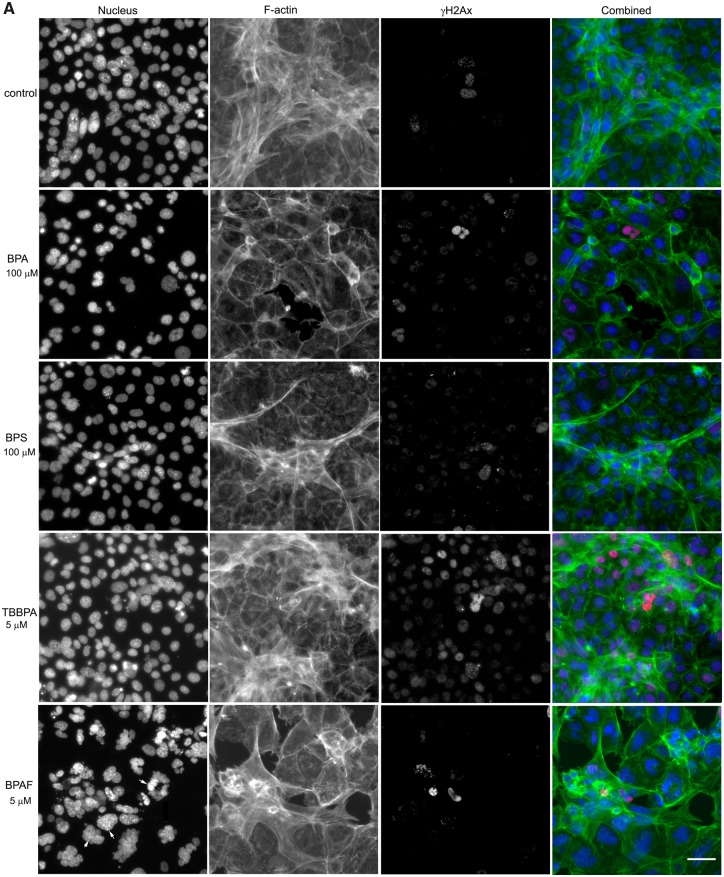
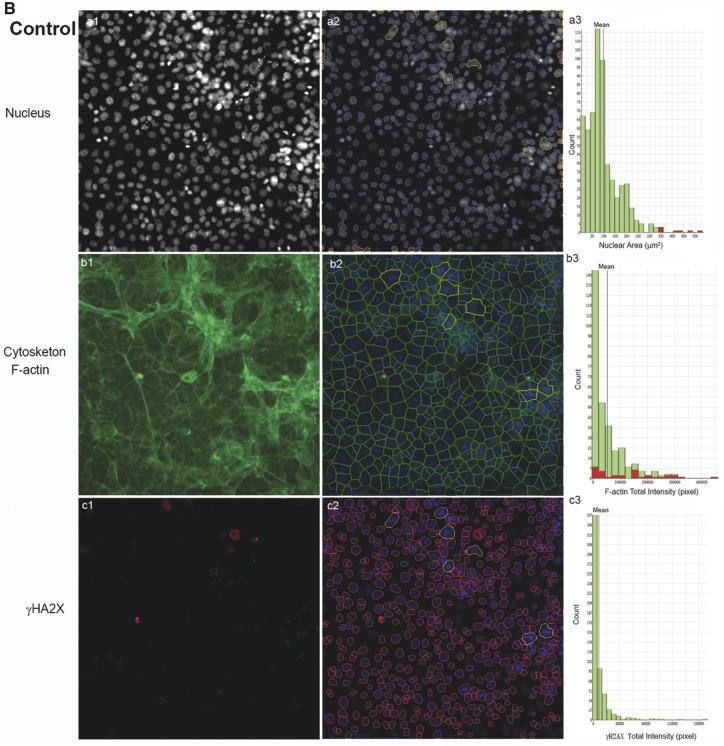
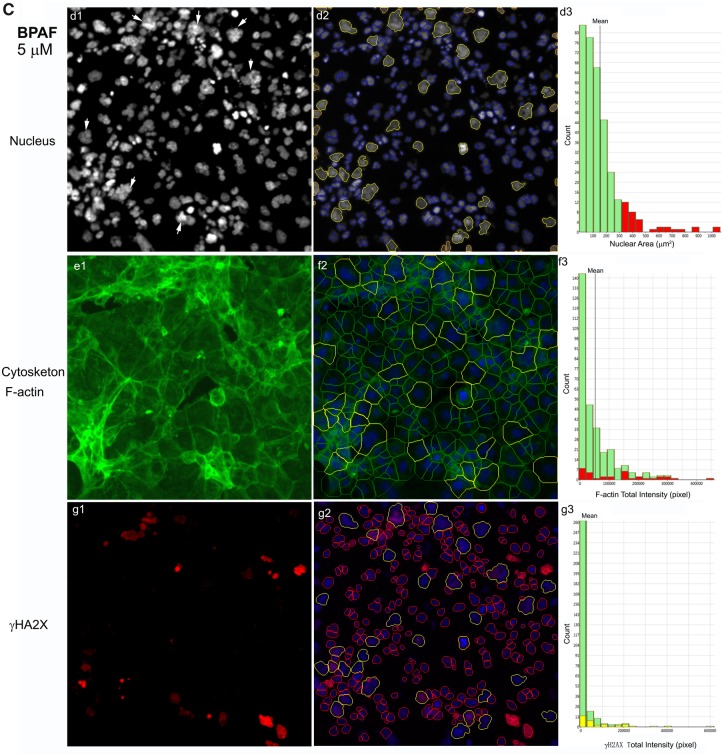
Bisphenol A and its analogs altered nuclear morphology, perturbed F-actin cytoskeleton, and induced DNA damage marker γ-H2AX in the testicular cell co-culture model. Representative images from 3-channel high-content (A) and quantification of nuclear morphology, cytoskeletal F-actin, and DNA damage marker γH2AX in control (B) and BPAF- (5 µM) treated cells (C) at 72 h (×40). The co-cultures were treated with various concentrations of BPA and BPS (5, 10, 25, 50, and 100 μM) and BPAF and TBBPA (1, 2.5, 5, 10, and 15 μM) for 24, 48, and 72 h. Cells treated with vehicle (0.01% DMSO) were used as controls (0 μM). The nuclei were stained with Hoechst 33342, F-actin cytoskeleton stained with Alexa Fluor 488 Phalloidin, and DNA damage marker with phosphor-histone γH2AX (Ser139, γ-H2AX). Images were automatically acquired using ArrayScan VTI HCS with ×40 objective lenses and 49 fields per well were obtained. Using the HCS Studio 2.0 TargetActivation BioApplication, segmentation, and primary object identification were conducted in Ch1. Images in Ch2 were used to identify the F-actin staining with a primary object mask modification factor of 12. Images in Ch3 were used to identify γ-H2AX staining with a primary object mask modification factor of 0. Multiple parameters of nuclei, F-actin, and γ-H2AX were quantified, including nuclei number, nuclear area, shape (P2A, LWR), and total or average intensity of DNA, F-actin, and γ-H2AX for each cell. Cells with nuclear area larger than 350 µm2 were selected in Ch1 (red bar and yellow outline), and these cells were also highlighted in Ch2 (red bar and yellow outline), and 3 (yellow bar and yellow outline). Arrows indicated the multinucleated cells. Scale bar = 50 μm. Abbreviations: BPA, bisphenol A; BPAF, bisphenol AF; BPS, bisphenol S; TBBPA, tetrabromobisphenol A.
ML-based HCA
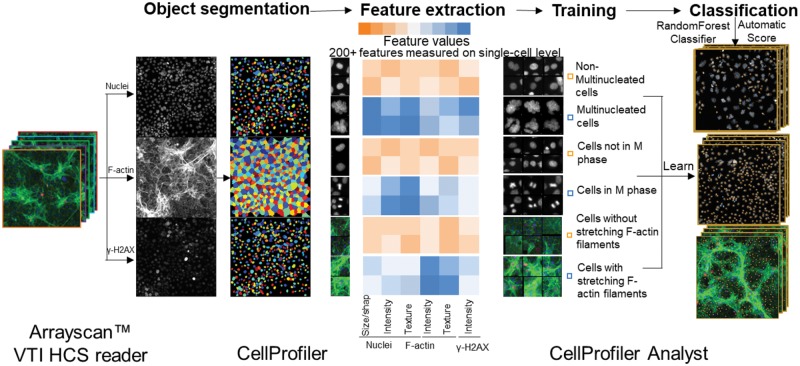
Quantification of large-scale image data and analysis of cellular phenotypes used to depend on manual parameter adjustment, which is time and labor intensive with low reproducibility among different experiments (Sommer and Gerlich, 2013). In addition to the use of the HCS Studio 2.0 software for quantification, we utilized an open-source software CellProfiler and CellProfiler Analyst (Broad Institute, Cambridge, Massachusetts) (Bray and Carpenter, 2018; Carpenter et al., 2006; McQuin et al., 2018) and developed a ML-based HCA pipeline to examine the morphological, phenotypic alterations in the cytoskeleton and nucleus (Figure 1). The multi-channel images acquired from the ArrayScan VTI HCS reader were imported into CellProfiler. Our processing pipeline included object identification and segmentation on multi-channel images (nuclei, cytoskeleton, and γ-H2AX). This pipeline identified the nuclei from the Hoechst 33342 (nuclei) channel and used the nuclei as a primary object to assist in the identification of secondary objects, which included F-actin and γ-H2AX of each cell. This pipeline measured over 200 cellular features, including the size, shape, intensity, texture of the nuclei, intensity, and texture of F-actin and γ-H2AX in each cell (Figure 1). These quantified data, along with the images, were imported into the CellProfiler Analyst, and a supervised ML was performed via the “Random Forest Classifier” algorithm (Broad Institute) (Breiman, 2001; Jones et al., 2008). The supervised training with specific phenotypes, including cytoskeletal changes, multi-nucleation, and mitosis, was conducted until the values of positive and negative recognition for each phenotype reached 99% and 0.01%, respectively. Finally, these classification rules inferred from the training set were applied to score all cells in the experiment.
Figure 1.
Machine learning-based high-content and phenotypic analysis in the testicular cell co-culture. The diagram illustrates the 4 steps of the ML process. First, object identification and segmentation were conducted on multi-channel images (nuclei, cytoskeleton, and γ-H2AX) using CellProfiler. Second, these quantified data, along with the images, were imported into the CellProfiler Analyst and a supervised ML was performed via the “Random Forest Classifier” algorithm (Broad Institute; Breiman, 2001; Jones, et al., 2008). The supervised training with specific phenotypes, including cytoskeletal changes, multi-nucleation, and mitosis was conducted until the values of positive and negative recognition for each phenotype reached 99% and 0.01%, respectively. Finally, these classification rules inferred from the training-set were applied to score all cells in the experiment.
Both image processing workflows were executed on a desktop Windows 10 workstation installed with GeForce GTX 1080 Ti Graphics Cards and 32 GB RAM. Software versions used were CellProfiler version 2.1.2 v2015_08_05, CellProfiler Analyst 2.0 v2014_04_01. Links to Windows binary versions of these are provided here: http://www.cellprofiler.org/published_pipelines.shtml)
Statistical analysis
The data obtained from the HCS Studio 2.0 Target Activation BioApplication, CellProfiler, and CellProfiler Analyst were exported and further analyzed using the JMP statistical analysis package (SAS Institute, Cary, North Carolina). In order to remove the cell clumps, nuclei with areas larger than 1000 μm2 were excluded. In each plate, the vehicle controls showed consistent measurements for all endpoints examined. To account for intra-plate normalization, data were normalized to the overall scaling factors, which were calculated by obtaining the geometric mean of the vehicle controls in each plate. The data extracted from the single-cell-based image represented the phenotype of a single cell, and were geometrically averaged for each well for a traditional well-based statistical analysis. BrdU-positive cells were identified as having a total intensity of BrdU over 20 000 pixels. γ-H2AX positive cells were identified in the control cells by the total intensity of γ-H2AX over 120 000 pixels. The median lethal concentrations (LC50) were calculated using a nonlinear regression curve fit on GraphPad Prism 5 (San Diego, California). A Spearman correlation analysis was conducted in order to examine the correlation between the cytoskeleton perturbations and DNA damage responses in multinucleated cells, as well as to examine any relationship between the total intensity of F-actin and γ-H2AX for 24, 48, and 72 h using single-cell-based data. The data were presented as mean ± standard deviation (SD). One-way analysis of variance (ANOVA) followed by Tukey-Kramer all pairs comparisons were conducted to assess statistical significance. A p-value of less than .05 denoted a significant difference compared with vehicle control (*).
RESULTS
BPA and Its Analogs Induced Time- and Dose-Dependent Cytotoxicity in the Testicular Cell Co-culture Model
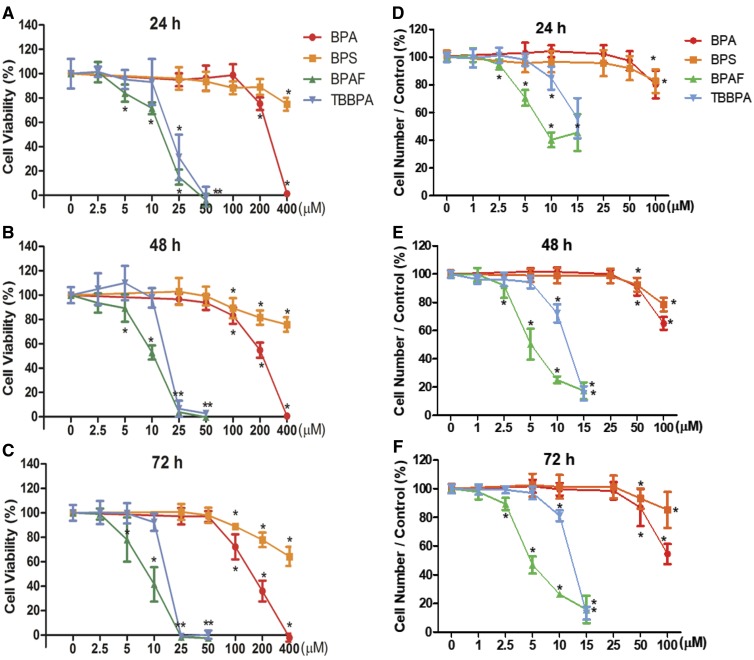
Cell viability was measured by the NR uptake assay to obtain the appropriate concentrations of BPA and its analogs to be used for HCA in the co-culture model. Figures 2A–C show a time- and dose-dependent decrease in cell viability in the co-culture model after treatment of BPA or its analogs for 24 (A), 48 (B), and 72 h (C). Bisphenol A and BPS treatments significantly decreased cell viability starting at doses of 200 and 400 μM for 24 h, and at 100 μM for 48 and 72 h, respectively. Bisphenol AF and TBBPA significantly reduced cell viability at concentrations of 5 and 25 μM, respectively, across the 3 time-points. The LC50 values calculated at 72 h were 8.5, 16.8, 150.2, and 625.8 μM for BPAF, TBBPA, BPA, and BPS, respectively. Therefore, 100 μM was selected as the highest treatment dose for BPA and BPS, and 15 μM was selected as the highest treatment dose for BPAF and TBBPA to be used in the HCA experiments that followed.
Figure 2.
Cell viability determined by NR uptake assay (A–C) and cell number determined by the HCA (D–F) in the testicular cell co-cultures treated with BPA, BPS, BPAF, and TBBPA. Testicular cells co-cultures were treated with various concentrations of BPA and BPS (25, 50, 100, 200, and 400 μM), and BPAF and TBBPA (2.5, 5, 10, 25, and 50 μM) for 24 (A, D), 48 (B, E), and 72 h (C, F). Cells treated with the vehicle (0.05% DMSO) were used as vehicle controls (0 μM). Neutral red assay and HCA-based quantification of cell viability and cell number were described in Materials and Methods. Data were expressed as mean ± SD, n = 8. Four replicates in 2 independent experiments were included. Statistical analysis was conducted by 2-way ANOVA followed by Tukey-Kramer multiple comparisons (*p < .05, ** p < .01). Abbreviations: BPA, bisphenol A; BPAF, bisphenol AF; BPS, bisphenol S; TBBPA, tetrabromobisphenol A; HCA, high-content analysis.
Applying HCA analysis, the total number of cells in each well was quantified by nuclear staining with Hoechst dye in the 36 fields captured at ×20 magnification. As depicted in Figures 2D–F, BPA and BPS treatments significantly reduced cell number at a dose of 100 μM at 24 h and doses of 50 and 100 μM at 48 and 72 h, respectively. Bisphenol AF treatment decreased cell number starting at a concentration of 2.5 μM across the 3 time-points, whereas TBBPA reduced cell number at 10 μM for all 3 time-points. The LC50 values calculated at 72 h were 4.9, 12.5, 104.2, and 550.4 μM for BPAF, TBBPA, BPA, and BPS, respectively. As compared with the dose- and time-dependent responses in the NR uptake assay, the cell number obtained through the HCA assay was more sensitive than the traditional NR uptake cytotoxicity assay.
BPA and Its Analogs Altered Nuclear Morphology in the Testicular Cell Co-culture Model
Figure 3A shows representative 3-channel HCA images at ×40 magnification, including nuclear morphology, cytoskeletal F-actin, and DNA damage marker γH2AX at 72 h. Noticeable decreases of cell density, disruption of the cytoskeleton, and induction of γH2AX were observed in the higher doses of BPA or its analogs.
The shape and size of the nucleus varied between the control and treatment groups (Figure 3A). One noticeable change was the multinucleation (denoted by an arrow) in BPAF-treated cells; this was mainly observed at a dose of 5 μM (Figure 3A, arrowhead). The geometry of the nucleus influences the DNA organization and has a significant influence on cell proliferation, gene expression, and protein synthesis (Jevtic et al., 2014; Mukherjee et al., 2016). Nuclear morphology was found to be a sensitive endpoint for the detection of chemical toxicity in HCA assays (Martin et al., 2014; O’Brien et al., 2006; Ramm et al., 2019). Using HCS Studio 2.0 TargetActivation BioApplication, multiple parameters of the nuclei including number, nuclear area, shape (P2A and LWR), total DNA intensity, cytoskeletal F-actin, and DNA damage marker γH2AX were quantified for each cell (Figure 3). Figures 3B–C illustrate the segmentation and identification of the primary object nucleus in Ch1, secondary objects F-actin cytoskeleton in Ch2, and γH2AX in Ch3 using the TargetActivation BioApplication in control (Figure 3B) and BPAF-treated cells (Figure 3C) at 48 h. Nuclear number, shape (P2A, LWR), total and average intensity of DNA, DNA intensity variance per cell in Ch1, total or average intensity, and the variance of the intensity of F-actin and γH2AX in Ch2 and Ch3 were quantified. The right sides of Figures 3B–C show the distribution of the nuclear area, along with the total intensity of F-actin and γH2AX in 1 field image. Cells with a nuclear area larger than 350 µm2 in control are highlighted. Irregular shape of nuclei in the BPAF-treated cells at 5 µM (Figure 3C), along with the larger size of these nuclei (highlighted), was observed. These irregular multi-nucleated cells had less staining of F-actin surrounding them, and also had low levels of γH2AX.
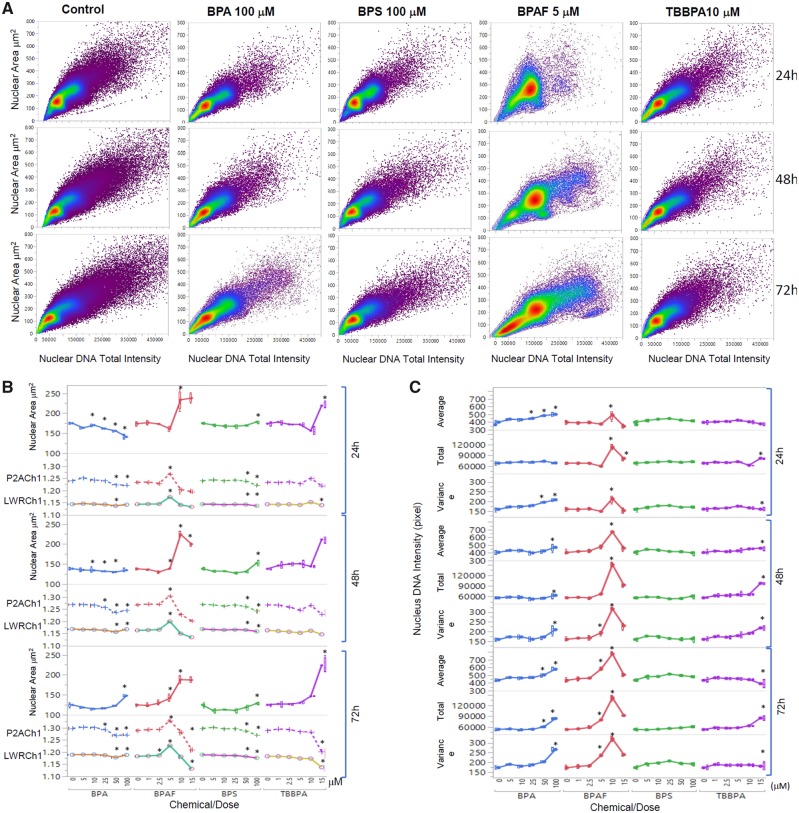
Figure 4A shows a scatterplot of the nuclear area versus the total intensity of nuclear DNA in the control cells, cells treated with BPA and BPS at 100 µM, and cells treated with BPAF and TBBPA at 5 µM at 24, 48, and 72 h. Heterogenicity of these cells regarding size and intensity in control and treatments was observed (Figure 4A). Treatment of all 4 chemicals induced notable decreases in cell number and changes of the cell population at the highest concentrations tested (Figure 4A). The single-cell-based data extracted from the 36 images per well were averaged for a traditional well-based statistical analysis. Due to the non-normal distribution of these individual parameters from the individual cells, fields, and wells, we calculated the well-based geometric mean and used ANOVA to compare the statistical difference among the treatments and doses. Figures 4B and 4C show the geometric mean of the nuclear morphological parameters in the co-culture treated with BPA and its analogs across the 3 time-points. Treatment of BPA at 25 μM or over significantly decreased the nuclear area at 24 h, and increased the nuclear area at 100 µM at 48 h, and at 50 and 100 µM at 72 h. Bisphenol S treatment at a dose of 100 μM increased the nuclear area only at 72 h. Bisphenol A treatment significantly increased the LWR at 100 μM and reduced P2A at doses of 50 and 100 μM for all 3 time-points. Treatment with 100 μM BPS significantly decreased LWR and P2A across all 3 time-points. Significant increases in the nuclear area were observed in the cells treated with BPAF at 10 and 15 μM at 24 h, and 5–15 μM at 48 h and 72 h. Bisphenol AF induced significant increases in LWR and P2A at 5 μM at all time-points whereas inducing decreased LWR and P2A at 10 and 15 μM at all time-points. Tetrabromobisphenol A induced significant increases in the nuclear area at 15 μM at 24 and 48 h, and at 10 and 15 μM at 72 h. Tetrabromobisphenol A treatment was observed to significantly increase P2A at 10 μM at 24 and 48 h, whereas LWR decreased at 15 μM at 72 h (Figure 4B). As shown in Figure 4C, dose- and time-dependent changes of nuclear DNA intensity, including average or total DNA intensity and variance of DNA intensity at 24, 48, and 72 h were observed after exposure to BPA, BPAF, and TBBPA, but no change in BPS treatment. Treatment of BPA at 25 μM or more significantly increased the average nuclear DNA intensity at 24 h, and increased the average nuclear DNA intensity at 100 µM at 48 h, and at 25, 50, and 100 µM at 72 h. Significant increases in the average, total, and variance of nuclear DNA intensity were observed in the cells treated with BPAF at 10 µM at 24 and 48 h. At 72 h treatment with BPAF, significant increases in the average, total, and variance of nuclear DNA intensity were observed at 5 and 10 µM (Figure 4C).
Figure 4.
High-content image-based quantification of nuclear morphology. Scatterplot of the nuclear area and total DNA intensity (A). Dose- and time-dependent changes of nuclear area, nuclear roundness LWRCh1, and nuclear smoothness P2ACh1 at 24, 48, and 72 h after exposure were shown in (B). Dose- and time-dependent changes of DNA contents, including total DNA intensity and variance of DNA intensity at 24, 48, and 72 h after exposure were shown in (C). Data were presented as geometric mean ± SD of the well, n = 8. Four replicates in 2 independent experiments were included. Statistical analysis was conducted by 2-way ANOVA followed by Tukey-Kramer multiple comparisons (*p < .05, ** p < .01).
BPA and Its Analogs Perturbed F-actin Cytoskeleton and Induced DNA Damage Marker γ-H2AX in the Testicular Cell Co-culture Model
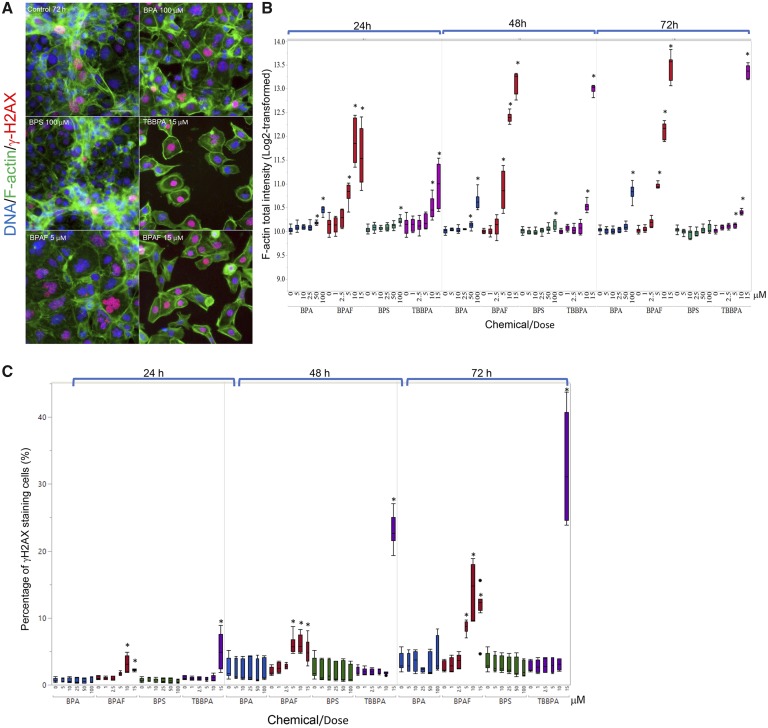
Cytoskeletal structures are involved in various cellular processes, including the remodeling of germ cell nuclei, reduction of the cytoplasm, and cell movement during spermatogenesis (Niedenberger et al., 2013). In Sertoli cells, parallel F-actin bundles form the ectoplasmic specialization (ES), providing an immunological barrier for germ cells, regulating the orientation of the elongated spermatids, and helping spermatozoa release (Cheng and Mruk, 2002; Setchell, 2008; Wong et al., 2008). As illustrated in Figure 5A, F-actin filaments in the untreated co-culture exhibited 2 typical patterns: stretched cortical actin filaments adjacent to the cell edge, and thicker stress fiber bundles located throughout the cytosol. Cells with stretching F-actin bundles in their cytoplasm formed unique cord-like structures throughout the co-culture model in control (Figure 5A). Treatments of BPA, BPAF, and TBBPA perturbed these structures and induced a gel-like network of cross-branched F-actin filaments, whereas treatment of BPS induced no notable changes of cytoskeletal structure (Figure 5A). Figure 5B illustrated the quantification of a well-based analysis of the total intensity of F-actin derived from individual cells. Significant increases in the total intensity of F-actin were observed in the co-culture treated with 50 μM BPA at 24 h, and 100 μM BPA at 48 and 72 h; 100 μM BPS at 24 and 48 h; 5, 10, and 15 μM BPAF at 24, 48, and 72 h; 10 and 15 μM TBBPA for 24 and 48 h, and 5–15 μM TBBPA at 72 h. An early DNA damage response marker, γ-H2AX, was also measured to assess the genotoxicity of BPA and its analogs in the co-culture. Figure 5C depicts the percentages of γ-H2AX positive cells. We observed a significant increase of γ-H2AX positive cells after BPAF treatment at doses of 10 and 15 μM for 24 h, and 5–15 μM for 48 and 72 h; TBBPA exhibited similar effects at 15 μM across the 3 time-points. Bisphenol A and BPS treatment elicited no notable changes in the percentages of γ-H2AX positive cells.
Figure 5.
Characteristic changes of cytoskeletal F-actin and DNA damage marker γ-H2AX in the testicular cell co-culture treated with BPA, BPS, BPAF, and TBBPA. Co-cultures were treated with various concentrations of BPA and BPS (5, 10, 25, 50, and 100 μM) and BPAF and TBBPA (1, 2.5, 5, 10, and 15 μM) for 24, 48, and 72 h. Cells treated with vehicle (0.01% DMSO) were used as negative controls (0 μM). The nuclei were stained with Hoechst 33342 (blue), F-actin with Phalloidin staining (green), and γ-H2AX with a combination of primary anti-γ-H2AX and secondary Dylight 650 conjugated antibody (red). Representative images (×40) of co-culture treated with BPA and BPS (100 μM), BPAF (5 and 15 μM), and TBBPA (15 μM) for 48 h were shown in A. The quantification of log-transformed F-actin total intensity and percentage of positive γ-H2AX were shown in (B) and (C), respectively. Data were presented as geometric mean ± SD of the well, n = 8. Four replicates in 2 independent experiments were included. Statistical analysis was conducted by 2-way ANOVA followed by Tukey-Kramer multiple comparisons (*p < .05, ** p < .01). Scale bar = 50 μm. Abbreviations: BPA, bisphenol A; BPAF, bisphenol AF; BPS, bisphenol S; TBBPA, tetrabromobisphenol A.
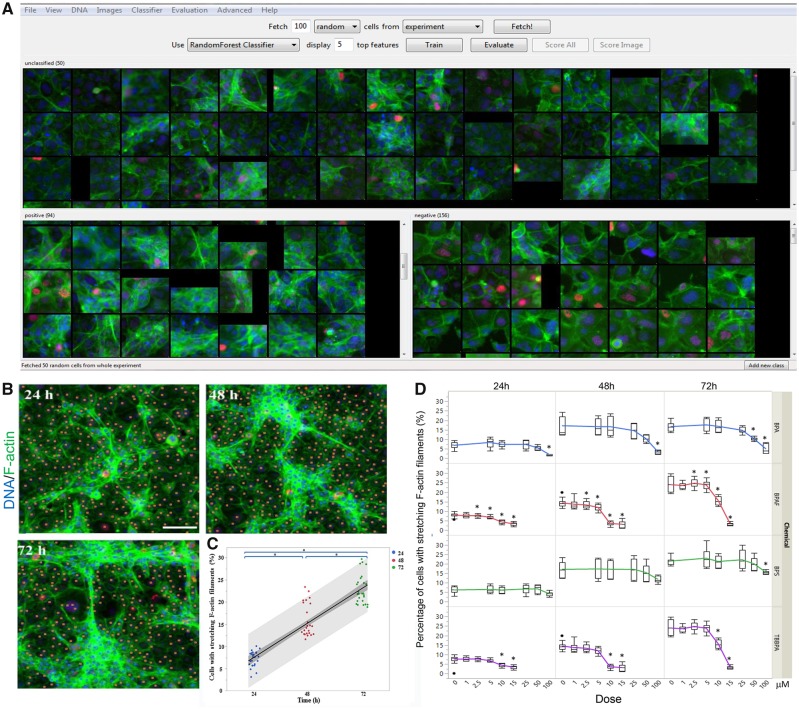
However, the intensity-based measurement of F-actin could not reflect all changes observed, such as the diminishment of inter-cellular stretching cytoskeletal structures in the BPAF-treated cells. In order to quantify this morphological, phenotypic alteration of the co-culture, and evaluate these phenotypic cytoskeletal changes, we applied a supervised ML approach with CellProfiler Analyst (Figs. 6A–C). Using the RandomForest algorithm, a random sampling of cells from the pool of all data were classified into 2 categories—cells with stretching F-actin were labeled as positive, and cells without stretching F-actin were labeled as negative—and repeated supervised training was conducted until the values of positive and negative recognition reached 99% and 0.01%, respectively (Figure 6A). As depicted in Figure 6B, time-dependent increases of inter-cellular stretching F-actin were observed in controls from 24 to 72 h, indicating that the formation of the 3D F-actin structure from 24 to 72 h was evident in our co-culture model. As illustrated in Figure 6D, significant decreases of this F-actin structural phenotype were observed in the co-culture treated with BPA at a dose of 100 μM at 24 h, and 50 and 100 μM at 48 and 72 h; BPS at a dose of 100 μM at 72 h; BPAF at doses of 2.5, 5, 10, and 15 μM at 24 and 48 h, and 5, 10, and 15 μM at 72 h. Tetrabromobisphenol A induced these decreases at doses of 10 and 15 μM across all 3 time-points.
Figure 6.
Supervised ML-based approach to quantify cells with stretching F-actin filaments in the testicular cell co-culture after treatment with BPA, BPS, BPAF, and TBBPA. Using the RandomForest algorithm in the CellProfiler Analyst, the cells were classified into 2 categories, cells with stretching F-actin as positive and cells without stretching F-actin as negative. Repeated supervised training was conducted until the values of positive and negative recognition reached 99% and 0.01%, respectively (A). Finally, these classification rules inferred from the training set were applied to score all cells in the experiment. Cells with stretching F-actin filaments were automatically recognized and labeled with blue coloring (B). Cells without stretching F-actin filaments are labeled with orange coloring. The percentage change of cells with stretching F-actin filaments in testicular cell co-culture from 24 to 72 h was shown in (C). Linear regression fit across multiple doses was performed. The shaded area indicates 95% confidence. The dose-time dependent changes of cells with or without stretching F-actin filaments were shown in (D). Data were presented as mean ± SD, n = 8. Four replicates in 2 independent experiments were included. Statistical analysis was conducted by 2-way ANOVA followed by Tukey-Kramer multiple comparisons (*p < .05, **p < .01). Abbreviations: BPA, bisphenol A; BPAF, bisphenol AF; BPS, bisphenol S; TBBPA, tetrabromobisphenol A; ML, machine learning.
BPA and Its Analogs Induced Mitotic M Phase Arrest, Disrupted DNA Synthesis, and Induced DNA Damage in the Testicular Cell Co-culture Model
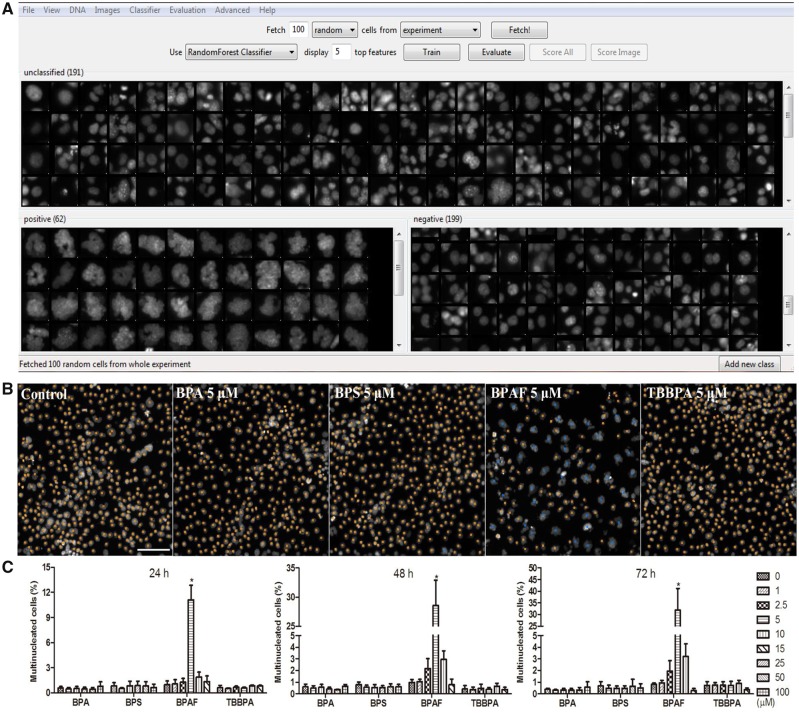
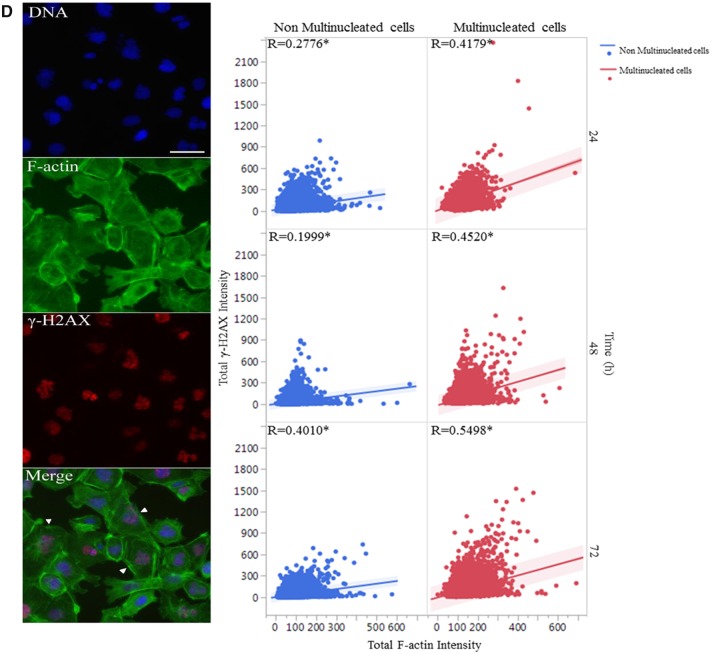
Morphological observation revealed that BPAF treatment-induced multinucleated cells (Figure 3A). We applied a supervised ML approach to quantify multinucleated cells (Figure 7). Using the RandomForest algorithm, a random sample of cells were classified into 2 categories, positive being multi-nucleated cells and negative being a single nucleated cell (Figure 7A), and then the classification rules inferred from the training set were applied to score all cells in the experiment (Figure 7B). As shown in Figure 7C, BPAF treatment significantly induced multinucleated cells at 5 μM at 24, 48, and 72 h, whereas BPA, BPS, and TBBPA treatments did not induce significant increases of multinucleated cells. Using Spearman correlation analysis, we examined the association of multinucleation with DNA damage responses and F-actin (Figure 7D). Figure 7D showed a higher positive correlation between total F-actin and γ-H2AX intensity observed in the multinucleated cells, as compared with those in non-multinucleated cells treated with BPAF at 5 μM at 24, 48, and 72 h. Thus, this data suggested that cytoskeleton perturbation might co-occur with DNA damage in the multinucleated cells.
Figure 7.
Supervised ML-based approach to quantify multinucleated cells in the testicular cell co-culture after treatment with BPA, BPS, BPAF, and TBBPA. Using the RandomForest algorithm in Cellprofiler Analyst, the cells classified into 2 categories, multi-nucleated cells as positive and single nucleated cell as negative (A). Repeated supervised training was conducted until the values of positive and negative recognition reached 99% and 0.01%, respectively. Finally, these classification rules inferred from the training set were applied to score all cells in the experiment and multi-nucleated cells were automatically recognized and labeled with blue coloring and nonmultinucleation cells were labeled with orange coloring (B). Dose and temporal changes of the percentage changes of multinucleated cells in testicular cell co-cultures were shown in (C). Comparison between multinucleated cells and nonmultinucleated cells on the total intensity of γH2Ax and total intensity of F-actin was shown in (D). Spearman correlation analysis was used to examine correlations between DNA damage marker γH2AX and F-actin. Data were presented as mean ± SD, n = 8. Four replicates in 2 independent experiments were included. Statistical analysis was conducted by 2-way ANOVA followed by Tukey-Kramer multiple comparisons (*p < .05, **p < .01). Abbreviations: BPA, bisphenol A; BPAF, bisphenol AF; BPS, bisphenol S; TBBPA, tetrabromobisphenol A; ML, machine learning.
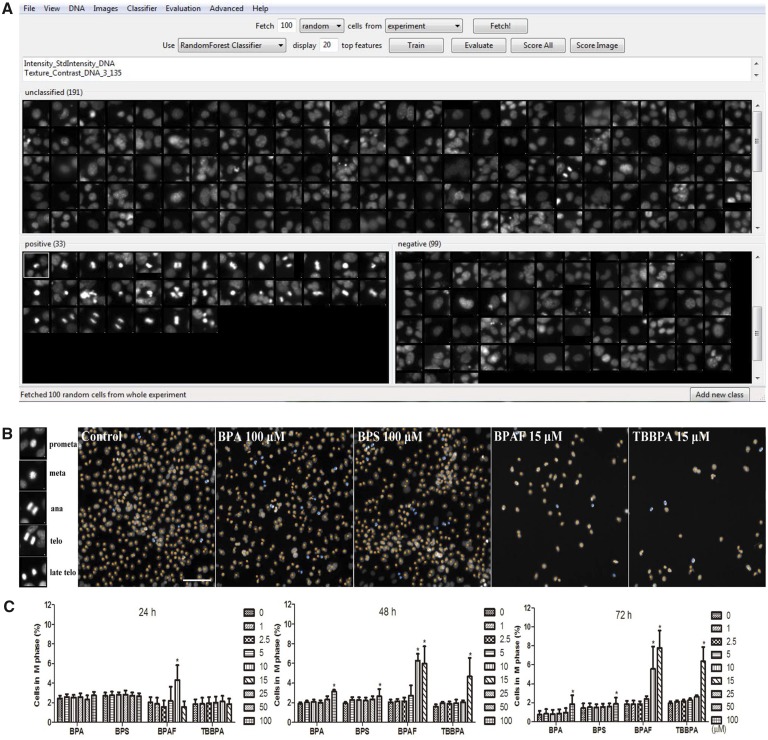
In order to examine the effects of BPA and its analogs on proliferation and mitotic progression, we further applied a supervised ML approach to evaluate various phenotypic features associated with M phase (Figure 8). These mitotic phenotypic features, including nuclei in pro-metaphase (pro meta), metaphase (meta), anaphase (ana), telophase (telo), and late-telophase (late-telo), were categorized as positive in the ML training. As shown in Figure 8C, BPA and BPS induced significant increases of cells in M phase starting at 100 μM at 48 and 72 h; BPAF at 10 μM at 24 and 48 h, and 15 μM at 72 h; and TBBPA at 15 μM across all 3 time-points. These data suggest that BPA and its analogs induced M-phase arrest in the testicular cell co-culture model.
Figure 8.
Supervised ML-based approach to evaluate various phenotypic features associated with M phase in the testicular cell co-culture after treatment with BPA, BPS, BPAF, and TBBPA. Using CellProfiler Analyst, these mitotic phenotypic features including nuclei in pro-metaphase (pro meta), metaphase (meta), anaphase (ana), telophase (telo), and late-telophase (late-telo) were categorized as positive in the ML training (A). Repeated supervised training was conducted until the values of positive and negative recognition reached 99% and 0.01%, respectively. Finally, these classification rules inferred from the training set were applied to score all cells in the experiment and cells in M phase were automatically recognized and labeled with blue coloring and non-M phase cells were labeled with orange coloring (B). Dose and temporal changes of the percentage changes of M phase cells were shown in (C). Data were presented as mean ± SD, n = 8. Four replicates in 2 independent experiments were included. Statistical analysis was conducted by 2-way ANOVA followed by Tukey-Kramer multiple comparisons (*p < .05, **p < .01). Abbreviations: BPA, bisphenol A; BPAF, bisphenol AF; BPS, bisphenol S; TBBPA, tetrabromobisphenol A; ML, machine learning.
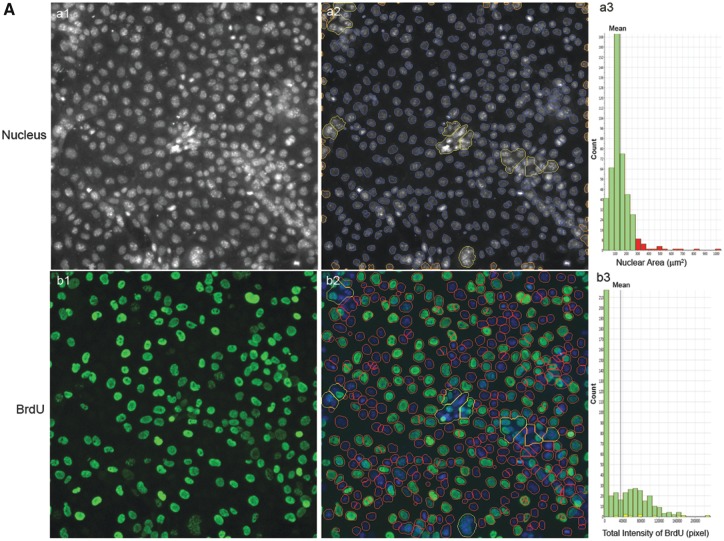
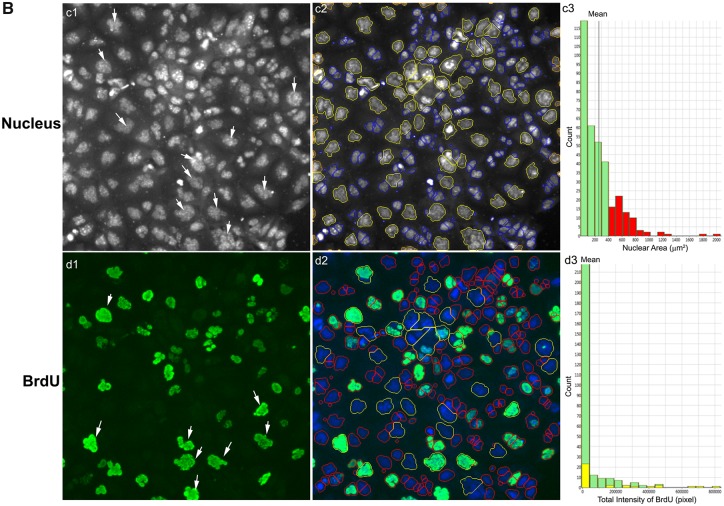
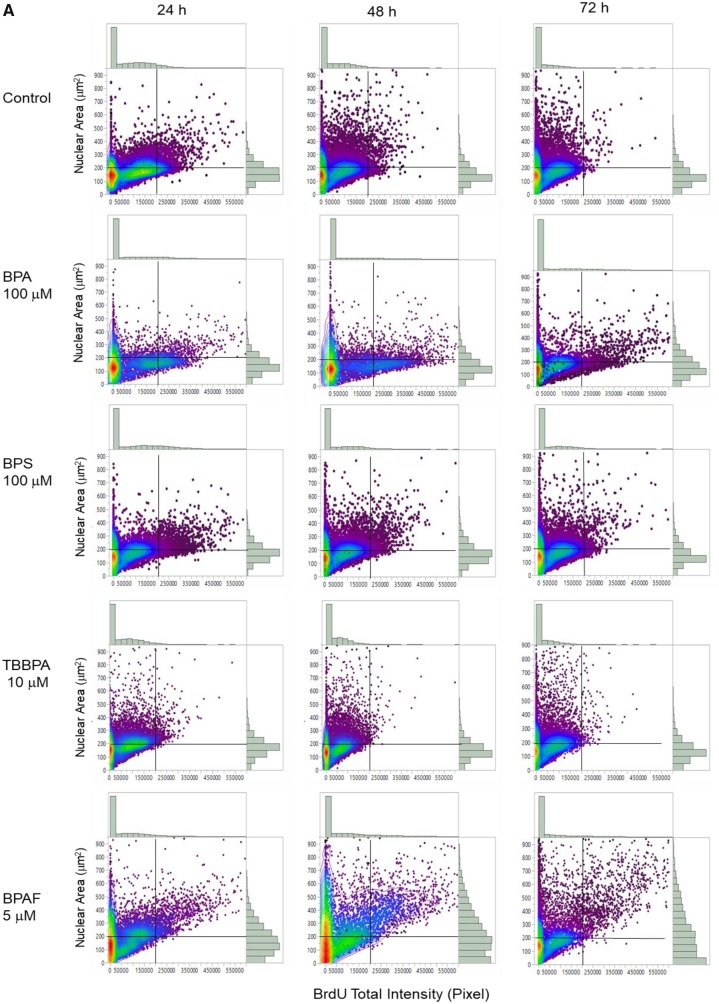
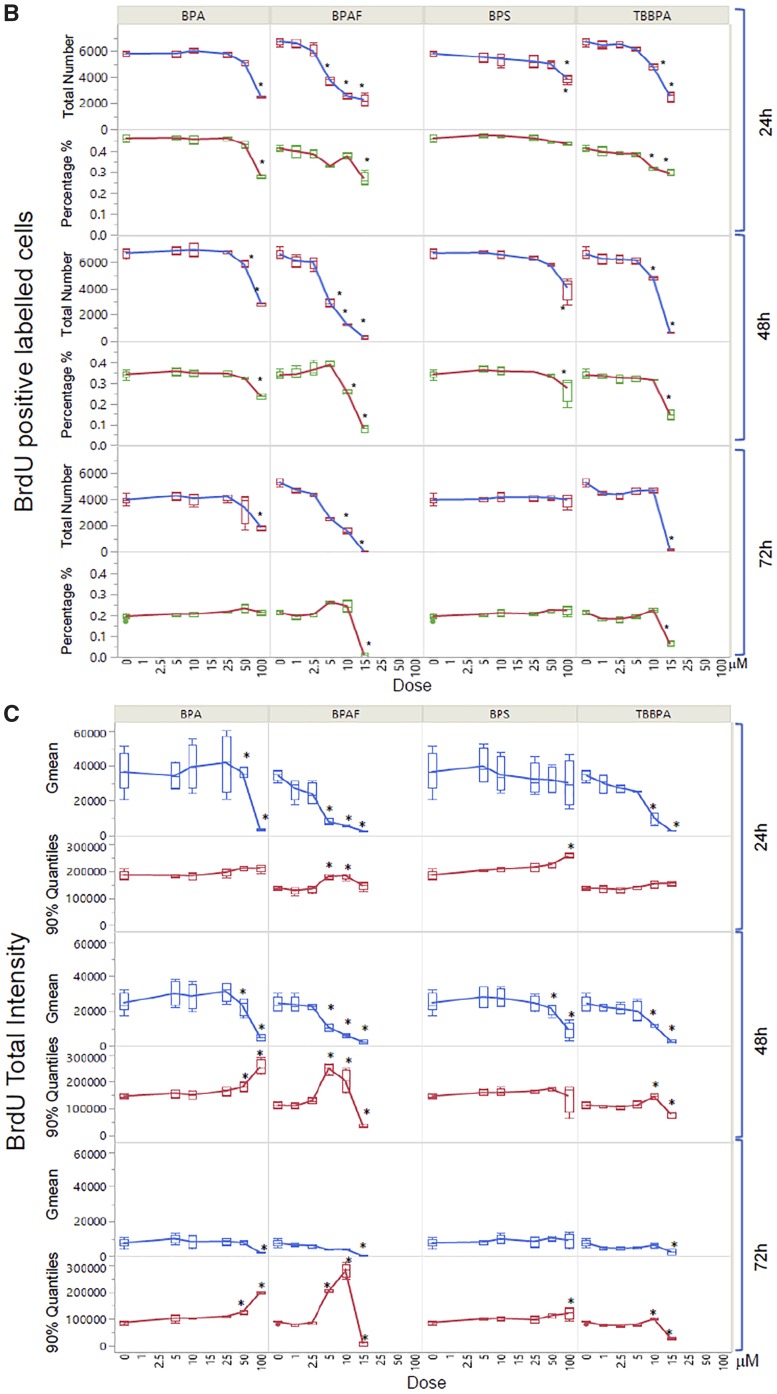
We developed a HCA-based single-cell BrdU assay to examine whether BPA or its analogs affected newly synthesized DNA. Figure 9 shows representative images of BrdU incorporation and quantitative segmentation using HCS Studio 2.0 TargetActivation BioApplication in control (A) and BPAF-treated cells (B) in the co-culture system. Segmentation and identification of the primary object nucleus in Ch1 and secondary objects BrdU in Ch2 were shown at 48 h (Figs. 9A and 9B). The distribution of the nuclear area and the total intensity of BrdU in 1 representative field was shown on the right side (Figure 9A, a3 and b3). The highlighted cells were unsuccessfully segmented nuclei in control (larger than 350 µm2) and about half of the cells had different levels of BrdU staining. A significant number of cells with large and irregular shapes were observed in the BPAF-treated cells at 5 µM (Figure 9B), and about 50% of these highlighted cells with larger nuclei were BrdU-positive cells. Figure 10A shows a scatterplot of the nuclear area versus the total intensity of BrdU in control cells and cells treated with BPA and BPS (100 µM), BPAF (5 µM), and TBPA (10 µM) at 24, 48, and 72 h. With the increase of culture time, the levels of BrdU were decreased in control (Figure 10A). Notable shape changes of these plots were observed in the co-culture cells treated with BPA and its analogs. Each compound formed a unique pattern in the scatterplot. Bisphenol A treatment at 100 µM reduced the level of BrdU; however, there was an increase in the sub-population with high levels of BrdU at 48 and 72 h (right side). Bisphenol AF treatment at 5 µM resulted in an increase of cells with a large nuclear area, and most of these cells exhibited higher BrdU levels. We calculated both the total number and percentage of BrdU-positive cells in control and treatment (Figure 10B), and observed significant decreases in total number and percentage of BrdU-positive cells after treatment of BPA at 50 and 100 μM at 24 and 48 h, BPS at 100 μM at 24 h and 48 h. A significant decrease in the total number of BrdU-positive cells in the BPA treatment at 72 h was observed, but there was no change in the percentage of BrdU-positive cells. A significant decrease of the total number of BrdU-positive cells was observed in BPAF treatment at concentrations of 5, 10, and 15 μM at 24, 48, and 72 h; however, the changes in the percentage of BrdU-positive cells were different from the total number of BrdU-positive cells. A significant decrease of BrdU-positive cells was observed only in the BPAF treatment at 15 μM at 24 and 72 h, and 10 and 15 μM at 48 h. Significant decreases in the total number and percentage of BrdU-positive cells in TBBPA at 10 and 15 μM at 24 and 48 h, and 15 μM at 72 h, were observed. Figure 10C shows the well-based geometric mean and 90% quantiles of the total intensity of BrdU per cell. Significant decreases in the geometric mean of the total intensity of BrdU in BPA treatment at 100 μM, but a significant increase in the mean of the 90% quantiles of the total intensity of BrdU at 100 μM, were observed at all time-points. Bisphenol S (100 µM) induced a significant decrease in the geometric mean of the total intensity of BrdU at 48 h and increase of the 90% quantiles in the total intensity of BrdU at 24 h. Bisphenol AF induced a significant decrease in the geometric mean of the total intensity of BrdU at 5, 10, and 15 µM at 24 and 48 h, but significant increases of the 90% quantiles of the total intensity of BrdU at 10 and 15 µM at 24 h, 5 and 10 µM at 48 and 72 h. Significant decreases of the 90% quantiles of the total intensity of BrdU were observed in TBBPA at 15 µM at 48 and 72 h. These data suggest that the DNA synthesis inhibition in response to BPA and its analogs was heterogeneic and dynamically different, and there were several phenotypically distinct sub-populations that responded differently as compared with the population-averaged measurements.
Figure 9.
Characteristic changes of DNA synthesis using BrdU assay in the testicular cell co-culture after treatment with BPA, BPS, BPAF, and TBBPA. Co-culture were treated with various concentrations of BPA and BPS (5, 10, 25, 50, and 100 μM) and BPAF and TBBPA (1, 2.5, 5, 10, and 15 μM) for 24, 48, and 72 h. Cells treated with vehicle (0.01% DMSO) were used as controls (0 μM). The nuclei were stained with Hoechst 33342 (blue). Cells were incubated with 5-bromo-2′-deoxyuridine (BrdU, 40 μM) for 3 h prior to fixation, and then stained with mouse anti-BrdU antibody and anti-mouse DyLight 488 for detection of BrdU incorporation (green). The representative images (×20) and identification of the primary object of nuclear of the controls were shown in (A) and the cells treated with BPAF at 5 μM for 72 h were shown in (B). Cells with nuclear area larger than 350 µm2 were selected in Ch1 (red bar and yellow outline) and these cells were also highlighted in Ch2 (red bar and yellow outline). Arrowhead indicated multinucleated cells with active DNA synthesis. Scale bar = 100 μm. Abbreviations: BPA, bisphenol A; BPAF, bisphenol AF; BPS, bisphenol S; TBBPA, tetrabromobisphenol A.
Figure 10.
Quantitative comparison of BrdU incorporation in the testicular cell co-culture treated with BPA, BPS, BPAF, and TBBPA. Co-cultures were treated with various concentrations of BPA and BPS (5, 10, 25, 50, and 100 μM) and BPAF and TBBPA (1, 2.5, 5, 10, and 15 μM) for 24, 48, and 72 h. Cells treated with vehicle (0.05% DMSO) were used as controls (0 μM). Representative scatterplot of nuclear area (µm2) and total intensity of BrdU were shown in (A). BrdU-positive cells were identified as having a total intensity of BrdU over 20 000 pixels. Absolute BrdU-positive cell number and percentage of BrdU-positive cells were shown in (B). Geometric mean (GMean) and 90% quantiles of total intensity were calculated (C). Data were presented as mean ± SD, n = 8. Four replicates in 2 independent experiments were included. Statistical analysis was conducted by 2-way ANOVA followed by Tukey-Kramer multiple comparisons (*p < .05, **p < .01). Abbreviations: BPA, bisphenol A; BPAF, bisphenol AF; BPS, bisphenol S; TBBPA, tetrabromobisphenol A.
DISCUSSION
In our previous study, we compared the spermatogonial toxicities of BPA and its analogs using the murine spermatogonial C18 cell line, and found that BPAF and TBBPA exhibited higher spermatogonial toxicities, including alterations in nuclear morphology, cell cycle, DNA damage responses, and perturbation of the cytoskeleton compared with BPA and BPS (Liang et al., 2017). Although using spermatogonial cells provided mechanistic insights into the testicular toxicities, it lacks the multicellular complexity and organ-like structure needed to mimic the physiological conditions observed in vivo. In this study, we applied the testicular cell co-culture model (Yin et al., 2017) to further examine the testicular toxicities of BPA and its analogs. As reported previously (Yin et al., 2017), the testicular co-culture model showed distinct differential F-actin cytoskeletal structures compared with the single culture, and the incorporation of Sertoli and Leydig cells with C18 spermatogonia cells significantly altered in vitro cellular structures, such as higher order actin filaments, formation of actin bundles or mesh-like assemblies, and thicker bundles of F-actin filaments across multiple cell types (Yin et al., 2017). Through the comparison of the cytotoxicity of 32 compounds among the co-culture and single-cell culture models, we found the testicular cell co-culture model was able to recapitulate the multicellular complexity, enabling the cell-cell communication among various cell types, suggesting that the co-culture model might be a better model for representing the in vivo testicular toxicities. Overall, we have observed a similar toxicity ranking of BPA and its selected analogs in the co-culture model compared with the spermatogonial cell culture (Liang et al., 2017; Yin et al., 2017), with BPAF exerting the highest toxicity, followed by TBBPA, BPA, and BPS. Moreover, the testicular cell co-culture model was more sensitive than the C18 spermatogonial cells in response to BPA and its analogs. Our in vitro finding using the co-culture model was supported by an in vivo study that demonstrated that BPAF exposure uniquely impaired the pregnancies and sexual development in rats at doses of approximately 80 and approximately 280 mg/kg, whereas BPA did not (Sutherland et al., 2017). Future studies will be critical to elucidating the differential mechanisms of action between BPA and its analogs, such as BPAF and TBBPA.
Nuclear morphological features have been suggested as useful biomarkers in various adverse cellular events (Eidet et al., 2014; Ikeguchi et al., 1999). Most eukaryotic cellular nuclei are generally round, oval-shaped and smooth, and the changes in nuclear morphology are observed in diverse developmental processes such as the nuclei of spermatocytes (Gan et al., 2013) as well as in pathological conditions such as aging and cancers (Haithcock et al., 2005; Nandakumar et al., 2016; Zink et al., 2004). Recent studies have found that HCA-based quantitative assessment of multiple nuclear parameters was found to be a sensitive marker for detecting early cytotoxic effects (Ramm et al., 2019). High-content analysis enables the measurements of unbiased multi-parametric data at the single-cell level and provides both temporal and spatial measurements of cell biological phenotypes associated with adverse health outcomes (Buchser et al., 2004; Mattiazzi Usaj et al., 2016; Zanella et al., 2010). In the present study, the quantification of nuclear morphology revealed that BPA treatment significantly altered the nuclear area at a nonlethal dose, which is consistent with prior in vivo studies in which BPA exposure induced abnormal nuclear morphology in rat mammary glands and mice testes (Ibrahim et al., 2016; Takao et al., 1999). Additionally, treatment with BPA and BPS induced significant changes to nuclear shape (P2A and LWR) at lower doses in the co-culture model. The data suggest that alterations to nuclear morphology in the testicular co-culture model could be sensitive endpoints in the detection of a chemical’s toxicity. In addition, our study observed that BPAF induced unique multinucleated germ cells (MNGs), and the percentage of MNGs was increased in a time- and dose-dependent manner in the co-culture model. Multinucleated cells are defined as eukaryotic cells that have 2 or more nuclei within 1 cytoplasm, and can be divided into syncytium and plasmodium, resulting from abnormal cytokinesis, spindle assembly checkpoint defects, acytokinetic cell division, or defective DNA repair. It has been reported that MNGs occurred in cryptorchidism and may be linked to testicular neoplasms and decreased sperm count (Cortes et al., 2003; Spade et al., 2014). The induction of multinucleated gonocytes was reported as a reproductive toxicity hallmark in animal models and in humans in response to environmental chemicals, including di-(N-butyl) phthalate (DBP), BPA, andrographolide, and aflatoxin (Akbarsha and Murugaian, 2000; Barlow et al., 2004; Faridha et al., 2007; Gallegos-Avila et al., 2010; Mylchreest et al., 2002; Takao et al., 1999). Having anti-androgenic effects, DBP and bis(2-ethylhexyl) phthalate were found to induce high levels of MNG in correlation with the decrease of testosterone production in fetal rat testis and human fetal testis xenograft (Kleymenova et al., 2005; Parks et al., 2000; Spade et al., 2015). The single-cell analysis demonstrated that multinucleated cells exhibited higher correlations between cytoskeletal perturbations and DNA damage response compared with non-multinucleated cells in the same treatment conditions. These phenomena could be attributed to DNA damage-induced alterations in perinuclear actin networks or others (Chen et al., 2015). Future studies should elucidate the underlying mechanisms of BPAF-induced multinucleation.
Although current HCA has emerged as a powerful tool for analyzing multiparametric data for toxicity profiling, the data exploration of these methods lags behind. High-content analysis has generally focused on 1 or 2 image-related features to generate a population-averaged readout that simply reflects the alterations of the morphological features in each condition (Singh et al., 2014). Additionally, the aggregation of the single-cell level data usually masks the phenotypic heterogeneity within the cells, especially when the phenotypic change only occurred in a small specific subpopulation (Altschuler and Wu, 2010). The population-averaged measurement limited the discovery power and can mask the information contained in the subpopulation (Heynen-Genel et al., 2012). Therefore, it was essential to employ an advanced computational approach that integrated the multi-dimensional HCA data at the single-cell level to precisely quantify the complex phenotypes of interest (Bakal et al., 2007; Conrad and Gerlich, 2010; Fuchs et al., 2010; Fuller et al., 2016; Jones et al., 2009; Leonard et al., 2015; Loo et al., 2007; Mata et al., 2016; Neumann et al., 2006; Schmitz et al., 2010). The ML classification algorithm was derived from the manual annotation of representative images from our training sets according to the predefined classes, and was considered acceptable once each parameter was measured at 95% sensitivity and specificity (Sommer and Gerlich, 2013; Tarca et al., 2007). In this study, we applied the ML approach and examined the phenotypic changes of M phase nuclei, multi-nucleation, and F-actin cytoskeletal structure.
Mitotic cell cycle phase (M phase) is one of the most important events for successful cell division (Nurse, 1990), the identification and quantification of cell populations in M phase usually requires additional staining, such as mitotic-specific marker anti-phosphorylated (ser10) H3 (Lyman et al., 2011). Blasi et al. (2016) recently utilized a label-free approach for quantifying M phase cells in multi-dimensional data with a supervised ML algorithm. In our study, we have established a ML pipeline to recognize and quantify cells in M phase based on the morphological, textural, and intensity features extracted from the multi-channel fluorescence staining. We have shown the induction of M phase arrest in the co-culture treated with BPA and its analogs in a dose- and time-dependent manner, reflecting the chemical-specific effect on cell cycle progression. The results are consistent with previous findings, which showed that BPA exposure significantly perturbed spermatogenesis in animal models and inhibited cell proliferation in Sertoli and Leydig cell lines (Ali et al., 2014; Chen et al., 2016b; Liu et al., 2013; Pereira et al., 2014).
Incorporation of the thymidine analog BrdU has been established as a traditional assay for determining cell proliferation (Boulanger et al., 2016; Cecchini et al., 2012). Thus, we developed an HCA-based BrdU assay to examine whether newly DNA synthesis was affected by the treatment of BPA or its analogs at a single-cell level. As compared with the conventional BrdU incorporation assay, an advantage of this HCA assay was able to extract a subpopulation of cells with positive BrdU staining based on ML algorithms, and multiplex with other cellular features, such as nuclear area or γH2AX response in an automated and robust manner. High-content analysis-based BrdU assay revealed that a small cell subpopulation increased DNA synthesis in response to BPA and BPAF that was associated with an increase of nuclear area, but a population-averaged level significantly decreased DNA synthesis was observed. It is first reported that the sub-population of BPAF-induced MNGs was positively correlated with cell proliferation (BrdU-positive staining), but its long-term impact on the testes function needs to be further studied.
Actin, one of the major components of the cytoskeleton, has been shown to play an essential role in cell movement, cargo transportation, acrosome reaction, and nuclear modification during spermatogenesis (Kierszenbaum and Tres, 2004; Sun et al., 2011). Alteration of F-actin intensity has served as a sensitive indicator for monitoring the adverse effects of environmental exposure. However, the quantification of total F-actin intensity might not reflect the spatial alterations observed in F-actin filaments. In the co-culture model, we observed 2 types of F-actin filaments: stretched across the cytosol and assembled in the 3D structure, and formed a dense cortex of F-actin on the cell’s edge. The ML approach was able to recognize and quantify stretched F-actin filaments and found significant decreases in the co-culture treated with BPA and its analogs. Our previous study revealed that Sertoli cells produced the stretched F-actin bundles in the co-culture model (Yin et al., 2017), and the parallel actin bundles in Sertoli cells formed the ectoplasmic specialization, which participates in spermatid head formation, cell movement, elongated spermatid orientation, and spermatozoa release (Vidal and Whitney, 2014). Therefore, the alteration of stretched F-actin filaments suggested potential damage of Sertoli cells, leading to the perturbation of 3D structure in the co-culture. This finding supported the concept that BPA and its analogs induced Sertoli cell damage, altered the seminiferous tubule morphology in the animal study (Sutherland et al., 2017), thus resulting in perturbation of the blood-testis barrier.
γ-H2AX has been considered a highly specific and sensitive cellular marker in monitoring initiation of DNA damage (Ando et al., 2014; Fu et al., 2012; Garcia-Canton et al., 2013). The previous studies showed that exposure to BPA or BPS induced DNA damage responses in germ cells (Chen et al., 2016a; Liu et al., 2014). Additionally, the genotoxicity of BPA and its selected analogs have been detected in multiple cell lines and followed a cell-type-specific and chemical-specific manner. In the co-culture, we observed that BPA and BPS treatment did not induce γ-H2AX expression. One possible explanation for this inconsistency between the co-culture model and the single-cell cultures could be due to the differential biotransformation of BPA and its analogs, and the different DNA damage repair capacities among the different cell lines and models. In addition, BPA induced γ-H2AX expression at a dose of 10 nM in human breast cancer cells; however, in HepG2 cells, BPAF was found to induce expression, where BPA even at a dose of 100 μM was unable to induce any effects (Audebert et al., 2011; Pfeifer et al., 2015). In the co-culture model, BPAF treatment significantly induced DNA damage responses starting at a dose of 5 μM, whereas TBBPA exerted its effects at a dose of 15 μM suggesting higher genotoxicity for BPAF and TBBPA as compared with BPA.
In summary, using the testicular cell co-culture model, we found BPA and its analogs induced dose- and time-dependent changes in a wide spectrum of adverse endpoints, including nuclear morphology, DNA synthesis, DNA damage, and cytoskeletal structure. The testicular cell co-culture model was more sensitive than the C18 spermatogonial cells. Unlike the conventional population-averaged assays, the single-cell-based assay not only showed the overall levels of the averaged population, but also revealed changes in subpopulations of cells. Furthermore, the ML-based phenotypic analysis revealed that treatment of BPA and its analogs resulted in the loss of spatial cytoskeletal structure, and an accumulation of M phase cells in a dose- and time-dependent manner. Treatment with BPAF-induced multinucleated cells, which were associated with altered DNA damage response and impaired cellular actin filaments. Overall, we demonstrated a new and effective means to evaluate multiple toxic endpoints in the testicular cell co-culture model through the combination of ML and high-content image-based single-cell analysis. This approach provided an in-depth analysis of the multi-dimensional HCA data and provided an unbiased quantitative analysis of the phenotypes of interest. By integrating machine learning approaches with established HCA algorithms, it should soon be possible to uncover multi-dimensional data and quantify these phenotypic changes in large-scale screening to environmental chemicals.
DECLARATION OF CONFLICTING INTERESTS
The authors declared no potential conflicts of interest with respect to the research, authorship, and/or publication of this article.
ACKNOWLEDGMENTS
We thank the National Toxicology Program for providing testing compounds and Jake Maas for proofreading the final version. We thank Dr Marie-Claude Hofmann from UT MD Anderson Cancer Center for providing the C18 cell. X.Y. is a co-founder and scientific consultant with Reprotox Biotech LLC.
FUNDING
This work was supported by the Centers for Disease Control and Prevention, The National Institute for Occupational Safety and Health (NIOSH) of the National Institutes of Health (NIH) under award number R21OH010473; the National Institute of Environmental Health Sciences of the NIH under award numbers R43ES027374 and R44ES027374; and the Alternatives Research & Development Foundation (ARDF).
REFERENCES
- Akbarsha M. A., Murugaian P. (2000). Aspects of the male reproductive toxicity/male antifertility property of andrographolide in albino rats: Effect on the testis and the cauda epididymidal spermatozoa. Phytother. Res. 14, 432–435. [DOI] [PubMed] [Google Scholar]
- Ali S., Steinmetz G., Montillet G., Perrard M. H., Loundou A., Durand P., Guichaoua M. R., Prat O. (2014). Exposure to low-dose bisphenol A impairs meiosis in the rat seminiferous tubule culture model: A physiotoxicogenomic approach. PLoS One 9, e106245.. [DOI] [PMC free article] [PubMed] [Google Scholar]
- Altschuler S. J., Wu L. F. (2010). Cellular heterogeneity: Do differences make a difference? Cell 141, 559–563. [DOI] [PMC free article] [PubMed] [Google Scholar]
- Ando M., Yoshikawa K., Iwase Y., Ishiura S. (2014). Usefulness of monitoring gamma-H2AX and cell cycle arrest in HepG2 cells for estimating genotoxicity using a high-content analysis system. J. Biomol. Screen. 19, 1246–1254. [DOI] [PubMed] [Google Scholar]
- Audebert M., Dolo L., Perdu E., Cravedi J. P., Zalko D. (2011). Use of the gamma H2AX assay for assessing the genotoxicity of bisphenol A and bisphenol F in human cell lines. Arch. Toxicol. 85, 1463–1473. [DOI] [PubMed] [Google Scholar]
- Bakal C., Aach J., Church G., Perrimon N. (2007). Quantitative morphological signatures define local signaling networks regulating cell morphology. Science 316, 1753–1756. [DOI] [PubMed] [Google Scholar]
- Barlow N. J., McIntyre B. S., Foster P. M. D. (2004). Male reproductive tract lesions at 6, 12, and 18 months of age following in utero exposure to di(n-butyl) phthalate. Toxicol. Pathol. 32, 79–90. [DOI] [PubMed] [Google Scholar]
- Blasi T., Hennig H., Summers H. D., Theis F. J., Cerveira J., Patterson J. O., Davies D., Filby A., Carpenter A. E., Rees P. (2016). Label-free cell cycle analysis for high-throughput imaging flow cytometry. Nat Commun 7. [DOI] [PMC free article] [PubMed] [Google Scholar]
- Boulanger J. J., Staines W. A., LeBlanc V., Khoo E. L., Liang J., Messier C. (2016). A simple histological technique to improve immunostaining when using DNA denaturation for BrdU labelling. J. Neurosci. Methods 259, 40–46. [DOI] [PubMed] [Google Scholar]
- Braun J. M., Kalkbrenner A. E., Calafat A. M., Yolton K., Ye X. Y., Dietrich K. N., Lanphear B. P. (2011). Impact of early-life bisphenol A exposure on behavior and executive function in children. Pediatrics 128, 873–882. [DOI] [PMC free article] [PubMed] [Google Scholar]
- Bray M. A., Carpenter A. E. (2018). Quality control for high-throughput imaging experiments using machine learning in Cellprofiler. Methods Mol. Biol. 1683, 89–112. [DOI] [PMC free article] [PubMed] [Google Scholar]
- Breiman L. (2001). Random forests. Mach. Learn. 45, 5–32. [Google Scholar]
- Buchser W., Collins M., Garyantes T., Guha R., Haney S., Lemmon V., Li Z., Trask O. J. (2004). Assay development guidelines for image-based high content screening, high content analysis and high content imaging In Assay Guidance Manual (Sittampalam G. S., Coussens N. P., Brimacombe K., Grossman A., Arkin M., Auld D., Austin C., Baell J., Bejcek B., Chung T. D. Y., Eds.). Eli Lilly & Company and the National Center for Advancing Translational Sciences, Bethesda, MD. [PubMed] [Google Scholar]
- Calafat A. M., Ye X. Y., Wong L. Y., Reidy J. A., Needham L. L. (2008). Exposure of the US population to bisphenol A and 4-tertiary-octylphenol: 2003–2004. Environ. Health Persp. 116, 39–44. [DOI] [PMC free article] [PubMed] [Google Scholar]
- Carpenter A. E., Jones T. R., Lamprecht M. R., Clarke C., Kang I. H., Friman O., Guertin D. A., Chang J. H., Lindquist R. A., Moffat J., et al. (2006). CellProfiler: Image analysis software for identifying and quantifying cell phenotypes. Genome Biol. 7, R100. [DOI] [PMC free article] [PubMed] [Google Scholar]
- Carwile J. L., Michels K. B. (2011). Urinary bisphenol A and obesity: NHANES 2003–2006. Environ Res 111, 825–830. [DOI] [PMC free article] [PubMed] [Google Scholar]
- Cecchini M. J., Amiri M., Dick F. A. (2012). Analysis of cell cycle position in mammalian cells. J. Vis. Exp. doi: 10.3791/3491(59). [DOI] [PMC free article] [PubMed] [Google Scholar]
- Chen B., Co C., Ho C. C. (2015). Cell shape dependent regulation of nuclear morphology. Biomaterials 67, 129–136. [DOI] [PMC free article] [PubMed] [Google Scholar]
- Chen Y. C., Shu L., Qiu Z. Q., Lee D. Y., Settle S. J., Hee S. Q., Telesca D., Yang X., Allard P. (2016a). Exposure to the BPA-substitute bisphenol S causes unique alterations of germline function. PLoS Genet. 12, e1006223.. [DOI] [PMC free article] [PubMed] [Google Scholar]
- Chen Z. J., Zhang K. S., Ge L. C., Liu H., Chen L. K., Du J., Wang H. S. (2016b). Signals involved in the effects of bisphenol A (BPA) on proliferation and motility of Leydig cells: A comparative proteomic analysis. Toxicol. Res. 5, 1573–1584. [DOI] [PMC free article] [PubMed] [Google Scholar]
- Cheng C. Y., Mruk D. D. (2002). Cell junction dynamics in the testis: Sertoli-germ cell interactions and male contraceptive development. Physiol. Rev. 82, 825–874. [DOI] [PubMed] [Google Scholar]
- Chong Y. T., Koh J. L. Y., Friesen H., Duffy S. K., Cox M. J., Moses A., Moffat J., Boone C., Andrews B. J. (2015). Yeast proteome dynamics from single cell imaging and automated analysis. Cell 162, 221–221. [DOI] [PubMed] [Google Scholar]
- Conrad C., Gerlich D. W. (2010). Automated microscopy for high-content RNAi screening. J. Cell Biol. 188, 453–461. [DOI] [PMC free article] [PubMed] [Google Scholar]
- Cortes D., Thorup J., Visfeldt J. (2003). Multinucleated spermatogonia in cryptorchid boys: A possible association with an increased risk of testicular malignancy later in life? APMIS 111, 25–31; discussion 31. [DOI] [PubMed] [Google Scholar]
- Driffield M., Harmer N., Bradley E., Fernandes A. R., Rose M., Mortimer D., Dicks P. (2008). Determination of brominated flame retardants in food by LC-MS/MS: Diastereoisomer-specific hexabromocyclododecane and tetrabromobisphenol A. Food Addit. Contam. A 25, 895–903. [DOI] [PubMed] [Google Scholar]
- Ehrlich S., Williams P. L., Missmer S. A., Flaws J. A., Berry K. F., Calafat A. M., Ye X. Y., Petrozza J. C., Wright D., Hauser R. (2012). Urinary bisphenol A concentrations and implantation failure among women undergoing in vitro fertilization. Environ. Health Persp. 120, 978–983. [DOI] [PMC free article] [PubMed] [Google Scholar]
- Eidet J. R., Pasovic L., Maria R., Jackson C. J., Utheim T. P. (2014). Objective assessment of changes in nuclear morphology and cell distribution following induction of apoptosis. Diagn. Pathol. 9. [DOI] [PMC free article] [PubMed] [Google Scholar]
- Elmore S. A., Ryan A. M., Wood C. E., Crabbs T. A., Sills R. C. (2014). FutureTox II: Contemporary concepts in toxicology: “Pathways to prediction: In vitro and in silico models for predictive toxicology”. Toxicol. Pathol. 42, 940–942. [DOI] [PMC free article] [PubMed] [Google Scholar]
- Faridha A., Faisal K., Akbarsha M. A. (2007). Aflatoxin treatment brings about generation of multinucleate giant spermatids (symplasts) through opening of cytoplasmic bridges: Light and transmission electron microscopic study in Swiss mouse. Reprod. Toxicol. 24, 403–408. [DOI] [PubMed] [Google Scholar]
- Fu S. B., Yang Y., Tirtha D., Yen Y., Zhou B. S., Zhou M. M., Ohlmeyer M., Ko E. C., Cagan R., Rosenstein B. S., et al. (2012). Gamma-H2AX kinetics as a novel approach to high content screening for small molecule radiosensitizers. PLoS One 7. [DOI] [PMC free article] [PubMed] [Google Scholar]
- Fuchs F., Pau G., Kranz D., Sklyar O., Budjan C., Steinbrink S., Horn T., Pedal A., Huber W., Boutros M. (2010). Clustering phenotype populations by genome-wide RNAi and multiparametric imaging. Mol. Syst. Biol. 6, 370.. [DOI] [PMC free article] [PubMed] [Google Scholar]
- Fuller J. A., Berlinicke C. A., Inglese J., Zack D. J. (2016). Use of a machine learning-based high content analysis approach to identify photoreceptor neurite promoting molecules. Adv. Exp. Med. Biol. 854, 597–603. [DOI] [PMC free article] [PubMed] [Google Scholar]
- Gallegos-Avila G., Ancer-Rodriguez J., Niderhauser-Garcia A., Ortega-Martinez M., Jaramillo-Rangel G. (2010). Multinucleation of spermatozoa and spermatids in infertile men chronically exposed to carbofuran. Reprod. Toxicol. 29, 458–460. [DOI] [PubMed] [Google Scholar]
- Gan H., Wen L., Liao S., Lin X., Ma T., Liu J., Song C. X., Wang M., He C., Han C., et al. (2013). Dynamics of 5-hydroxymethylcytosine during mouse spermatogenesis. Nat. Commun. 4, 1995.. [DOI] [PubMed] [Google Scholar]
- Garcia-Canton C., Anadon A., Meredith C. (2013). Assessment of the in vitro γH2AX assay by high content screening as a novel genotoxicity test. Mutat. Res. Gen. Tox. En. 757, 158–166. [DOI] [PubMed] [Google Scholar]
- Haithcock E., Dayani Y., Neufeld E., Zahand A. J., Feinstein N., Mattout A., Gruenbaum Y., Liu J. (2005). Age-related changes of nuclear architecture in Caenorhabditis elegans. Proc. Natl. Acad. Sci. U.S.A. 102, 16690–16695. [DOI] [PMC free article] [PubMed] [Google Scholar]
- Hennig H., Rees P., Blasi T., Kamentsky L., Hung J., Dao D., Carpenter A. E., Filby A. (2017). An open-source solution for advanced imaging flow cytometry data analysis using machine learning. Methods 112, 201–210. [DOI] [PMC free article] [PubMed] [Google Scholar]
- Heynen-Genel S., Pache L., Chanda S. K., Rosen J. (2012). Functional genomic and high-content screening for target discovery and deconvolution. Expert Opin. Drug Discov. 7, 955–968. [DOI] [PMC free article] [PubMed] [Google Scholar]
- Hofmann M. C., Braydich-Stolle L., Dettin L., Johnson E., Dym M. (2005a). Immortalization of mouse germ line stem cells. Stem Cells 23, 200–210. [DOI] [PMC free article] [PubMed] [Google Scholar]
- Hofmann M. C., Braydich-Stolle L., Dym M. (2005b). Isolation of male germ-line stem cells; influence of GDNF. Dev. Biol. 279, 114–124. [DOI] [PMC free article] [PubMed] [Google Scholar]
- Ibrahim M. A. A., Elbakry R. H., Bayomy N. A. (2016). Effect of bisphenol A on morphology, apoptosis and proliferation in the resting mammary gland of the adult albino rat. Int. J. Exp. Pathol. 97, 27–36. [DOI] [PMC free article] [PubMed] [Google Scholar]
- Ikeguchi M., Sakatani T., Endo K., Makino M., Kaibara N. (1999). Computerized nuclear morphometry is a useful technique for evaluating the high metastatic potential of colorectal adenocarcinoma. Cancer 86, 1944–1951. [DOI] [PubMed] [Google Scholar]
- Jevtic P., Edens L. J., Vukovic L. D., Levy D. L. (2014). Sizing and shaping the nucleus: Mechanisms and significance. Curr. Opin. Cell Biol. 28, 16–27. [DOI] [PMC free article] [PubMed] [Google Scholar]
- Jin P., Wang X., Chang F., Bai Y., Li Y., Zhou R., Chen L. (2013). Low dose bisphenol A impairs spermatogenesis by suppressing reproductive hormone production and promoting germ cell apoptosis in adult rats. J. Biomed. Res. 27, 135–144. [DOI] [PMC free article] [PubMed] [Google Scholar]
- Jones T. R., Carpenter A. E., Lamprecht M. R., Moffat J., Silver S. J., Grenier J. K., Castoreno A. B., Eggert U. S., Root D. E., Golland P., et al. (2009). Scoring diverse cellular morphologies in image-based screens with iterative feedback and machine learning. Proc. Natl. Acad. Sci. U.S.A. 106, 1826–1831. [DOI] [PMC free article] [PubMed] [Google Scholar]
- Jones T. R., Kang I. H., Wheeler D. B., Lindquist R. A., Papallo A., Sabatini D. M., Golland P., Carpenter A. E. (2008). CellProfiler Analyst: Data exploration and analysis software for complex image-based screens. BMC Bioinformatics 9, 482.. [DOI] [PMC free article] [PubMed] [Google Scholar]
- Kang J. H., Kondo F., Katayama Y. (2006). Human exposure to bisphenol A. Toxicology 226, 79–89. [DOI] [PubMed] [Google Scholar]
- Kierszenbaum A. L., Tres L. L. (2004). The acrosome-acroplaxome-manchette complex and the shaping of the spermatid head. Arch. Histol. Cytol. 67, 271–284. [DOI] [PubMed] [Google Scholar]
- Kitamura S., Suzuki T., Sanoh S., Kohta R., Jinno N., Sugihara K., Yoshihara S., Fujimoto N., Watanabe H., Ohta S. (2005). Comparative study of the endocrine-disrupting activity of bisphenol A and 19 related compounds. Toxicol. Sci. 84, 249–259. [DOI] [PubMed] [Google Scholar]
- Kleymenova E., Swanson C., Boekelheide K., Gaido K. W. (2005). Exposure in utero to di(n-butyl) phthalate alters the vimentin cytoskeleton of fetal rat Sertoli cells and disrupts Sertoli cell-gonocyte contact. Biol. Reprod. 73, 482–490. [DOI] [PubMed] [Google Scholar]
- Lakind J. S., Naiman D. Q. (2011). Daily intake of bisphenol A and potential sources of exposure: 2005-2006 National Health and Nutrition Examination Survey. J. Expo. Sci. Env. Epid. 21, 272–279. [DOI] [PMC free article] [PubMed] [Google Scholar]
- Lang I. A., Galloway T. S., Scarlett A., Henley W. E., Depledge M., Wallace R. B., Melzer D. (2008). Association of urinary bisphenol A concentration with medical disorders and laboratory abnormalities in adults. J. Am. Med. Assoc. 300, 1303–1310. [DOI] [PubMed] [Google Scholar]
- Lassen T. H., Frederiksen H., Jensen T. K., Petersen J. H., Joensen U. N., Main K. M., Skakkebaek N. E., Juul A., Jorgensen N., Andersson A. M. (2014). Urinary bisphenol A levels in young men: Association with reproductive hormones and semen quality. Environ. Health Persp. 122, 478–484. [DOI] [PMC free article] [PubMed] [Google Scholar]
- Leonard A. P., Cameron R. B., Speiser J. L., Wolf B. J., Peterson Y. K., Schnellmann R. G., Beeson C. C., Rohrer B. (2015). Quantitative analysis of mitochondrial morphology and membrane potential in living cells using high-content imaging, machine learning, and morphological binning. Biochim. Biophys. Acta, Mol. Cell Res. 1853, 348–360. [DOI] [PMC free article] [PubMed] [Google Scholar]
- Liang S., Yin L., Shengyang Yu K., Hofmann M. C., Yu X. (2017). High-content analysis provides mechanistic insights into the testicular toxicity of bisphenol A and selected analogues in mouse spermatogonial cells. Toxicol. Sci. 155, 43–60. [DOI] [PMC free article] [PubMed] [Google Scholar]
- Liao C. Y., Kannan K. (2013). Concentrations and profiles of bisphenol A and other bisphenol analogues in foodstuffs from the United States and their implications for human exposure. J. Agr. Food Chem. 61, 4655–4662. [DOI] [PubMed] [Google Scholar]
- Liao C. Y., Liu F., Guo Y., Moon H. B., Nakata H., Wu Q., Kannan K. (2012). Occurrence of eight bisphenol analogues in indoor dust from the United States and several Asian countries: Implications for human exposure. Environ. Sci. Technol. 46, 9138–9145. [DOI] [PubMed] [Google Scholar]
- Liu C., Duan W., Li R., Xu S., Zhang L., Chen C., He M., Lu Y., Wu H., Pi H., et al. (2013). Exposure to bisphenol A disrupts meiotic progression during spermatogenesis in adult rats through estrogen-like activity. Cell Death Dis. 4, e676.. [DOI] [PMC free article] [PubMed] [Google Scholar]
- Liu C., Duan W. X., Zhang L., Xu S. C., Li R. Y., Chen C. H., He M. D., Lu Y. H., Wu H. J., Yu Z. P., et al. (2014). Bisphenol A exposure at an environmentally relevant dose induces meiotic abnormalities in adult male rats. Cell Tissue Res. 355, 223–232. [DOI] [PubMed] [Google Scholar]
- Loo L. H., Wu L. F., Altschuler S. J. (2007). Image-based multivariate profiling of drug responses from single cells. Nat. Methods 4, 445–453. [DOI] [PubMed] [Google Scholar]
- Lyman S. K., Crawley S. C., Gong R., Adamkewicz J. I., McGrath G., Chew J. Y., Choi J., Holst C. R., Goon L. H., Detmer S. A., et al. (2011). High-content, high-throughput analysis of cell cycle perturbations induced by the HSP90 Inhibitor XL888. PLoS One 6. [DOI] [PMC free article] [PubMed] [Google Scholar]
- Martin H. L., Adams M., Higgins J., Bond J., Morrison E. E., Bell S. M., Warriner S., Nelson A., Tomlinson D. C. (2014). High-content, high-throughput screening for the identification of cytotoxic compounds based on cell morphology and cell proliferation markers. PLoS One 9. [DOI] [PMC free article] [PubMed] [Google Scholar]
- Mata G., Radojevic M., Smal I., Morales M., Meijering E., Rubio J. (2016). Automatic detection of neurons in high-content microscope images using machine learning approaches. Proc. IEEE Int. Symp. Biomed. Imaging 130, 330–333. [Google Scholar]
- Mattiazzi Usaj M., Styles E. B., Verster A. J., Friesen H., Boone C., Andrews B. J. (2016). High-content screening for quantitative cell biology. Trends Cell Biol. 26, 598–611. [DOI] [PubMed] [Google Scholar]
- McQuin C., Goodman A., Chernyshev V., Kamentsky L., Cimini B. A., Karhohs K. W., Doan M., Ding L., Rafelski S. M., Thirstrup D., et al. (2018). CellProfiler 3.0: Next-generation image processing for biology. PLoS Biol. 16, e2005970.. [DOI] [PMC free article] [PubMed] [Google Scholar]
- Merrick B. A., Paules R. S., Tice R. R. (2015). Intersection of toxicogenomics and high throughput screening in the Tox21 program: An NIEHS perspective. Int. J. Biotechnol. 14, 7–27. [DOI] [PMC free article] [PubMed] [Google Scholar]
- Mukherjee R. N., Chen P., Levy D. L. (2016). Recent advances in understanding nuclear size and shape. Nucleus 7, 167–186. [DOI] [PMC free article] [PubMed] [Google Scholar]
- Mylchreest E., Sar M., Wallace D. G., Foster P. M. D. (2002). Fetal testosterone insufficiency and abnormal proliferation of Leydig cells and gonocytes in rats exposed to di(n-butyl) phthalate. Reprod. Toxicol. 16, 19–28. [DOI] [PubMed] [Google Scholar]
- Nandakumar V., Hansen N., Glenn H. L., Han J. H., Helland S., Hernandez K., Senechal P., Johnson R. H., Bussey K. J., Meldrum D. R. (2016). Vorinostat differentially alters 3D nuclear structure of cancer and non-cancerous esophageal cells. Sci. Rep. 6, 30593.. [DOI] [PMC free article] [PubMed] [Google Scholar]
- Neumann B., Held M., Liebel U., Erfle H., Rogers P., Pepperkok R., Ellenberg J. (2006). High-throughput RNAi screening by time-lapse imaging of live human cells. Nat. Methods 3, 385–390. [DOI] [PubMed] [Google Scholar]
- Neumann B., Walter T., Heriche J. K., Bulkescher J., Erfle H., Conrad C., Rogers P., Poser I., Held M., Liebel U., et al. (2010). Phenotypic profiling of the human genome by time-lapse microscopy reveals cell division genes. Nature 464, 721–727. [DOI] [PMC free article] [PubMed] [Google Scholar]
- Niedenberger B. A., Chappell V. K., Kaye E. P., Renegar R. H., Geyer C. B. (2013). Nuclear localization of the actin regulatory protein palladin in Sertoli cells. Mol. Reprod. Dev. 80, 403–413. [DOI] [PubMed] [Google Scholar]
- Nurse P. (1990). Universal control mechanism regulating onset of M-phase. Nature 344, 503–508. [DOI] [PubMed] [Google Scholar]
- O’Brien P. J., Irwin W., Diaz D., Howard-Cofield E., Krejsa C. M., Slaughter M. R., Gao B., Kaludercic N., Angeline A., Bernardi P., et al. (2006). High concordance of drug-induced human hepatotoxicity with in vitro cytotoxicity measured in a novel cell-based model using high content screening. Arch. Toxicol. 80, 580–604. [DOI] [PubMed] [Google Scholar]
- Pacchierotti F., Ranaldi R., Eichenlaub-Ritter U., Attia S., Adler I. D. (2008). Evaluation of aneugenic effects of bisphenol A in somatic and germ cells of the mouse. Mutat. Res. Gen. Tox. En. 651, 64–70. [DOI] [PubMed] [Google Scholar]
- Parks L. G., Ostby J. S., Lambright C. R., Abbott B. D., Klinefelter G. R., Barlow N. J., Gray L. E. Jr. (2000). The plasticizer diethylhexyl phthalate induces malformations by decreasing fetal testosterone synthesis during sexual differentiation in the male rat. Toxicol. Sci. 58, 339–349. [DOI] [PubMed] [Google Scholar]
- Pereira E. F., Aracava Y., DeTolla L. J. Jr, Beecham E. J., Basinger G. W. Jr, Wakayama E. J., Albuquerque E. X. (2014). Animal models that best reproduce the clinical manifestations of human intoxication with organophosphorus compounds. J. Pharmacol. Exp. Ther. 350, 313–321. [DOI] [PMC free article] [PubMed] [Google Scholar]
- Pfeifer D., Chung Y. M., Hu M. C. T. (2015). Effects of low-dose bisphenol A on DNA damage and proliferation of breast cells: The role of c-Myc. Environ. Health Persp. 123, 1271–1279. [DOI] [PMC free article] [PubMed] [Google Scholar]
- Ramm S., Todorov P., Chandrasekaran V., Dohlman A., Monteiro M. B., Pavkovic M., Muhlich J., Shankaran H., Chen W. W., Mettetal J. T., et al. (2019). A systems toxicology approach for the prediction of kidney toxicity and its mechanisms in vitro. Toxicol. Sci. 169, 54–69. [DOI] [PMC free article] [PubMed] [Google Scholar]
- Repetto G., del Peso A., Zurita J. L. (2008). Neutral red uptake assay for the estimation of cell viability/cytotoxicity. Nat. Protoc. 3, 1125–1131. [DOI] [PubMed] [Google Scholar]
- Rochester J. R. (2013). Bisphenol A and human health: A review of the literature. Reprod. Toxicol. 42, 132–155. [DOI] [PubMed] [Google Scholar]
- Sakaue M., Ohsako S., Ishimura R., Kurosawa S., Kurohmaru M., Hayashi Y., Aoki Y., Yonemoto J., Tohyama C. (2001). Bisphenol-A affects spermatogenesis in the adult rat even at a low dose. J. Occup. Health 43, 185–190. [Google Scholar]
- Schmitz M. H., Held M., Janssens V., Hutchins J. R., Hudecz O., Ivanova E., Goris J., Trinkle-Mulcahy L., Lamond A. I., Poser I., et al. (2010). Live-cell imaging RNAi screen identifies PP2A-B55alpha and importin-beta1 as key mitotic exit regulators in human cells. Nat. Cell Biol. 12, 886–893. [DOI] [PMC free article] [PubMed] [Google Scholar]
- Setchell B. P. (2008). Blood-testis barrier, junctional and transport proteins and spermatogenesis. Adv. Exp. Med. Biol. 636, 212–233. [DOI] [PubMed] [Google Scholar]
- Shukla S. J., Huang R., Austin C. P., Xia M. (2010). The future of toxicity testing: A focus on in vitro methods using a quantitative high-throughput screening platform. Drug Discov. Today 15, 997–1007. [DOI] [PMC free article] [PubMed] [Google Scholar]
- Singh S., Carpenter A. E., Genovesio A. (2014). Increasing the content of high-content screening: An overview. J. Biomol. Screen 19, 640–650. [DOI] [PMC free article] [PubMed] [Google Scholar]
- Sommer C., Gerlich D. W. (2013). Machine learning in cell biology—teaching computers to recognize phenotypes. J. Cell Sci. 126, 5529–5539. [DOI] [PubMed] [Google Scholar]
- Spade D. J., Hall S. J., Saffarini C. M., Huse S. M., McDonnell E. V., Boekelheide K. (2014). Differential response to abiraterone acetate and di-n-butyl phthalate in an androgen-sensitive human fetal testis xenograft bioassay. Toxicol. Sci. 138, 148–160. [DOI] [PMC free article] [PubMed] [Google Scholar]
- Spade D. J., Hall S. J., Wilson S., Boekelheide K. (2015). Di-n-butyl phthalate induces multinucleated germ cells in the rat fetal testis through a nonproliferative mechanism. Biol. Reprod. 93, 110. [DOI] [PMC free article] [PubMed] [Google Scholar]
- Stossi F., Bolt M. J., Ashcroft F. J., Lamerdin J. E., Melnick J. S., Powell R. T., Dandekar R. D., Mancini M. G., Walker C. L., Westwick J. K., et al. (2014). Defining estrogenic mechanisms of bisphenol A analogs through high throughput microscopy-based contextual assays. Chem. Biol. 21, 743–753. [DOI] [PMC free article] [PubMed] [Google Scholar]
- Sun X., Kovacs T., Hu Y. J., Yang W. X. (2011). The role of actin and myosin during spermatogenesis. Mol. Biol. Rep. 38, 3993–4001. [DOI] [PubMed] [Google Scholar]
- Sutherland V., McIntyre B., Pelch K., Waidyanatha S., Conley J. M., Gray L. E., Foster P. M. (2017). A Comparison of In Vivo Reproductive and Developmental Toxicity (DART) Endpoints for Bisphenol AF and Bisphenol A2017, Baltimore, Maryland, Vol. Abstract No 1188.
- Takao T., Nanamiya W., Nagano I., Asaba K., Kawabata K., Hashimoto K. (1999). Exposure with the environmental estrogen bisphenol A disrupts the male reproductive tract in young mice. Life Sci. 65, 2351–2357. [DOI] [PubMed] [Google Scholar]
- Tarca A. L., Carey V. J., Chen X-w., Romero R., Drăghici S. (2007). Machine learning and its applications to biology. PLoS Comput. Biol. 3, e116–963. [DOI] [PMC free article] [PubMed] [Google Scholar]
- Tiwari D., Vanage G. (2013). Mutagenic effect of Bisphenol A on adult rat male germ cells and their fertility. Reprod. Toxicol. 40, 60–68. [DOI] [PubMed] [Google Scholar]
- Vandenberg L. N., Hauser R., Marcus M., Olea N., Welshons W. V. (2007). Human exposure to bisphenol A (BPA). Reprod. Toxicol. 24, 139–177. [DOI] [PubMed] [Google Scholar]
- Vidal J. D., Whitney K. M. (2014). Morphologic manifestations of testicular and epididymal toxicity. Spermatogenesis 4, e979099.. [DOI] [PMC free article] [PubMed] [Google Scholar]
- Wang H. F., Liu M., Li N., Luo T., Zheng L. P., Zeng X. H. (2016). Bisphenol A impairs mature sperm functions by a Catsper-relevant mechanism. Toxicol. Sci. 152, 145–154. [DOI] [PubMed] [Google Scholar]
- Wong E. W. P., Mruk D. D., Cheng C. Y. (2008). Biology and regulation of ectoplasmic specialization, an atypical adherens junction type, in the testis. Biochim. Biophys. Acta, Biomembr. 1778, 692–708. [DOI] [PMC free article] [PubMed] [Google Scholar]
- Yin L., Wei H., Liang S., Yu X. (2017). An animal-free in vitro three-dimensional testicular cell co-culture model for evaluating male reproductive toxicants. Toxicol. Sci. 159, 43–60. [DOI] [PMC free article] [PubMed] [Google Scholar]
- Zanella F., Lorens J. B., Link W. (2010). High content screening: Seeing is believing. Trends Biotechnol. 28, 237–245. [DOI] [PubMed] [Google Scholar]
- Zink D., Fischer A. H., Nickerson J. A. (2004). Nuclear structure in cancer cells. Nat. Rev. Cancer 4, 677–687. [DOI] [PubMed] [Google Scholar]


