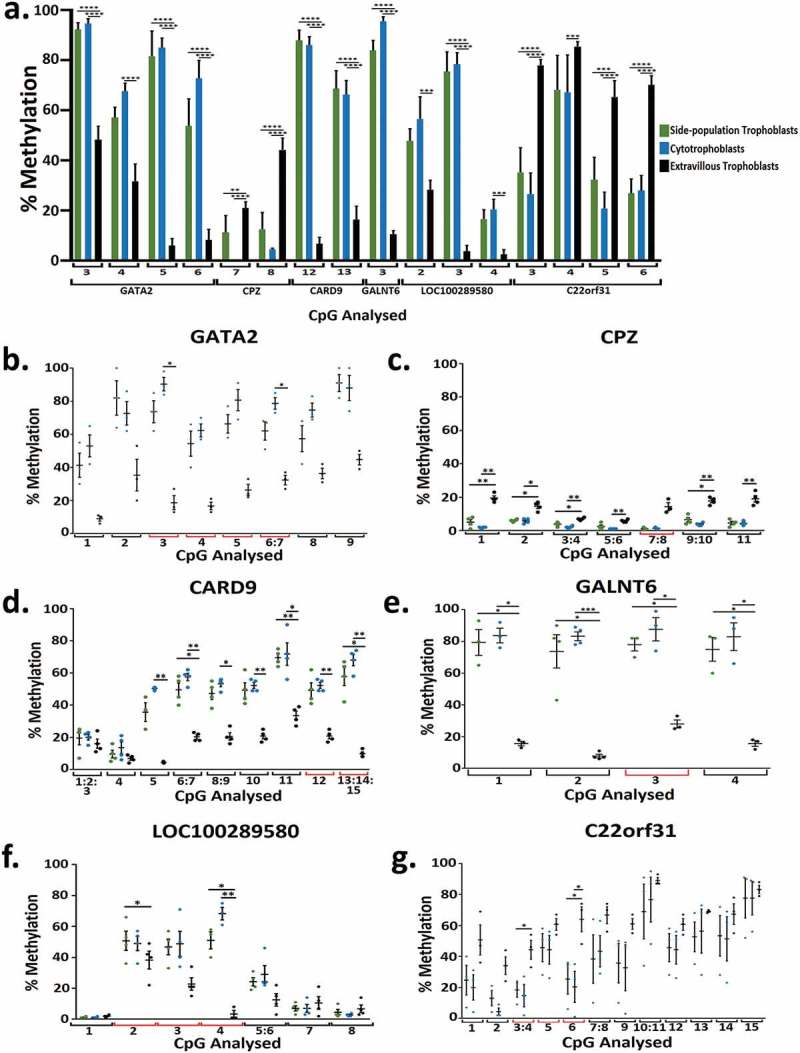
Figure 4.

(a) Bar graph of the percentage methylation at 16 CpG across 6 genes that were significantly differentially methylation when analysed using RRBS and chosen for further validation using Sequenom methylation analysis in side-population trophoblasts, cytotrophoblasts and extravillous trophoblasts. Each number correlates to the CpG in the Sequenom amplicon presented in Figure 4 plots B-G. (b-g) Dot plots showing percentage methylation of CpGs in GATA2 (b), CPZ (c), CARD9 (d), GALNT6 (e), LOC100289580 (f), and C22orf31 (g) in SP, CTB, and EVT when analysed by Sequenom MassARRAY EpiTYPER Analysis. * indicates an adjusted p value ≤0.05 and ** indicates an adjusted p value ≤0.01, *** indicates an adjusted p value ≤0.001, **** indicates an adjusted p value ≤0.0001. Error bars SEM.
