. 2019 Dec 30;8:e52983. doi: 10.7554/eLife.52983

Figure 1. Overview of the ESX-3 tagging, purification, and structure.

(A) The ESX-3 operon in M. smegmatis and the placement of the purification tag. Genomic deletion of ideR derepresses ESX-3 to boost expression for purification. (B) SDS-PAGE of purified ESX-3 shows four major bands corresponding to EccB3, EccC3, EccD3, and EccE3. (C) Blue native page of the purified ESX-3 complex shows a large molecular weight band around 900 kDa. (D) Merged maps of all focused refinement maps (gray transparency) of the ESX-3 dimer filtered to 10 Å resolution. The transmembrane and upper cytoplasmic focused maps (3.7 Å) are segmented by subunit showing one copy per protomer of EccB3 (pink), EccC3 (blue), EccE3 (orange), EccD3-bent (yellow), and EccD3-extended (green). (E) Atomic models of the transmembrane and upper cytoplasmic regions. (F) A combined map of the full complex filtered to 10 Å resolution (gray transparency) with full models for each protein, EccD3-bent (yellow), EccD3-extended (green), EccE3 (orange), EccC3 (blue), and EccB3 (pink).

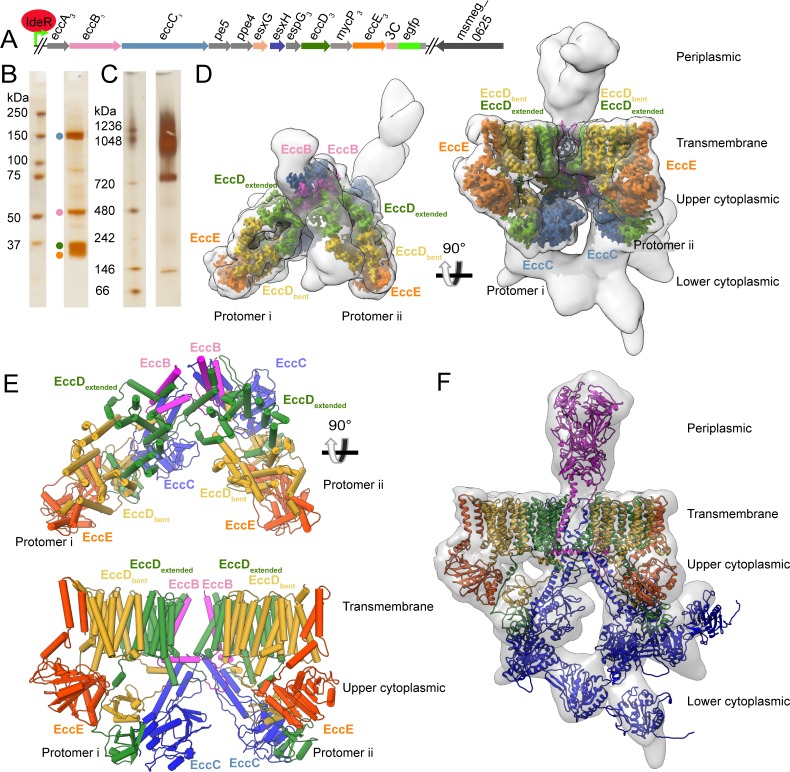
Figure 1.

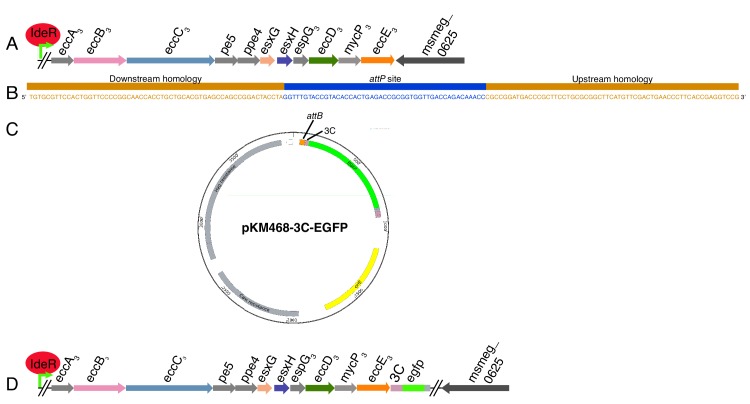
Figure 1—figure supplement 1. ORBIT tagging of the chromosomal copy of EccE3.

Figure 1—figure supplement 1.

(A) Diagram of the ESX-3 operon in M. smegmatis mc(2)155. (B) The targeting oligo used to insert the attP site into the chromosome. (C) The tagging plasmid.(D) Cartoon of the resulting change to the chromosome after ORBIT.

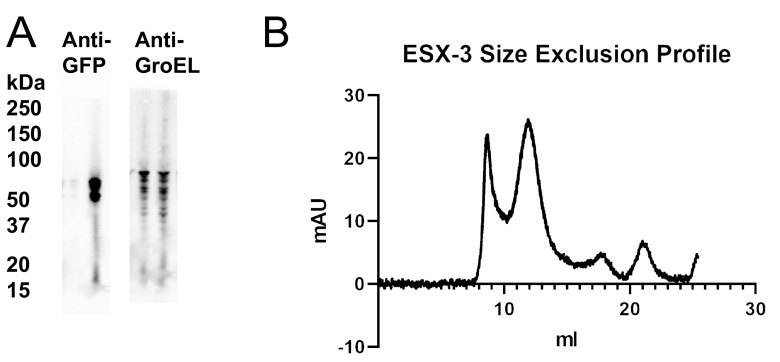
Figure 1—figure supplement 2. ESX-3 dimer purification optimization.

Figure 1—figure supplement 2.

(A) Western blot of solubilized cell material with EccE3 tagged with EGFP. Lane 1, wild type background. Lane 2, ΔideR background. (B) Size exclusion profile for the ESX-3 dimer purified on a Superose 6 10/300column.

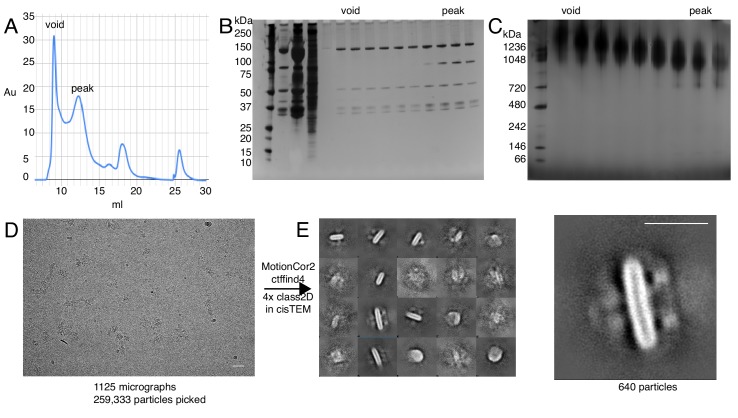
Figure 1—figure supplement 3. Examination of the void volume.

Figure 1—figure supplement 3.

(A) Size exclusion profile with void volume and peak fractions indicated. (B) SDS-PAGE of all fractions from the beginning of elution until the end of the peak fraction. (C) BN-PAGE of the void and peak fractions (D) Cryo-EM of the void volume. Scale bar 50 nm (E) 2D class averages of the particles picked from the void volume, some classes reveal possible higher order oligomers. Scale bar 20 nm.

Figure 1—figure supplement 4. Initial data collection and initial model generation.

Figure 1—figure supplement 4.

An initial data set was collected on a Talos Arctica microscope. The final refinement from this data processing was used as the starting model for future data processing.

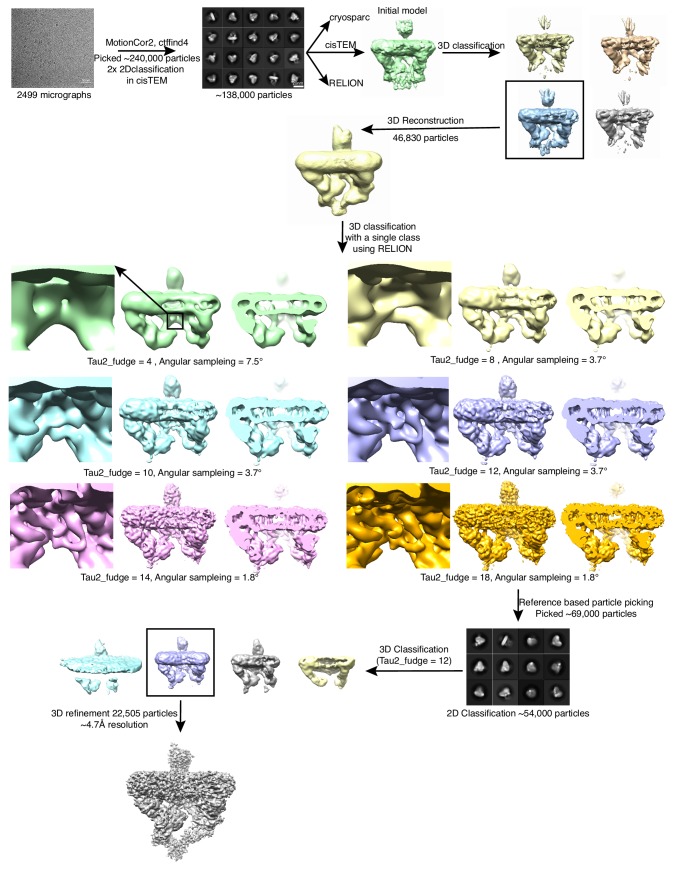
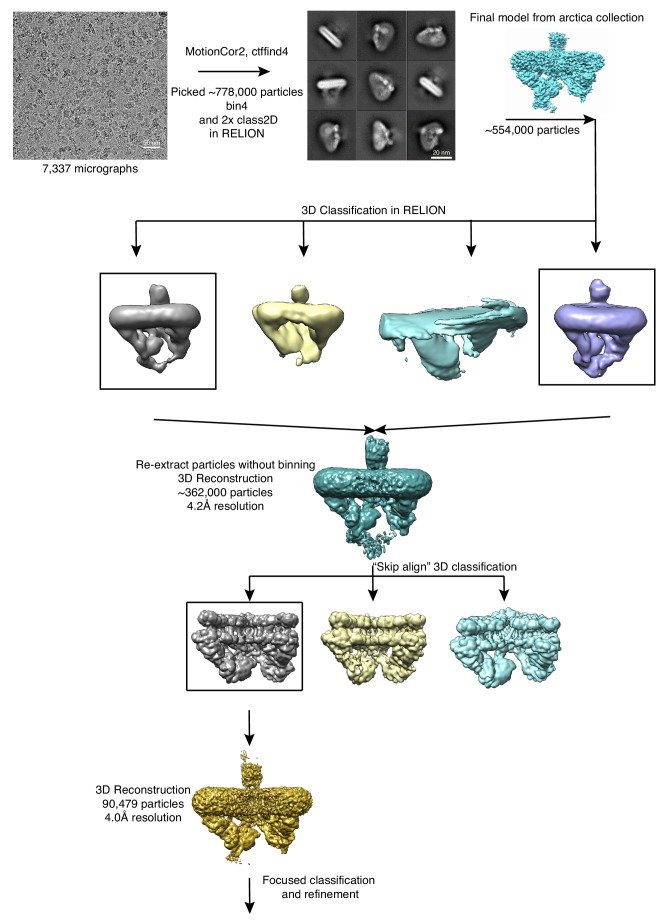
Figure 1—figure supplement 5. Data processing workflow for final data collection.

Figure 1—figure supplement 5.

Data was collected on a Titan Krios. Particles from the final reconstruction were subsequently used for focused classification and refinement.

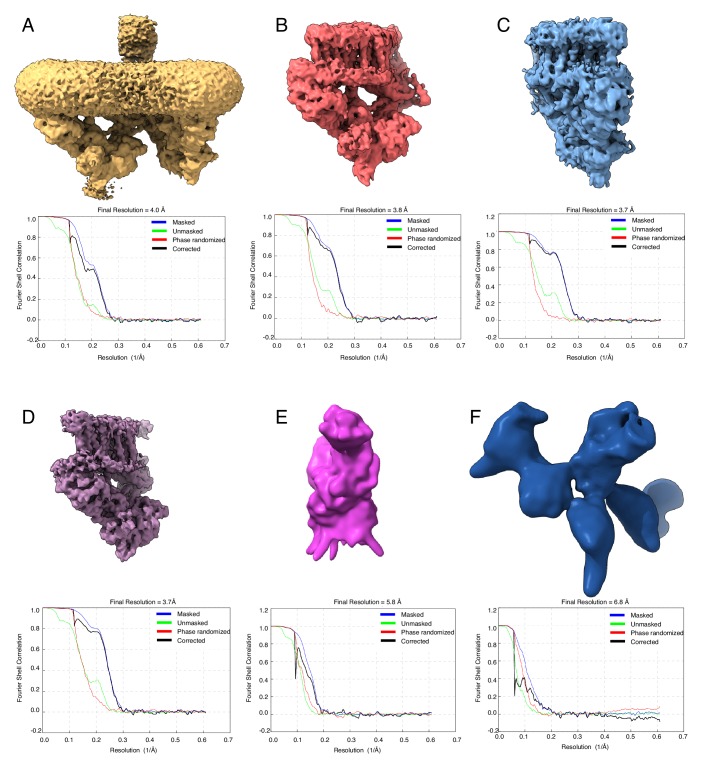
Figure 1—figure supplement 6. Consensus and focused refinements.

Figure 1—figure supplement 6.

(A) Consensus refinement map and FSC curve for the ESX-3 complex. Focused refinement maps and FSC curves for (B) the left protomer of the ESX-3 complex, (C) the right protomer of the ESX-3 complex, (D) a symmetry expanded protomer, (E) the periplasmic domain of EccB and (F) the lower ATPase domains of EccC. All maps are unsharpened and unmasked.