Abstract
Central to cellular metabolism and cell proliferation are highly conserved signalling pathways controlled by mammalian target of rapamycin (mTOR) and AMP-activated protein kinase (AMPK)1,2, dysregulation of which are implicated in pathogenesis of major human diseases such as cancer and type 2 diabetes. AMPK pathways leading to reduced cell proliferation are well established and, in part, act through inhibition of TOR complex-1 (TORC1) activity. Here we demonstrate reciprocal regulation, specifically that TORC1 directly down-regulates AMPK signalling by phosphorylating the evolutionarily conserved residue Ser367 in the fission yeast AMPK catalytic subunit Ssp2, and AMPK α1Ser347/α2Ser345 in the mammalian homologs, which is associated with reduced phosphorylation of activation loop Thr172. Genetic or pharmacological inhibition of TORC1 signalling led to AMPK activation in the absence of increased AMP:ATP ratios; under nutrient stress conditions this was associated with growth limitation in both yeast and human cell cultures. Our findings reveal fundamental, bi-directional regulation between two major metabolic signalling networks and uncover new opportunity for cancer treatment strategies aimed at suppressing cell proliferation in the nutrient-poor tumor microenvironment.
The fundamental biological process of cell growth is largely dictated by the nutrient state of the local environment. Thus, all eukaryotes employ multiple nutrient-sensing pathways to adjust growth and development to constantly changing resource conditions. mTOR and AMPK have emerged as major nutrient sensors and are now considered master regulators of cell growth and energy homeostasis, regulating most arms of metabolism. The AMPK complex is an αβγ heterotrimer containing a catalytic α-subunit (isoforms α1 and α2) and regulatory β (β1, β2) and γ (γ1, γ2, γ3) subunits that can be activated in response to physiological and pathological processes which result in elevated intracellular AMP/ATP and ADP/ATP ratios. Exchange of ATP for AMP or ADP at γ-subunit nucleotide sites leads to phosphorylation of α-Thr172 in the kinase domain activation loop by LKB1 and CaMKK2(3). Thr172 phosphorylation by LKB1 has been reported to occur on the late endosome/lysosome surface, mediated by formation of an axin1-scaffold complex consisting of AMPK and LKB1 docking to the resident lysosomal protein complex v-ATPase-Ragulator4.
In fission yeast (Schizosaccharomyces pombe) Ssp2, Amk2 and Cbs2 represent α, β and γ subunits, respectively5. We previously reported that the Ssp2-AMPK complex was activated by activation loop phosphorylation (Thr189) in response to nitrogen stress and this occurred independently of AMP/ATP levels6. To investigate potential mechanistic roles for hierarchical/regulatory phosphorylation sites we selected Ssp2-Ser367 (analogous to AMPK α1-Ser347), previously identified in proteome-wide studies7–10 and highly conserved through evolution (Fig. 1a). In humans, α1-Ser347 is located between regulatory elements RIM1 and RIM2, important for AMP-sensing (Fig. 1b)11. To assess the impact of phosphorylation of this residue we generated yeast knock-in (KI) strains harbouring Ssp2-Ser367 mutations in the native ssp2 locus. The Ssp2-Ser367Ala mutant (to preclude phosphorylation) was associated with reduced cell growth when the TOR inhibitor Torin1 was added to the growth media to mimic nutrient stress (Fig. 1c,d). Furthermore, cell length and therefore cell size at division, an indicator of suppressed TORC1 activity12, was reduced in the Ser367Ala KI compared to wild type (Fig. 1e). Conversely, mutation of Ser367 to the phosphomimetic residue Asp enhanced growth under low energy conditions (1% sucrose as sole carbon source or combined 3% gluconate + 0.05% glucose), indicating desensitization of Ssp2 to nutrient stress (Fig 1c). Ser367Ala, but not Ser367Asp, mutant Ssp2-AMPK complexes displayed increased Thr189 activation loop phosphorylation compared to wild type (Fig. 1f) and phosphorylation of the Scr1 transcription factor, a known substrate of Ssp2-AMPK complexes13, was increased in the Ser367Ala mutant (see Extended Data Fig. 1a). Together these observations indicate that Ssp2-pSer367 exerts a suppressive effect on AMPK kinase activity and signaling.
Figure 1. Ssp2-Ser367Ala is associated with increased activating phosphorylation and reduced cell growth when nutrient stressed.
a) Sequence alignment of Ssp2-S367 and homologs. b) Proximity of AMPK α1-S347 to AMP in γ-site 3 and the β-loop, from PDB: 4CFH (39). Green: α1; orange: α1 regulatory-subunit-interacting motif (RIM) 1; cyan, β2; magenta, γ1. Growth characteristics of Ssp2-S367 mutants in response to c) low energy media (1% sucrose or 3% gluconate + 0.05% glucose) and d) torin1. For all growth assays similar results was obtained for three independent biological repeats e) Cell length, and therefore cell size, at division is reduced in the Ssp2-S367A mutant compared to wild type and Ssp2-S367D. Error bars, mean cell length vs. WT ± s.e.m., n = 100. Statistical significance was calculated using one-way ANOVA with Dunnett’s multiple comparisons test. f) Elevated pT189 in the Ssp2-S367A mutant. Lysates were prepared from indicated cells and immunoblotted for pT189. Error bars, mean fold change in phosphorylation vs. WT ± s.e.m., n = 3. Statistical significance was calculated using one-way ANOVA with Dunnett’s multiple comparisons test. n represent biological independent experiments. Representative immunoblots are shown.
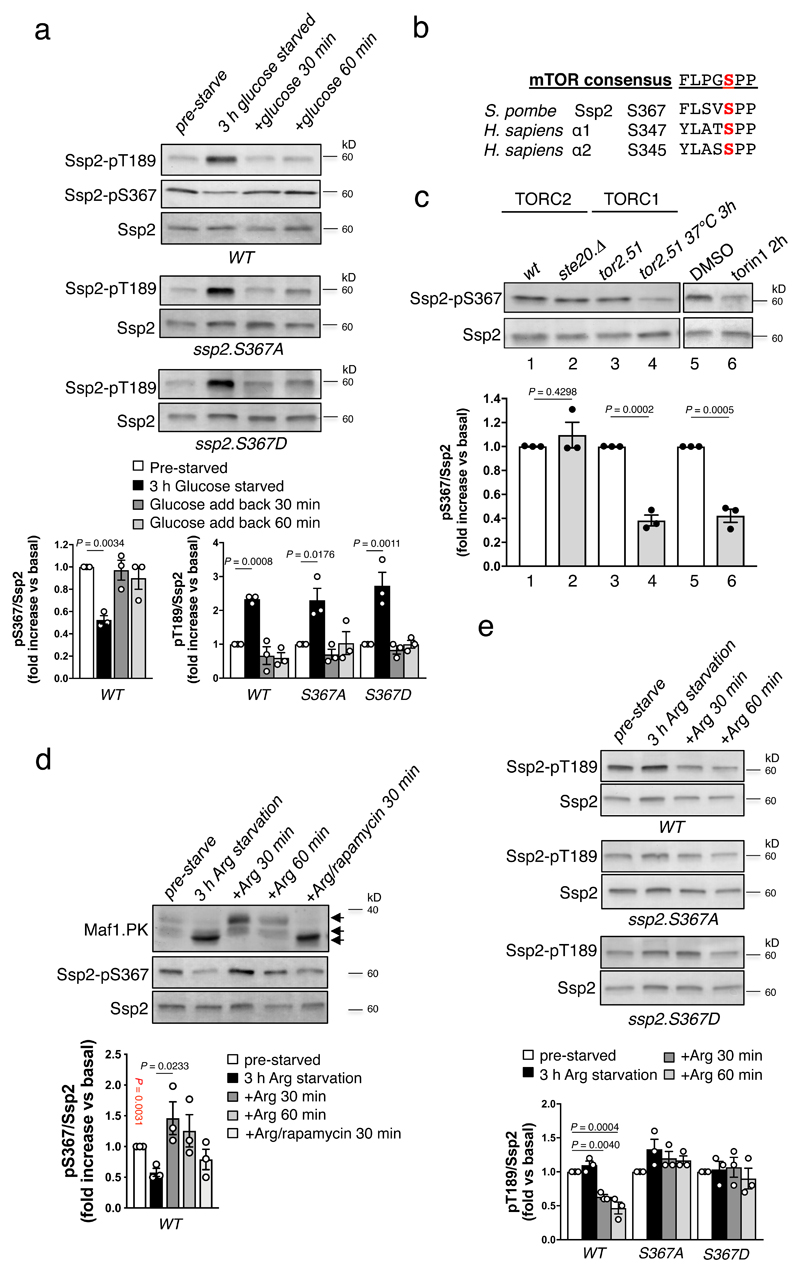
Since AMPK performs a major role as a sensor of cellular energy stress we studied how pThr189 and pSer367 are regulated in response to altered nutrient conditions. In wild type, Ser367Ala and Ser367Asp S. pombe cells, exposure to conditions of glucose starvation resulted in an increase in pThr189, which was reversed by glucose resupplementation in all three strains (Fig. 2a), indicating that Ssp2-AMPK complex activation by energy depletion is unaffected by the status of Ssp2-Ser367 phosphorylation. Phosphorylation of Ssp2-Ser367 in wild type cells (monitored using a de novo generated phosphospecific antibody validated against bacterial-expressed Ssp2 and Ssp2-Ser367Ala and Ser367Asp KI mutants (see Supplementary Fig. 1a,b)) followed an inverse profile, being significantly decreased after glucose starvation and returning to basal levels within 30 min of glucose re-addition (Fig. 2a). Phosphorylation of the TORC1-specific substrate Maf1(14) also decreased after glucose starvation and returned to basal levels within 30 min of glucose re-addition (see Extended Data Fig. 1b). Thus, levels of Ser367 phosphorylation are highest when Ssp2-AMPK complex activity is low, a scenario commensurate with elevated TORC1 activity.
Figure 2. TORC1 dependent regulation of Ssp2-Ser367 phosphorylation.
a) Lysates were prepared from indicated S. pombe strains and growth conditions and immunoblotted for Ssp2-pT189 and pS367. Error bars, mean fold change in phosphorylation vs. pre-starved ± s.e.m., n = 3. Statistical significance was calculated using one-way ANOVA with Dunnett’s multiple comparisons test. b) The sequences surrounding Ser367 in Ssp2 and its human orthologs resemble mTOR consensus motifs. c) The thermosensitive tor2.51 strain was grown at restrictive temperature 37 °C for 3 h to inhibit TORC1. Combined TORC1 and TORC2 signalling in WT S. pombe was inhibited by torin1. Prepared lysates were immunoblotted for Maf1-PK and Ssp2-pS367. Error bars, mean fold change in phosphorylation vs. WT or basal ± s.e.m., n = 3. Statistical significance was calculated using unpaired, two-tailed Student’s t test. d) Lysates from WT S. pombe, treated as indicated, were prepared and immunoblotted for Maf1-PK and Ssp2-pS367. Error bars, mean fold change in phosphorylation vs. basal ± s.e.m., n = 3. Statistical significance vs. 3 h Arg starvation was calculated using unpaired, two-tailed Student’s t test (red P value) or one-way ANOVA with Dunnett’s multiple comparisons test (black P value). e) Lysates were prepared from indicated S. pombe strains and growth conditions and immunoblotted for Ssp2-pT189. Error bars, mean fold change in phosphorylation vs. pre-starved ± s.e.m., n = 3. Statistical significance was calculated using one-way ANOVA with Dunnett’s multiple comparisons test. n represent biological independent experiments. Representative immunoblots are shown.
The sequences surrounding Ser367 in Ssp2 and its orthologs are favourable as mTOR consensus motifs (https://www.phosphosite.org/proteinAction.action?id=564&showAllSites=true) (Fig. 2b). Indeed, genetic (temperature sensitive mutation15) or pharmacological suppression of TORC1, but not TORC2 (deletion of the TORC2-specific Rictor homolog ste20), activity led to significant reductions in pSer367 (Fig. 2c and see Extended Data Fig. 1c), whereas heat stress did not impact pSer367 in wild type cells (see Extended Data Fig. 1d). TORC1 activity is also inhibited by amino acid starvation16, a response we previously showed to be Ssp2-AMPK complex independent6. Consistent with Ser367 being regulated by TORC1, arginine starvation/resupplementation of wild type cells produced a reversible reduction in phosphorylation of both Ssp2-Ser367 and Maf1 (Fig. 2d), with return to control levels following arginine resupplementation; however, this recovery was blocked by incubation with the TORC1 inhibitor rapamycin (Fig. 2d). Arginine starvation did not significantly increase Ssp2 pThr189, however phosphorylation at this site was markedly reduced with arginine resupplementation (Fig. 2e). Additionally, arginine resupplementation failed to reduce pThr189 in S. pombe Ser367Ala and Ser367Asp KI cells (Fig. 2e), whereas the phosphorylation profiles of Maf1 in response to arginine starvation/resupplementation in these cells matched wild type (see Extended Data Fig. 1e). Thus, Ser367Ala and Ser367Asp mutant Ssp2-AMPK complexes remained sensitive to energy-stress (AMP/ADP binding to γ-sites), but not to TORC1 dependent amino-acid sensing. Combined, our observations in S. pombe are consistent with TORC1-dependent regulation of Ssp2-pSer367, leading to reduced pThr189.
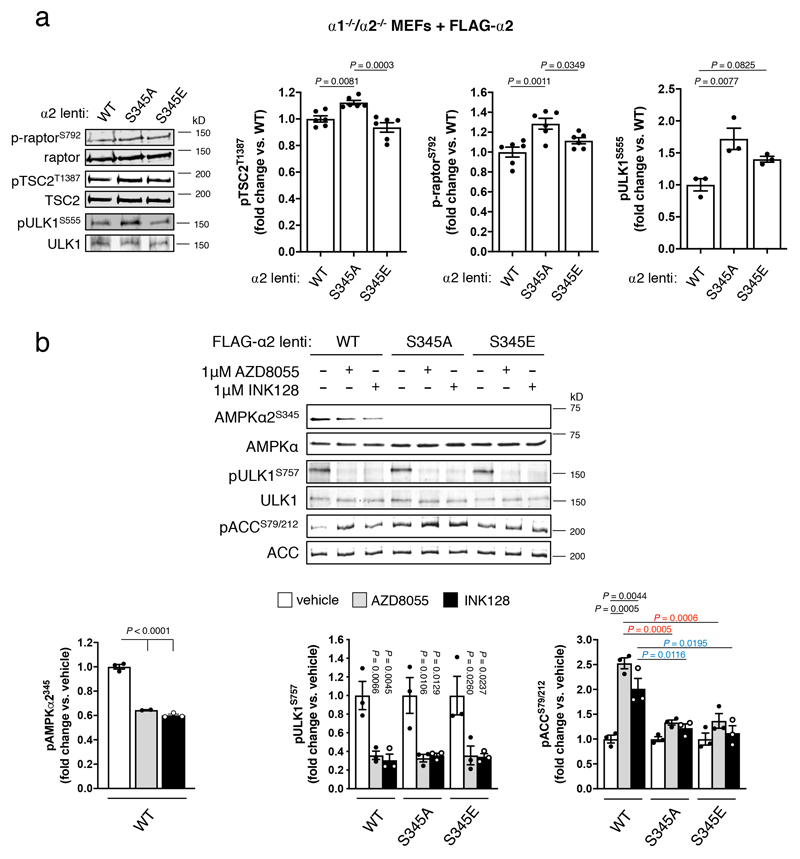
To investigate the significance of phosphorylation at the analogous residues in mammalian AMPK (α1-Ser347 and α2-Ser345), we first validated a commercially available AMPK α2-pSer345 phosphospecific antibody against AMPKα1-/-/α2-/- MEFs lentivirally expressing human WT, or Ser345Ala and Ser345Glu mutated, FLAG-α2 (see Extended Data Fig. 2a)17. We detected α2-pSer345 in a range of cultured mammalian cell lines and mouse liver under basal conditions, in α2 from human vastus lateralis skeletal muscle, and in all recombinant α2 AMPK complexes expressed in COS7 mammalian cells (see Extended Data Fig. 2b-d). Consistent with the suppressive role for this phosphorylation event in S. pombe (Fig. 1f), expression of α2-Ser345Ala mutant AMPK in α1-/-/α2-/- MEFs resulted in basally elevated pThr172 (Fig. 3a), and AMPK activity (Fig. 3b) and signaling, as evidenced by increased phosphorylation of the AMPK substrates ACC-Ser79, (Fig. 3a), raptor-Ser792, TSC2-Thr1387 and ULK1-Ser555 (see Extended Data Fig. 3a), relative to WT-α2. Expression of the phosphomimetic mutant α2-Ser345Glu in α1-/-/α2-/- MEFs resulted in significant reductions in AMPK activity, pThr172, pACC, p-raptor and pTSC2 relative to α2-Ser345Ala, whereas ULK1-pSer555 was not significantly increased compared to WT (Fig. 3a,b and see Extended Data Fig. 3a).
Figure 3. mTORC1 phosphorylation of mammalian AMPK α-S345 negatively regulates cellular pT172 and AMPK signalling.
α1 or α2 (FLAG constructs of WT, S345A or S345E) was expressed in immortalized MEFs harbouring genetic deletion of both AMPK α1 and α2 (α1-/-/α2-/- MEFs). Lysates were prepared from cells incubated in 25 mM glucose and a) immunoblotted for α-pT172 and ACC-pS77/212, or b) FLAG immunoprecipitated AMPK assayed for activity. For a): Error bars, mean fold change in phosphorylation vs. WT ± s.e.m., n = 3. For b): Error bars, mean AMPK activity (nmol.min-1.mg-1) ± s.e.m., n = 3. Statistical significance was calculated using one-way ANOVA with Dunnett’s multiple comparisons test. c) Rapamycin (1 h) treatment of FLAG-α2-expressing α1-/-/α2-/- MEFs. Error bars, mean fold change in phosphorylation vs. vehicle ± s.e.m., n = 3. Statistical significance was calculated using one-way ANOVA with Dunnett’s multiple comparisons test. d) Glucose starvation (4 h) of differentiated C2C12 myotubes. Error bars, mean fold change in phosphorylation vs. basal ± s.e.m., n = 3. Statistical significance was calculated using unpaired, two-tailed Student’s t test. n represent biological independent experiments. Representative immunoblots are shown.
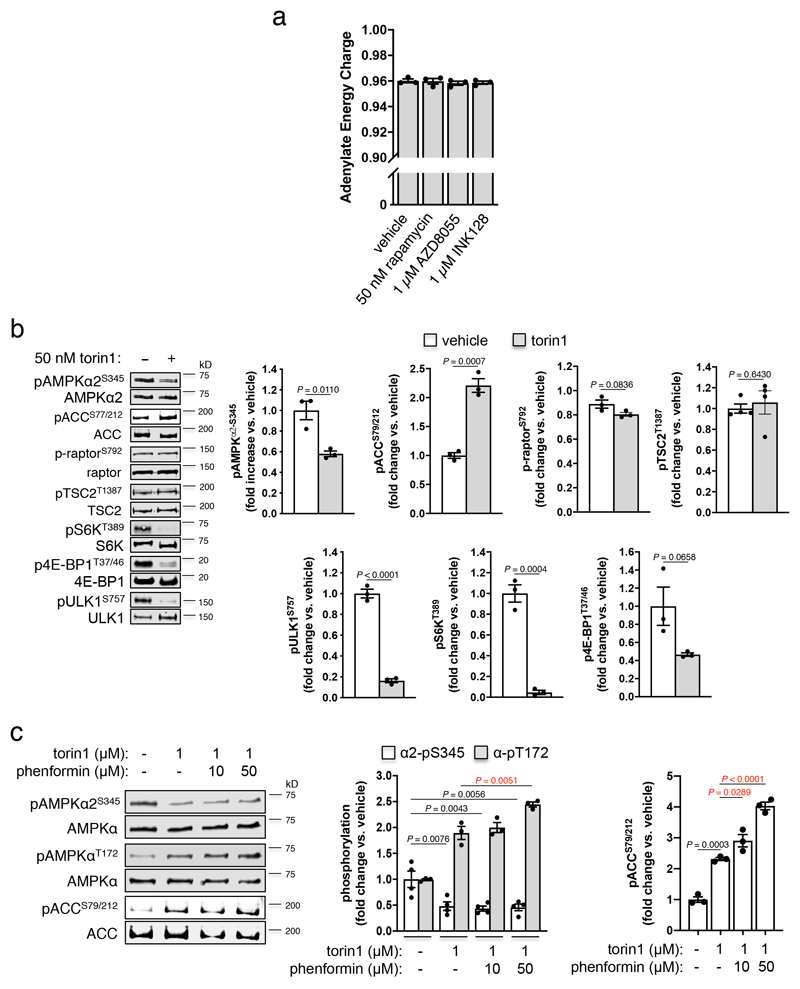
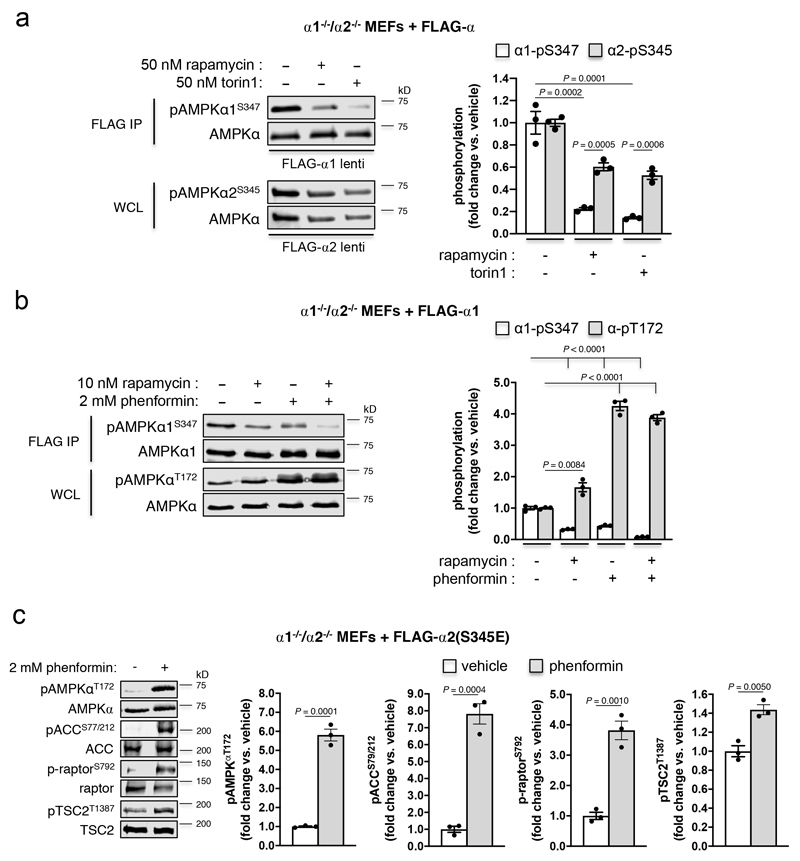
Using purified enzymes, we found that mTORC1 phosphorylated α1-Ser347 and α2-Ser345 in kinase-dead AMPK α1(Asp139Ala)β2γ1 and α2(Asp141Ala)β1γ1, respectively (see Extended Data Fig. 2e,f and Supplementary Fig. 1c). α2-pSer345 was diminished ~40%, and pThr172 elevated 1.5-fold, in FLAG-α2 AMPK-expressing α1-/-/α2-/- MEFs following acute exposure to the mTORC1 inhibitor rapamycin (Fig. 3c); this occurred independently of changes in adenylate energy charge (see Extended Data Fig. 4a). Similar decreases in pSer345, accompanied by increased pThr172 and pACC, were observed in these cells following incubation with the mTOR inhibitors torin1 (see Extended Data Fig. 4b,c), AZD8055 and INK128 (see Extended Data Fig. 3b), however torin1-induced AMPK activation did not translate to elevations in p-raptor or pTSC2 (see Extended Data Fig. 4b). AZD8055- and INK128-induced increases in pACC were significantly ablated in α1-/-/α2-/- MEFs expressing α2-Ser345Ala or Ser345Glu mutants (see Extended Data Fig. 3b). As for rapamycin, none of these mTOR inhibitors perturbed adenylate energy charge (see Extended Data Fig. 4a). AMPK activation by sub-maximal treatment with phenformin (an indirect AMPK activator that elevates AMP/ATP ratio) was additive to the stimulating effects of torin1 (see Extended Data Fig. 4c). Induction of mTORC1 inhibition in WT α2 AMPK-expressing α1-/-/α2-/- MEFs by serum starvation also significantly reduced α2-pSer345 and increased pThr172, both of which were rapidly restored to serum replete levels following re-addition of serum or insulin (see Extended Data Fig. 5a,b). We attribute recovery of α2-Ser345 phosphorylation to serum/nutrient-mediated mTORC1 signalling, since the effect was lost in α2-expressing MEFs in which raptor protein expression had been knocked down ~70% by treatment with 4-OHT, leading to loss of mTORC1 integrity (see Extended Data Fig. 5c)18. α1-pSer347 was significantly more sensitive to mTORC1 inhibition than α2-pSer345, being reduced ~80-85% by rapamycin or torin1 (see Extended Data Fig. 6a). The suppressive effect of rapamycin on α1-pSer347 was augmented by additional exposure to phenformin, which was demonstrated to inhibit mTORC1 signalling via AMPK-mediated phosphorylation of raptor-Ser792(19), resulting in almost complete loss of α1-pSer347 (see Extended Data Fig. 6b). Adenine-nucleotide sensing by the α2-Ser345Glu mutant remained intact, since incubation with phenformin induced phosphorylation of Thr172 and AMPK substrates in α1-/-/α2-/- MEFs exclusively expressing this complex (see Extended Data Fig. 6c). Collectively, these data provide strong evidence that mammalian AMPK residues α1-Ser347/α2-Ser345 are both direct substrates for mTORC1, with phosphorylation leading to suppression of AMPK signalling independently of ATP-binding to γ-nucleotide sites in the high energy state.
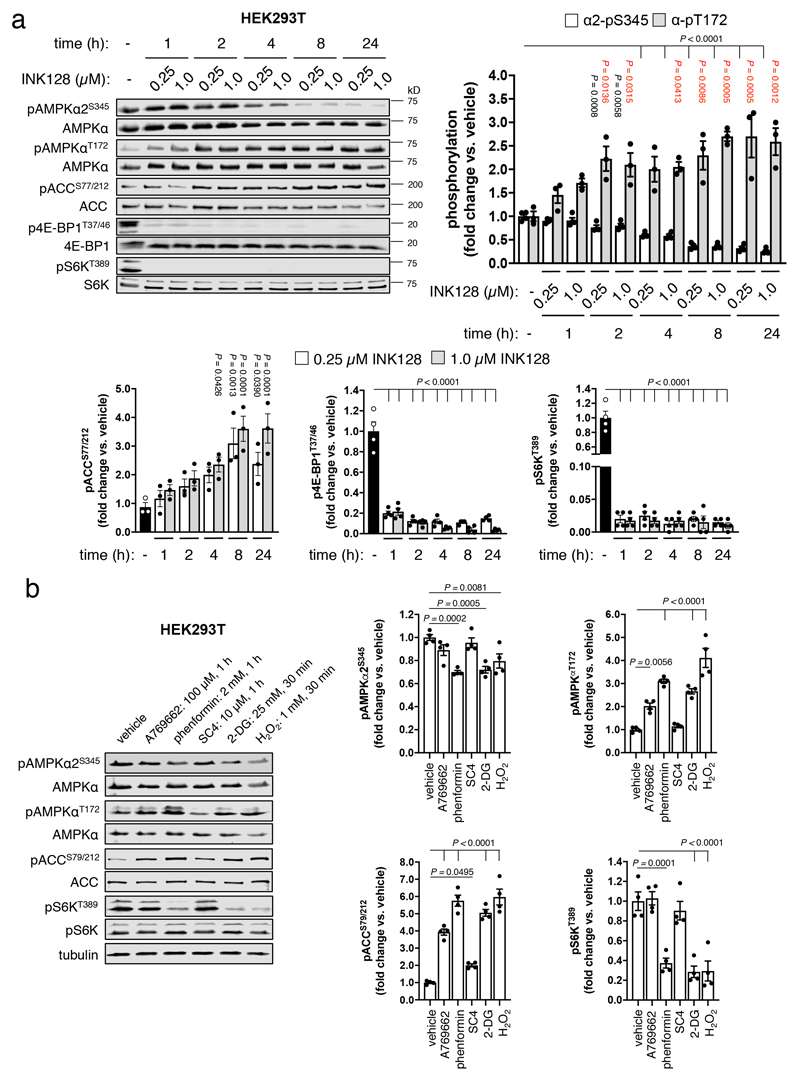
Consistent with these observations, endogenous α2-pSer345 was diminished, and pThr172 and AMPK signalling increased, in differentiated C2C12 myotubes following 4 h glucose starvation (Fig. 3d), or in HEK293T cells exposed to INK128 (see Extended Data Fig. 7a) or phenformin, 2-deoxyglucose (2-DG) and H2O2 (see Extended Data Fig. 7b). In contrast, direct AMPK agonists A769662 and SC4(20), while triggering AMPK signalling, failed to suppress mTORC1 activity since both S6K-pThr389 and α2-pSer345 remained unchanged under the conditions used. The inability of AMPK activation by small-molecule drugs to translate to mTORC1 signaling suppression has been reported previously21,22; whilst a molecular explanation for this is unknown, it may be due to the nutrient replete condition driving competing AMPK-independent activation of mTORC1.
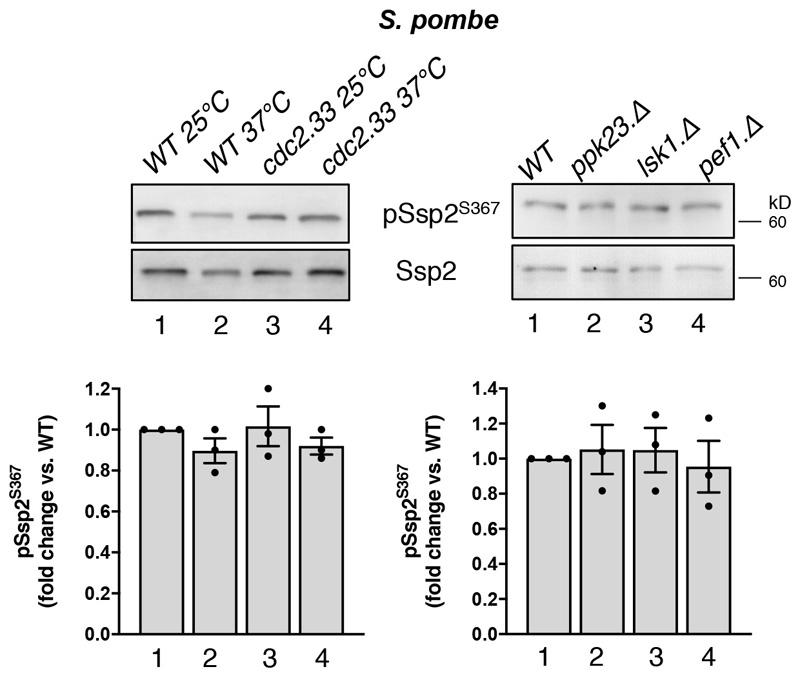
α2-Ser345 was recently reported as a substrate for CDK4, although analysis was largely confined to phosphorylation of a purified, truncated α2 fragment23, and the α2-Ser345 site does not possess the sufficient basic character generally indicative of bona fide CDK4 substrates. Individual knockout of yeast CDKs including Cdc2, Lsk1, Pef1 and Ppk23 did not reduce Ssp2-pSer367 (see Extended Data Fig. 8 – importantly fission yeast does not have a clear homolog of CDK4).
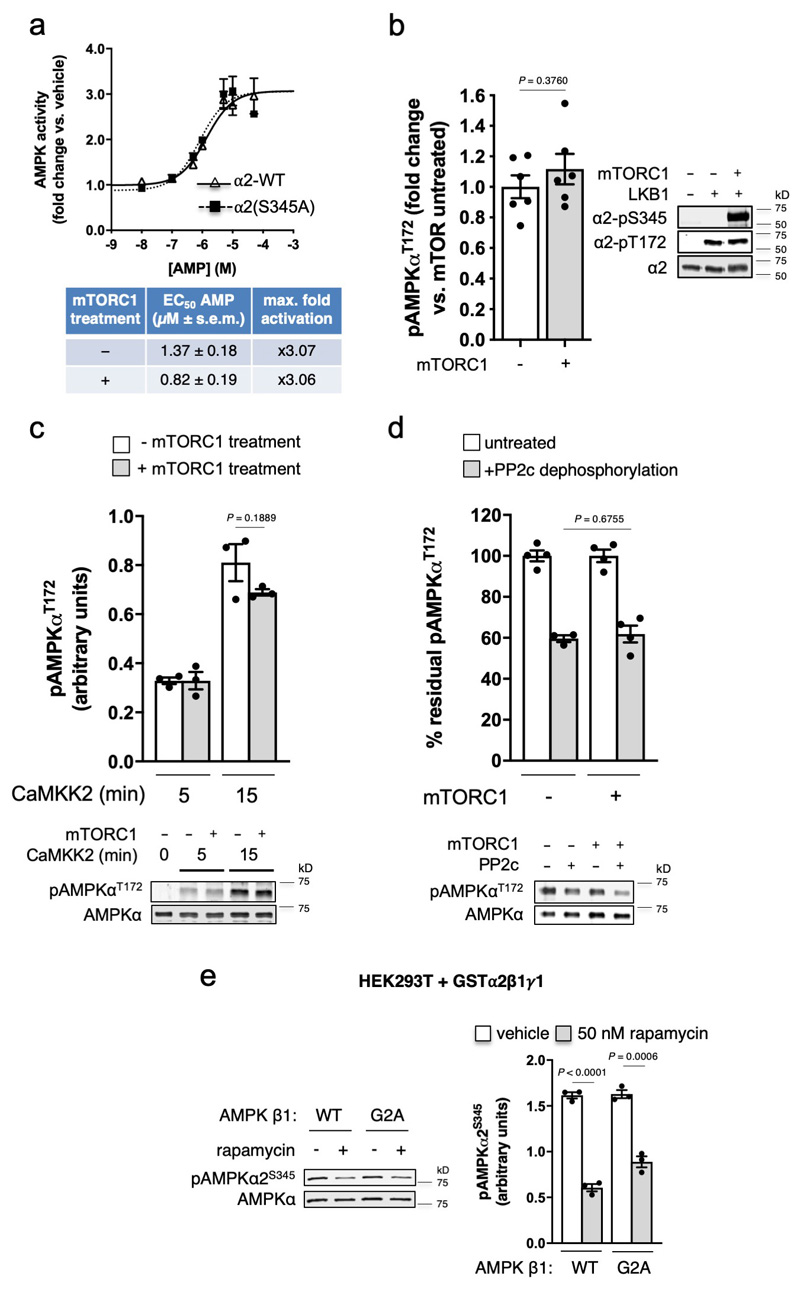
To further examine the role of α2-Ser345 phosphorylation we investigated whether this modification influenced any of the primary AMPK regulatory mechanisms. FLAG-α2 WT and Ser345Ala mutant AMPK immunoprecipitated from α1-/-/α2-/- MEFs demonstrated a similar response to AMP allosteric activation (see Extended Data Fig. 9a). mTORC1 pretreatment of purified, bacterial-expressed AMPK also had no significant effect on rates of Thr172 phosphorylation by LKB1 or CaMKK2 (see Extended Data Fig. 9b,c), or pThr172 dephosphorylation by phosphatase PP2c (see Extended Data Fig. 9d). Notably, phosphorylation of α2-Ser345 in HEK293T cells (basal or rapamycin-induced decrease) was unaffected by myristoylation of the AMPK β-subunit (see Extended Data Fig. 9e), a modification shown to target AMPK to lysosomes after glucose starvation24, indicating that mTORC1-mediated Ser345 phosphorylation/dephosphorylation events likely occur in the cytosol.
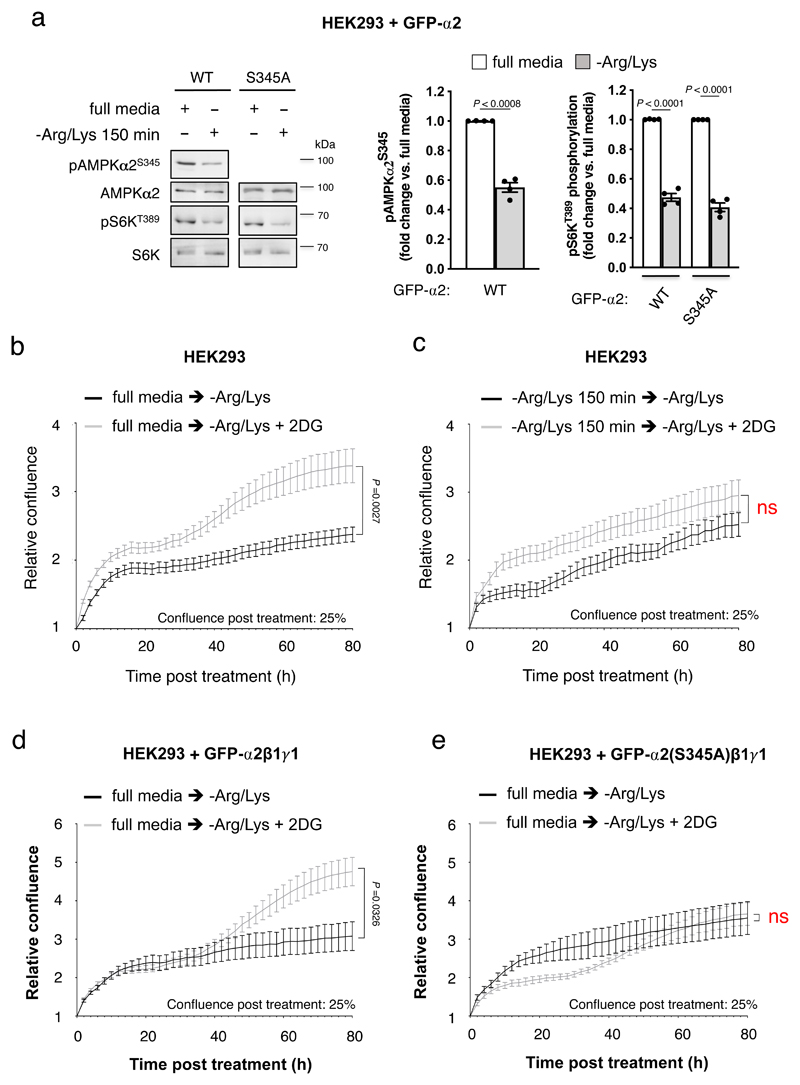
We examined the role of α2-Ser345 phosphorylation in the regulation of cell proliferation under nutrient stress. In HEK293 cells transiently expressing WT or Ser345Ala mutant α2β1γ1 AMPK complexes, exposure to 150 min arginine and lysine starvation (Arg/Lys) reduced mTORC1 activity, as seen by a 50% reduction of S6K-pThr389 in both cell lines and a 50% reduction in α2-pSer345 in α2 WT expressing cells (Fig. 4a). Analysis of cell proliferation in real time by live cell imaging in the IncuCyte system indicated that 150 min Arg/Lys pre-starvation significantly reduced cell proliferation of untransfected cultures exposed to prolonged amino acid stress (see Extended Data Fig. 10a). Energy stress generated by addition of 2-DG to full media reduced cell proliferation as previously reported25; interestingly 2-DG addition at the time of transfer to Arg/Lys free media enhanced cell proliferation, an effect lost with Arg/Lys pre-starvation (which reduced pSer345 Fig. 4a) or expression of α2-Ser345Ala (Fig. 4b-e and see Extended Data Fig. 10b-d). Integrity of AMPK and mTORC1 signalling pathways in Arg/Lys-starved, transfected cells was confirmed by immunoblot, with 2-DG inducing significant increase in pACC and reduction in pS6K, and Arg/Lys re-addition increasing both pS6K and α2-pSer345 (see Extended Data Fig. 10e-h). Finally, the ability of 2-DG to enhance cell proliferation with Arg/Lys deficiency was ablated by incubation with the AMPK/ULK1 dual inhibitor SBI-0206965, an efficient inhibitor of autophagy flux26,27 (see Extended Data Fig. 10i,j). Together, the analysis of cell proliferation under nutrient stress indicates that Arg/Lys pre-starvation (to reduce α-pSer345), or expression of α2-Ser345Ala, was sufficient to block increased cell proliferation under combined amino acid and energy stress likely driven by autophagic processes. Collectively, our data show that α-Ser345 phosphorylation is important for cell proliferation in complex nutrient environments in both yeast and human cells.
Figure 4. α2-S345 phosphorylation promotes cell proliferation under conditions of nutrient stress.
a) Lysates were prepared from GFP-α2β1γ1 AMPK- (WT or α2-S345A mutant) expressing HEK293 cells (treated as indicated) and immunoblotted for AMPKα2-pS345, S6K-pT389 and ACC-pS79/212. Error bars, mean fold change in phosphorylation vs. full media ± s.e.m., n = 4. Statistical significance was calculated using unpaired, two-tailed Student’s t test. Real time proliferation analysis of HEK293 cells following switch to Arg/Lys free media ± 20 mM 2-deoxyglucose (2-DG) from b) full media, or c) Arg/Lys free media. Real time proliferation analysis of HEK293 cells transiently expressing GFP-α2β1γ1 d) WT or e) GFP-α2-S345A mutant, following switch to Arg/Lys free media ± 20 mM 2-DG from full media. For b-e) Error bars, relative confluence ± s.e.m., n = 8. Statistical significance was calculated using two-way ANOVA with Sidak’s multiple comparisons test. n represent biological independent experiments. Representative immunoblots are shown.
mTORC1 and AMPK co-ordinate major signaling pathways regulating cellular metabolism, growth and proliferation. Consequently, mTOR/AMPK dysregulation is well established as a driver of cell proliferation and survival in nutrient-starved tumor microenvironments, and also implicated in a range of prevalent diseases such as type 2 diabetes, insulin resistance and inflammation28. AMPK inhibits mTORC1 indirectly by activating TSC2(29) to deregulate Rheb GTPase required for mTORC1 activity, and phosphorylating the mTORC1 complex component raptor to promote 14-3-3 binding19. We now report that mTORC1 reciprocally suppresses AMPK activation and signaling by directly phosphorylating α1-Ser347/α2-Ser345. While additional kinases for this substrate likely exist, our data indicate that mTORC1 plays a more prominent role in regulation of α1- than α2-AMPK.
Our findings hint at a degree of substrate specificity following Ser345 dephosphorylation/AMPK activation, in comparison to canonical activation by energy stress; raptor and TSC2 appear to be poor substrates for AMPK activated under energy replete conditions, whereas Ser345 phosphorylation status seemingly has no impact on the range of other AMPK substrates. This substrate specificity may result from the AMPK α-isoform under consideration in our study compared to others19,29, the cellular location at which raptor/TSC2 phosphorylation occurs, or from high activity of raptor and TSC2 phosphatases in the energy replete state. While the mechanism by which α1-Ser347/α2-Ser345 dephosphorylation leads to AMPK activation provides the basis for further investigation, our findings uncover an ancient and fundamental signaling pathway that enables cells to exquisitely co-ordinate nutrient-sensing capabilities with growth rate. We therefore reveal a unique opportunity for therapeutic strategies; against the backdrop of poor vasculature and limited nutrient supply typifying the solid tumor micro-environment, blockade of mTORC1-mediated inhibition of AMPK signaling has the potential to facilitate a novel mode of AMPK activation, which we demonstrate is associated with growth limitation under nutrient stress.
Methods
Reagents and resources
DNA oligos, rapamycin (#R8781), anti-FLAG M2 affinity gel (#A2220), EZview red Anti-HA affinity gel (#E6779), LKB1/STRADα/MO25 (#SRP0246) human FLAG-mTOR/Raptor/MLST8 (#SRP0364), 2-deoxyglucose (#D8375) and SBI-0206965 (#SML1540) were from Sigma. AZD8055 (#A8214) and INK128 (#A8551) were from ApexBio. LY2835219 (#HY-16297A) was from MedChemExpress. Torin1 (#S2827) was from Selleck Chemicals. Insulin (Actrapid) was from Novo Nordisk, Bagsværd, Denmark. FuGENE HD (#E2311) was from Promega Corporation. Lipofectamine 2000 was from Invitrogen (#1168-027). Glutathione Sepharose 4B (#17075601) and streptavidin Sepharose high performance (#17-5113-01) were from GE Life Sciences. 4-hydroxytamoxifen (4-OHT) was from Merck (#579002). Antibodies for pan AMPK α (#2793, clone F6, 1:1,000 dilution), ULK1 (#4773, clone R600, 1:1,000 dilution), S6K, (#9202, 1:1,000 dilution), 4E-BP1 (#9452, 1:1,000 dilution), raptor (#2280, 1:1,000 dilution), TSC2 (#3990, 1:1,000 dilution) and tubulin (#3873, clone DM1A, 1:1,000 dilution), and phosphospecific antibodies for AMPK α-pThr172 (#2535, clone 40H9, 1:1,000 dilution), ACC-pSer79/212 (#3661, 1:1,000 dilution), ULK1-pSer555 (#5869, clone D1H4, 1:1,000 dilution), ULK1-pSer757 (#6888, 1:1,000 dilution), S6K-pThr389 (#9205, 1:1,000 dilution), 4E-BP1-pThr37/46 (#9459, 1: 1,000 dilution) raptor-pSer792 (#2083, 1:1,000 dilution) and TSC2-pThr1387 (#5584, 1:1,000 dilution) were from Cell Signaling Technology. Phosphospecific antibody for AMPK α2-pSer345 (#ab129081) was from Abcam. IRDye 680RD- or 800CW-labeled anti-immunoglobulin G antibodies (1:10,000 dilution) and IRDye 680RD-labeled streptavidin (1:20,000 dilution) were from LI-COR Biosciences. Anti-rabbit IgG Alexa Fluor 647 (#A-21245, 1:1000 dilution) and Arg/Lys free Dulbecco’s modified Essential medium (DMEM) (#88364) were from ThermoFisher Scientific. DMEM was from Sigma (high glucose, #D5796) or Life Technologies (no glucose, #11966025; high glucose, GlutaMAX™ Supplement, pyruvate (#10569010) and horse serum New Zealand origin (#16050130)). cOmplete protease inhibitor cocktail was from Roche. pLJC5-TMEM192-3xHA was a gift from David Sabatini (Addgene plasmid # 102930). Inducible Raptor KO (iRapKO) MEFs were a gift from Michael Hall18.
Generation of AMPK α1-pSer347 phosphospecific antibody
Phosphospecific antibodies for Ssp2-pSer367 and AMPK α1-pSer347 were custom synthesized by Eurogentec SA (Seraing, Belgium) (see Supplementary Fig. 1).
S. pombe strains and growth conditions
Strains used in this study are listed in Supplementary Table 1. Unless otherwise specified, cells were cultured at 28 °C in Edinburgh minimal media (EMM2) using 5 g/L NH4Cl (EMM) as a nitrogen source30. Cells were grown exponentially for 48 h. To induce glucose stress, cells at early exponential phase of 1.5 x 10⁶ cells/ml were filtered, washed and re-suspended in EMM2 minus or glucose. To induce nitrogen stress, cells at early exponential phase of 1.5 x 10⁶ cells/ml grown in minimal sporulation liquid MSL31 were filtered, washed and re-suspended in MSL minus arginine. Cells were harvested at the indicated time points to prepare protein extracts for western blotting or fixed for cell length and division ratio measurements. For stress/sensitivity growth assays, cells were grown in EMM2 to a cell density of 1.5 x 10⁶ cells/ml. A 10-fold dilution series starting with 5 x 10⁴ cells was spotted on media indicated. Rapamycin was added to early exponential cultures at a final concentration of 0.3 μg/ml. Torin1 was at a final concentration of 25 μM.
Molecular manipulations and generation of single point mutations
To generate ssp2 point mutations, standard site directed mutagenesis was used and the mutated ssp2 allele was introduced into cells through transformation. The recombinant gene was then used to replace the ura4+ gene in the ssp2::ura4+. The resulting strains were back-crossed and prototroph progeny was selected. The presence of the mutation was verified by PCR. Thus, all ssp2 point mutations used in this study are single point mutants integrated into the ssp2 locus, and they are all prototroph strains.
Cell length measurements
Yeast cells were fixed with 3% formaldehyde, washed with Phosphate-Buffered Saline (PBS), and stained with calcofluor. Dividing cells counted (>200 cells counted per time point) and cell length at division was measured from >80 per sample. Images of cells were obtained using a CoolSNAP HQ2 CCD camera and processed with ImageJ.
Western blotting of yeast total protein extracts
Trichloroacetic acid precipitation protocol was followed for S. pombe total protein extracts32 Briefly, cells were harvested by filtration and snap frozen in liquid nitrogen. 20% TCA was added to the cell pellet. The precipitate was homogenised in the Ribolyser MP FastPrep-24 with glass beads for 6 sec and transferred to a new Eppendorf tube along with 5% TCA used to wash the beads. The protein was pelleted at 13,000 rpm for 3 min at 4 °C and resuspended in protein loading buffer with 10% DTT (10 mM), the pH was brought back to (pH 8) with 1 M Tris. The following dilutions of antibodies were used in this study: mouse anti-TAT1 (1:2000; kind gift from K. Gull, Oxford University UK), rabbit anti- AMPK-pThr172 to detect Ssp2-pThr189 (1:2000; Millipore UK Ltd.), rabbit anti-Ssp2 and rabbit anti-Ssp2-pSer367 (1:500 and 1:2000 raised by Eurogentec SA, Seraing, Belgium), mouse anti-PK-Tag (1:2000; AbD Serotec, Oxford), Alkaline phosphatase coupled secondary antibodies were used for all blots followed by direct detection with NBT/BCIP (VWR) substrates on PVDF membranes.
KCl stress in S. pombe
Scr1.GFP expressing S. pombe strains were grown in EMM2 at 28 °C for 48 h (diluted after 24 h). Cells were filtered at an OD of 0.18 into 1 M KCl supplemented EMM2 media for 5 min and their protein extracted using trichloroacetic acid precipitation as described above. Mouse anti-GFP (#11814460001, 1:200; Roche) were used to visualise Scr1.GFP.
Mammalian cell lines
HEK293T (CRL-3216), C2C12 myoblasts (CRL-1722) and COS7 (CRL-1651) cells were purchased from American Type Culture Collection. C2C12 myoblasts were differentiated into myotubes by 7 days of culture, with the media refreshed every 24 h in DMEM, high glucose, GlutaMAX™ Supplement, pyruvate and 2% (v/v) horse serum and antibiotics (penicillin, streptomycin). α1-/-/α2-/- mouse embryonic fibroblasts (MEFs) were extracted from homozygous AMPK α1-/-/α2-/- null embryos (days 12-14 post-coitum) and immortalized by FuGENE HD-mediated transfection with an SV40 large-T antigen expression construct17. All cell lines were maintained in DMEM containing 10% fetal bovine serum (FBS) and antibiotics (penicillin, streptomycin) at 37 °C with 5% CO2.
Protein expression constructs
All mutants were generated using QuikChange site-directed mutagenesis kits (Stratagene). All constructs were sequence verified. cDNAs for human AMPK α2 (WT, and Ser345Ala and Ser345Glu mutants) were generated with C-terminal flag-tag and cloned into LeGO-iG2 using EcoRI/NotI restriction sites. Ecotropic lentivirus was generated by transient transfection of HEK293T cells using calcium phosphate17. Briefly, 1 day prior to transfection, 2–2.5x10⁶ HEK293T cells were seeded per 10 cm culture dish. LeGO-iG2, psPax2 and pHCMV-EcoEnv plasmids (10 μg, 6.3 μg and 3.8 μg per 10 cm culture dish, respectively) were mixed together with 2 M CaCl2 solution (244 mM final concentration in 500 μl). The DNA/CaCl2 solution was added drop-wise, with vortexing, into 500 μl of 2xHEPES-buffered saline, pH 7.06. After 20 min incubation at RT, the mixture was transferred dropwise onto HEK293T cell culture and incubated. Within 16 h of transfection, cell were washed with phosphate-buffered saline (PBS) and replaced with 6 ml fresh media. The lentivirus-containing supernatant was harvested after 48 and 72 h post- transfection and stored at −80 °C. cDNA for CaMKK2 (N-terminal FLAG-TEV-fusion) and protein phosphatase PP2c (N-terminal GST-TEV-fusion) were cloned into pFastBac1(33).
Protein expression and purification for enzyme assays
FLAG-CaMKK2 and GST-protein phosphatase PP2c were expressed in Sf21 insect cells33. Sf21 cells were infected at a multiplicity of infection of 10 and harvested 72 h post-infection by centrifugation at 1500 rpm for 15 min. Pellets were washed in phosphate-buffered saline before storage at -80 °C. Cells were thawed and resuspended in 0.05x culture volume of ice-cold lysis buffer (50 mM Tris-HCl, pH 7.4, 200 mM NaCl, 1 mM dithiothreitol (DTT), 1 mM EDTA, 0.5 μM aprotinin, 20 μM leupeptin, 1 μg/ml pepstatin A, 2 mM benzamidine, 1 mM phenylmethylsulfonyl fluoride). All subsequent steps were conducted at 4 °C. Cells were lysed using a pre-cooled Avestin EmulsiFlex-C5 homogenizer (Avestin), and clarified by centrifugation (40,000 x g, 60 min). For PP2c, lysate was incubated with Glutathione Sepharose 4B on a rotating wheel for 90 min, before extensive washing with 10 volumes lysis buffer. PP2c was eluted in lysis buffer containing 10 mM glutathione. GST construct was cleaved by overnight incubation with TEV protease and PP2c further purified by size exclusion chromatography. For CaMKK2, lysates were incubated with anti-FLAG M2 affinity gel on a rotating wheel for 2 h, before extensive washing with 10 volumes lysis buffer. CaMKK2 was eluted in lysis buffer containing 0.25 mg/ml FLAG peptide (DYKDDDDK). Heterotrimeric AMPK was expressed in E. coli strain Rosetta (DE3)34. Bacterial expression cultures were grown in Luria-Bertani broth and induced at 16 °C with 0.25 mM isopropyl β-D-1-thiogalactopyranoside, prior to overnight incubation. Cells were lysed using a precooled EmulsiFlex-C5 homogenizer and AMPK purified using Nickel Sepharose and size exclusion chromatography in 50 mM Tris–HCl, pH 8.0, 150 mM NaCl, 2 mM Tris(2-carboxyethyl)phosphine (TCEP) buffer. Where necessary, AMPK was phosphorylated at α-Thr172 by incubation with CaMKK2 in the presence of 2 mM MgCl2 and 200 μM ATP (1 h, 22 °C), prior to the size exclusion chromatography step. For α1-Ser347/α2-Ser345 phosphorylation, AMPK was incubated with FLAG-mTOR/Raptor/MLST8 in the presence of 2 mM MgCl2 and 200 μM ATP (1 h, 37 °C), prior to FLAG-mTOR/Raptor/MLST8 immunoprecipitation using anti-FLAG M2 affinity gel. Protein was aliquoted and flash frozen in liquid nitrogen prior to storage at -80 °C (final storage buffer: 50 mM Tris.HCl, pH 8.0, 150 mM NaCl, 2 mM TCEP).
Protein expression for mammalian cell-based assays
Heterotrimeric AMPK was expressed in α1-/-/α2-/- MEFs. Human AMPK α2 (N-terminal FLAG-α fusion) was introduced into α1-/-/α2-/- MEFs by lentiviral transduction using the LeGO-iG2 system. Lentivirus containing medium was replaced with an equal volume of fresh medium after 24 h. 72 h post-transduction, MEFs were incubated with fresh medium for 1 h and treated as indicated. Cells were harvested by washing with ice-cold PBS, followed by rapid lysis in situ using 150 μl ice-cold lysis buffer (50mM Tris.HCl (pH 7.4), 150mM NaCl, 50mM NaF, 1mM sodium pyrophosphate, 1mM EDTA, 1mM EGTA, 1mM dithiothreitol, 1% (v/v) Triton X-100 and protease inhibitors). Lysates for raptor and TSC2 immunoblots were prepared in lysis buffer containing 1% SDS in place of 1% Triton, and homogenized using pellet pestles. Lysates were clarified by centrifugation at 14,000 rpm for 5 min and flash frozen in liquid nitrogen until processing. For tamoxifen-induced knockdown of raptor expression, WT or iRapKO MEFs were transduced with human AMPK flag-α2 lentivirus and simultaneously treated with 1 μM 4-OHT. After 48 h, cells were serum starved in DMEM overnight followed by 20 min complete nutrient starvation in PBS. Cells were then harvested as described above, or incubated in DMEM + 10% FBS for 1 h prior to harvesting.
Heterotrimeric human AMPK (α2β1γ1, expressed as N-terminal GST-α fusion in pDEST27, C-terminal FLAG-β1 fusion in pcDNA3.1 and N-terminal HA-γ1 fusion in pMT2; WT or mutants as indicated) was expressed in HEK293 cells33. HEK293 cells at 40% confluency were triply transfected with expression constructs for AMPK α, β and γ subunits, using transfection reagent FuGENE HD according to manufacturer’s protocols. Treated cells were harvested 48 h post-transfection in ice cold lysis buffer (50 mM Tris-HCl (pH 7.4), 150 mM NaCl, 50 mM NaF, 1 mM sodium pyrophosphate, 1 mM EDTA, 1 mM EGTA, 1% (v/v) Triton X-100 and protease inhibitors).
Human vastus lateralis biopsy
Human vastus lateralis muscle biopsies were obtained under local anesthesia (1% lidocaine) using a 5-mm Bergstrom needle modified for suction35. Skeletal muscle was homogenized in ice-cold buffer (50 mM Tris·HCl, pH 7.5, 1 mM EDTA, 1 mM EGTA, 10% glycerol, 1% Triton X-100, 50 mM NaF, 5 mM sodium pyrophosphate, 1 mM DTT, 10 μg/ml trypsin inhibitor, 2 μg/ml aprotinin, 1 mM benzamidine and 1 mM PMSF) using an electrical homogenizer. Samples were spun at 18,000 x g for 30 min at 4 °C and supernatant immunoblotted for AMPKα2-pS345 and total α.
Immunoblotting
Samples were separated by SDS-PAGE on a 12% gel (7% for ACC, previously enriched using streptavidin-Sepharose36) and transferred to Immobilon-FL PVDF membrane (EMD Millipore). Membrane was blocked in PBS + 0.1% Tween-20 (PBST) with 2% non-fat milk for 30 min at 22 °C, then incubated for either 1 h or overnight with primary antibodies (dilutions in PBST). After washes with PBST, membranes were incubated with anti-rabbit or anti-mouse IgG secondary antibodies, fluorescently-labelled with IR680 or IR800 dye, for 1 h. Immunoreactive bands were visualised on an Odyssey® Infrared Imaging System with densitometry analyses determined using ImageStudioLite software (LI-COR Biosciences).
AMPK activity assay
AMPK heterotrimers purified from cultured cells were immobilized on FLAG agarose and washed extensively with wash buffer (50 mM HEPES pH 7.4, 150 mM NaCl, 10% glycerol, 1 mM DTT and 0.1% Tween-20) prior to radiolabelled [γ-32P]-ATP kinase reaction37. Assays were conducted in the presence of 100 μM SAMS synthetic peptide (sequence: NH2-HMRSAMSGLHLVKRR-COOH), 5 mM MgCl2, 200 μM [γ-32P] ATP for 10 min at 30°C ± AMP (0-50 μM) on a vibrating platform. Phosphotransferase activity was quenched by spotting onto P81 phosphocellulose paper (Whatman, GE Healthcare) followed by repeated washes in 1% phosphoric acid. 32P transfer to the SAMS peptide was quantified by liquid scintillation counting (Perkin Elmer).
Phosphorylation assays
200 ng His-α2β1γ1 (unphosphorylated or mTOR pre-treated) was incubated with 20 ng LKB1/STRADα/MO25 or CaMKK2, in the presence of 50 mM Tris.HCl, pH 7.4, 150 mM NaCl, 10% glycerol, 0.02% Tween-20, 2 mM MgCl2 and 200 μM ATP at 32°C. Reactions were terminated after specified time by addition of SDS sample buffer and immunoblotted for α2-pThr172.
Dephosphorylation assays
200 ng CaMMK2-phosphorylated His-α2β1γ1 (± mTOR pre-treatment) was incubated with 50 ng phosphatase PP2cα, in the presence of 50 mM Tris.HCl, pH 7.4, 150 mM NaCl, 10% glycerol, 0.02% Tween-20, 2 mM MgCl2 at 32 °C. Reactions were terminated after specified time by addition of SDS sample buffer and immunoblotted for α2-pThr172.
Adenine nucleotide measurements
Adenine nucleotides were extracted from cells with perchloric acid38. Relative concentrations were measured by LC-MS on a QTRAP® 5500 mass spectrometer (AB-SCIEX).
Amino acid starvation of mammalian cells for protein extraction
HEK293 cells were seeded at approx. 10–15% confluency 48 h prior to transfection. Cells were triply transfected via Lipofectamine 2000 with AMPK heterotrimers GFP-α2 (WT or S345A mutant), myc-β1 and HA-γ1 (plasmid DNA ratio 1:2:1) according to manufacturer’s protocol. 24 h post transfection, media was replaced with fresh full DMEM (supplemented with FBS (10%), L-glutamate (4 mM), #G7513, Sigma) and penicillin streptomycin (#P0781, Sigma)) or Arg/Lys free free DMEM (supplemented with dialysed FBS (10%) and penicillin streptomycin), followed by re-addition of full DMEM or treatment with 2-deoxyglucose (20 mM) in Arg/Lys free DMEM. Cells were harvested for protein analysis using the trichloroacetic acid (TCA) precipitation method. Briefly, cells were washed with DPBS and scraped from the wells in 20% TCA. The precipitate was homogenised in the Ribolyser MP FastPrep-24 with glass beads for 30 sec and transferred to a new Eppendorf tube along with 5% TCA used to wash the wells. The protein was pelleted at 13,000 rpm for 3 min at 4 °C and resuspended in loading buffer with 10% DTT (10 mM). The pH was brought back to (pH 8) with 1 M Tris. Alkaline phosphatase coupled secondary antibodies were used for all blots followed by direct detection with NBT/BCIP (VWR) substrates on PVDF membranes.
Mouse liver preparation
Freeze-clamped liver was rapidly dissected from a male C57/Bl6 mouse age 12 weeks, and stored at -80 °C until processing. Tissue was homogenized in ice-cold buffer (50 mM HEPES, pH 7.4, 150 mM NaCl, 10 mM NaF, 1 mM sodium pyrophosphate, 0.5 mM EDTA, 250 mM sucrose, 1 mM dithiothreitol, 1% Triton X-100, 1 mM Na3VO4 and protease inhibitors) using an electrical homogenizer. Lysates were clarified by centrifugation at 14,000 rpm for 5 min and immunoblotted for AMPKα2-pS345 and total α.
Ethics statement
All animal procedures were approved by St. Vincent’s Hospital Animal Ethics Committee. Human skeletal muscle biopsy procedures were approved by the Australian Institute of Sport Ethics Committee and conformed to the standards set by the latest revision of the Declaration of Helsinki. Human subjects were informed of any possible risks involved before providing written consent35.
Quantification and statistical analysis
Data analyses were performed using GraphPad Prism 7 and Prism 8 software. Results from replicate experiments (n) were expressed as means ± standard deviation (s.d.) or standard error (s.e.m.). All measurements were taken from distinct samples. All statistical tests were performed using one-way or two-way analysis of variance (ANOVA), or unpaired, two-tailed Student’s t test, where appropriate. Values for EC50 and maximum response were calculated from a non-linear regression fit using Prism 7 and Prism 8 software.
Extended Data
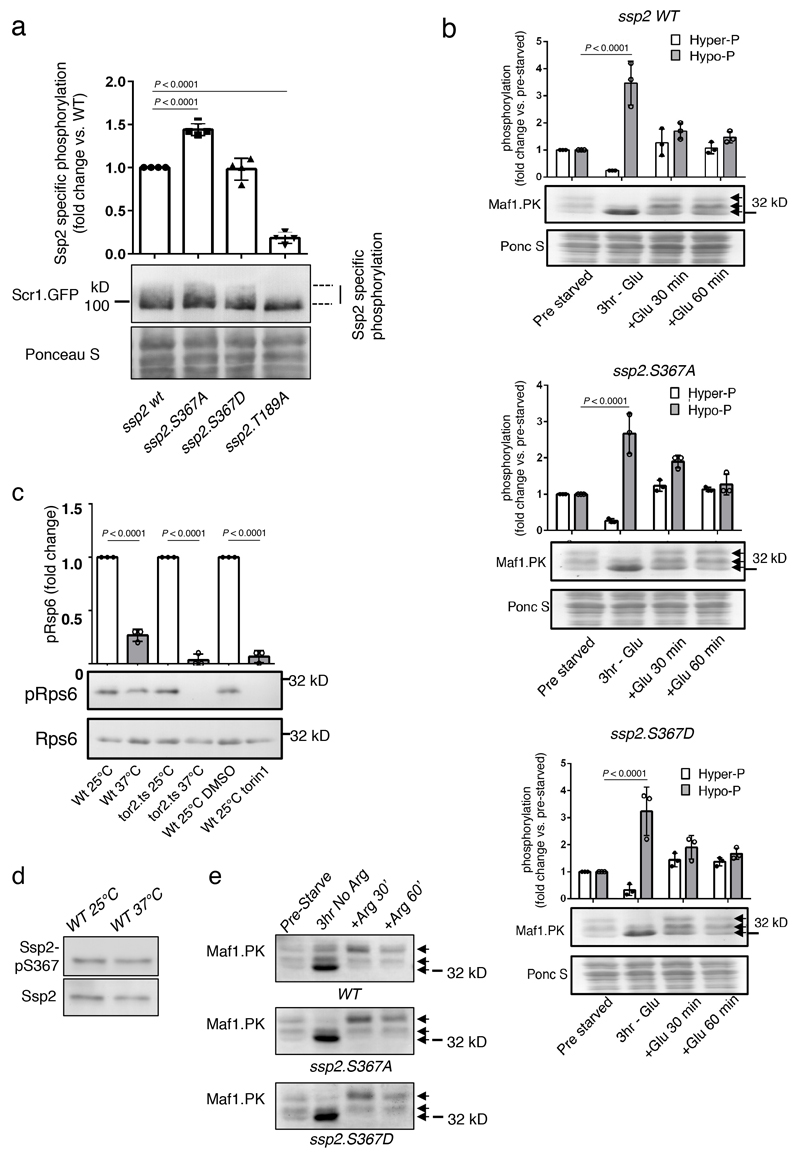
Extended Data Figure 1. Analysis of S. pombe Ssp2-S367A/D KI mutants and validation of S. pombe temperature-sensitive TORC1 expression mutant tor2.ts.
Ssp2 dependent phosphorylation of the Scr1 transcription factor is elevated in S. pombe expressing Ssp2-S367A mutant. a) Lysates were prepared from WT S. pombe and indicated ssp2 mutants in which Scr1 was tagged with GPF and immunoblotted for anti-GFP, Ponceau S staining shows total protein. Error bars, mean Ssp2 specific phosphorylation (signal absent in the kinase inactive Ssp2-T189A mutant) vs. WT ± s.e.m., n = 4. Statistical significance was calculated using one-way ANOVA with Dunnett’s multiple comparisons test. b) Lysates from WT S. pombe and and S367A/D mutants, treated as indicated, were prepared and immunoblotted for Maf1-PK. Increased hypo-phosphorylation is indicated by lower arrow. Error bars, mean fold change in phosphorylation ± s.e.m., n = 3. Statistical significance was calculated using by two-way ANOVA with Sidak’s multiple comparisons test. n represent independent experiments. c) The yeast S6 ribosomal protein Rps6 is not phosphorylated in the temperature-sensitive TORC1 mutant tor2.ts at restricted temperature or when torin1 is added to WT cells. Lysates were prepared from WT S. pombe and indicated mutants, under conditions indicated, and immunoblotted for pRps6 and total Rps6. Error bars, mean fold change in pRps6 ± s.e.m., n = 3 independent experiments. Statistical significance was calculated using by one-way ANOVA with Sidak’s multiple comparisons test. d) Heat stress of wild type cells at 37 °C for 3 h does not affect phosphorylation of Ssp2-S367. Lysates were prepared from WT S. pombe and immunoblotted for pS367 and total Ssp2. e) Lysates were prepared from WT S. pombe and indicated mutants and immunoblotted for Maf1 with anti-PK antibodies. MAF1 hypo-phosphorylation is indicated by lower arrow. For d, e) similar results were obtained from 3 independent experiments. Representative immunoblots are shown.
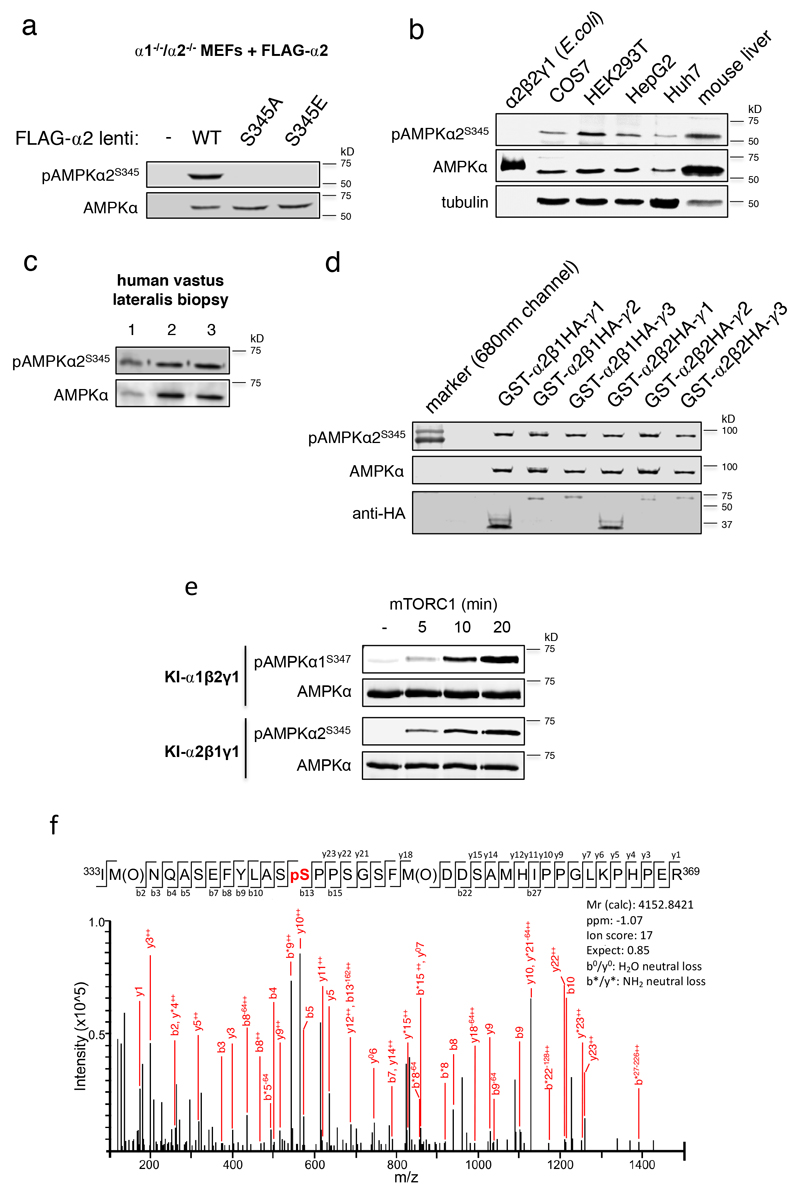
Extended Data Figure 2. AMPK α2-S345 is basally phosphorylated in a variety of mammalian cell lines and tissues and is an mTORC1 substrate using purified enzymes.
a) Validation of the AMPK α2-S345 phospho-specific antibody. Lysates were prepared from FLAG-α2- (WT and S345A/E mutants) expressing α1-/-/α2-/- MEFs and immunoblotted as indicated. α2-S345 is phosphorylated under nutrient-replete/basal conditions in b) mouse liver and a range of mammalian cell lines (negative control: α2β2γ1 expressed and purified from E. coli, which is not phosphorylated on α2-S345), c) human vastus lateralis skeletal muscle, and d) all GST-fusion α2 AMPK complexes expressed in COS7 mammalian cells. e) mTORC1 phosphorylates α-S345 on purified, bacterial expressed recombinant AMPK (α1β2γ1 and α2β1γ1). Kinase inactive (KI) AMPK was used as the substrate to exclude autophosphorylation. f) LC-MS/MS analysis of mTORC1 treated KIα2β1γ1. The masses of the b and y ion series provide direct evidence for phosphate incorporation onto α2-S345. M(O): oxidised methionine; pS: pS345. For a-e), similar results were obtained from 3 independent experiments; for f), results were obtained from a single experiment. Representative immunoblots are shown.
Extended Data Figure 3. Elevated AMPKα2 signalling in MEFs in response to pharmacological mTOR inhibition is mediated by α2-S345.
a) Lysates were prepared from FLAG-α2-(WT and S345A/E mutants) expressing α1-/-/α2-/- MEFs and immunoblotted for AMPK substrates TSC2-pT1387 (n = 6), raptor-pS792 (n = 6) and ULK1-pS555 (n = 3). Error bars, mean fold change in phosphorylation ± s.e.m. Statistical significance was calculated using one-way ANOVA with Dunnett’s multiple comparisons test. n represent independent experiments. b) Lysates were prepared from FLAG-α2- (WT or S345A/E mutants) expressing α1-/-/α2-/- MEFs, following incubation with mTOR inhibitors AZD8055 or INK128, and immunoblotted as indicated. Error bars, mean fold change in phosphorylation ± s.e.m., n = 3. Statistical significance was calculated using one-way ANOVA with Dunnett’s multiple comparisons test. Black P values vs. vehicle; red P values vs. 1 μM AZD8055 treated; blue P values vs. 1 μM INK128. n represent independent experiments. Representative immunoblots are shown.
Extended Data Figure 4. Elevated AMPKα2 signalling in MEFs in response to pharmacological mTOR inhibition is independent of AMP/ATP and ADP/ATP ratios but is synergistic with energy stress.
a) Adenine nucleotides were perchlorate extracted from lysates of FLAG-α2-expressing α1-/-/α2-/- MEFs, incubated for 1 h with rapamycin, AZD8055 or INK128, and measured by LC-MS. Error bars, mean adenylate energy charge ± s.e.m., n = 3. b) torin1 (2 h) treatment of FLAG-α2-expressing α1-/-/α2-/- MEFs. Error bars, mean fold change in phosphorylation vs. vehicle ± s.e.m., n = 3. Statistical significance was calculated using one-way ANOVA with Dunnett’s multiple comparisons test. c) Lysates were prepared from FLAG-α2-expressing α1-/-/α2-/- MEFs, following 2 h incubation with torin1 ± phenformin, and immunoblotted as indicated. Error bars, mean fold change in phosphorylation ± s.e.m., n = 3. Statistical significance was calculated using one-way ANOVA with Dunnett’s multiple comparisons test. Black P values vs. vehicle; red P values vs. 1 μM torin1 treated. n represent independent experiments. Representative immunoblots are shown.
Extended Data Figure 5. Serum starvation suppresses mTORC1-mediated α2-S345 phosphorylation in MEFs.
FLAG-α2-expressing α1-/-/α2-/- MEFs were serum starved for 4 h, and α2-pS345 and α-pT172 tracked for 1 h following a) serum re-addition, or b) 100 nM insulin incubation. Error bars, mean fold change in phosphorylation ± s.e.m., n = 3. For a), statistical significance was calculated using one-way ANOVA with Dunnett’s multiple comparisons test. Black P values vs. basal α2-pS345; red P values vs. basal α-pT172. For b), statistical significance was calculated using one-way ANOVA with Dunnett’s multiple comparisons test. Black P values vs. serum-starved α2-pS345; red P values vs. serum-starved α-pT172. c) WT and inducible Raptor KO (iRapKO) MEFs were treated with 4-OHT and transduced with AMPK FLAG-α2 lentivirus. Cells at full confluence were serum starved overnight (DMEM only), followed by 20 min complete nutrient starvation (1xPBS only) ± subsequent serum/nutrient re-addition (DMEM, 10% FBS) for 60 min. Prepared lysates were immunoblotted for α2-pS345. Error bars, mean fold change in phosphorylation vs. serum/nutrient starved ± s.e.m., n = 4. Statistical significance was calculated using unpaired, two-tailed Student’s t test. n represent independent experiments. Representative immunoblots are shown.
Extended Data Figure 6. mTORC1 inhibition in MEFs induces more robust dephosphorylation of α1-pS347 compared to α2-pS345.
a) Rapamycin or torin1 (2 h) treatment of FLAG-α-expressing α1-/-/α2-/- MEFs. Error bars, mean fold change in phosphorylation vs. vehicle ± s.e.m., n = 3. Statistical significance was calculated using one-way ANOVA with Dunnett’s multiple comparisons test (α1-pS347 vehicle vs. rapamycin/torin1 treatment) or unpaired, two-tailed Student’s t test (α1-pS347 vs. α2-pS345). b) Rapamycin and/or phenformin (1 h) treatment of FLAG-α1-expressing α1-/-/α2-/- MEFs. Error bars, mean fold change in phosphorylation vs. vehicle ± s.e.m., n = 3. Statistical significance was calculated using one-way ANOVA with Dunnett’s multiple comparisons test. c) Phenformin (1 h) treatment of FLAG-α2(S345E)-expressing α1-/-/α2-/- MEFs. Error bars, mean fold change in phosphorylation vs. vehicle ± s.e.m., n = 3. Statistical significance was calculated using unpaired, two-tailed Student’s t test. n represent independent experiments. Representative immunoblots are shown.
Extended Data Figure 7. Regulation of endogenous AMPK signalling in HEK293T cells in response to mTOR inhibitors and AMPK activating conditions.
a) Lysates were prepared from HEK293T cells, following incubation for 1-24 h with 0.25 or 1 μM INK128, and immunoblotted as indicated. Error bars, mean fold change in phosphorylation vs. vehicle ± s.e.m., n = 3. Statistical significance was calculated using one-way ANOVA with Dunnett’s multiple comparisons test. Black P values vs. vehicle α2-pS345; red P values vs. vehicle α-pT172. b) Lysates were prepared from HEK293T cells, treated with direct AMPK activators (A-769662, SC4) or indirect AMPK activating agents (phenformin, 2-deoxyglucose (2-DG), H2O2) as detailed, and immunoblotted as indicated. Error bars, mean fold change in phosphorylation vs. vehicle ± s.e.m., n = 4. Statistical significance was calculated using one-way ANOVA with Dunnett’s multiple comparisons test. n represent independent experiments. Representative immunoblots are shown.
Extended Data Figure 8. S. pombe Ssp2-S367 is not regulated by a range of CDKs.
Lysates were prepared from WT S. pombe and indicated cdk mutants and immunoblotted for Ssp2-pS367 and total Ssp2. Error bars, mean fold change in phosphorylation vs. WT 25 ºC ± s.e.m., n = 3 independent experiments. Representative immunoblots are shown.
Extended Data Figure 9. Phosphorylation of AMPK α2-S345 does not influence AMP sensitivity and is not dependent on β-subunit myristoylation in HEK293T cells.
a) α2-pS345 does not affect AMP allosteric activation of AMPK. Lysates were prepared from FLAG-α2- (WT and S345A mutant) expressing α1-/-/α2-/- MEFs and AMPK immunoprecipitated using FLAG-agarose. AMPK activity was assayed ± AMP (0-50 μM). Error bars, fold change in AMPK activity vs. basal ± s.e.m., n = 3. α2-pS345 does not affect T172 phosphorylation by b) LKB1, or c) CaMKK2. Bacterial expressed α1β1γ1, incubated ± mTORC1 during purification (see Extended Data Fig. 3f) was treated with upstream kinase and immunoblotted for α-pT172. For b), Error bars, mean fold change in pT172 ± s.e.m., n = 6. For c), Error bars, mean pT172 (arbitrary units) ± s.e.m., n = 3. Statistical analyses performed by unpaired, two-tailed, Student’s t test. d) α2-pS345 does not affect rate of pT172 dephosphorylation by phosphatase PP2c. Bacterial expressed α1β1γ1, incubated with CaMKK2 and ± mTORC1 during purification, was incubated with PP2c and residual pT172 measured by immunoblot. Error bars, mean % residual pT172 ± s.e.m., n = 4. Analyses performed by unpaired, two-tailed, Student’s t test. e) Loss of AMPK β-subunit myristoylation (G2A mutant) does not affect basal or rapamycin-induced reductions in α2-S345 phosphorylation in HEK293T cells. Lysates were prepared from GST-α2β1γ1 AMPK- (WT or β1-G2A mutant) expressing HEK293T cells, following 1 h incubation with rapamycin, and immunoblotted for AMPK α2-pS345. Error bars, mean phosphorylation (arbitrary units) ± s.e.m., n = 3. Statistical significance was calculated using one-way ANOVA with Dunnett’s multiple comparisons test. n represent independent experiments. Representative immunoblots are shown.
Extended Data Figure 10. Arg/Lys starvation suppresses AMPK α2-S345 phosphorylation in HEK293 cells and affects the ability of 2-DG to enhance cell proliferation.
See main figure 4. a-d, i, j) Real time proliferation analysis of HEK293 cells (untransfected or transiently expressing GFP-α2β1γ1 (WT or α2-S345A mutant)), treated as indicated. Error bars, relative confluence ± s.e.m. For a), n = 3; for b-d, i, j), n = 8. For c), ns P = 0.1819; for d), ns P > 0.9999. Statistical significance was calculated using two-way ANOVA with Sidak’s multiple comparisons test. e-h) Lysates were prepared from GFP-α2β1γ1 AMPK- (WT or α2-S345A mutant) expressing HEK293 cells (treated as indicated) and immunoblotted for AMPKα2-pS345, S6K-pT389 and ACC-pS79/212. Error bars, mean fold change in phosphorylation vs. -Arg/Lys ± s.e.m., n = 3 (WT) and 4 (S345A). Statistical significance was calculated using one-way ANOVA with Dunnett’s multiple comparisons test. n represent independent experiments. Representative immunoblots are shown.
Supplementary Material
Acknowledgments
We thank K. Gull and S. Lim for antibodies, M. Balasubramanian, K. Shiozaki and S. Moreno for yeast strains, M. Hall for iRapKO MEFs, I. Hagan for stimulating discussions and C. Proud and J. Murphy for critical evaluation of the manuscript. C.G.L. was supported by an Early Career Fellowship from the NHMRC [1143080]. J.S.O. was supported by a Future Fellowship from the Australian Research Council (ARC) [FT130100988], National Health and Medical Research Council (NHMRC) [1098459], St Vincent’s Institute of Medical Research (Aus.) and in part by the Victorian Government’s Operational Infrastructure Support Program. J.P. was supported by a Cancer Research UK Senior fellowship [C10888/A11178], Cancer Council Australia [1125662], Worldwide Cancer Research [16-0052], NHMRC [1161262], A.R.C. [DP 180101682], Flinders Foundation seeding grant, Manchester (U.K.) and Flinders University (Aus.).
Footnotes
Reporting Summary. Further information on research design is available in the Reporting Summary linked to this article.
Data availability
The data that support the findings of this study are available from the corresponding author upon request. Source data for Figs. 1-4, Extended Data Figs. 1–10 and Supplementary Fig. 1 are available online.
Author contributions N.X.Y.L., A.K., A.H., E.D., K.R.W.N., K.R.M., W.J.S., G.M.F., T.W., S.L., T.A.D, J.S.O and J.P. performed the experiments. C.G.L. and J.W.S. provided reagents and intellectual input. J.S.O. and J.P. designed and coordinated the study and wrote the manuscript. All authors read and approved the manuscript.
Competing interests All authors declare no conflict of interest.
References
- 1.Saxton RA, Sabatini DM. mTOR signaling in growth, metabolism, and disease. Cell. 2017;168:960–976. doi: 10.1016/j.cell.2017.02.004. [DOI] [PMC free article] [PubMed] [Google Scholar]
- 2.Hardie DG. AMPK – sensing energy while talking to other signaling pathways. Cell Metab. 2014;20:939–952. doi: 10.1016/j.cmet.2014.09.013. [DOI] [PMC free article] [PubMed] [Google Scholar]
- 3.Oakhill JS, Scott JW, Kemp BE. AMPK functions as an adenylate charge-regulated protein kinase. Trends Endocrinol Metab. 2012;23:125–132. doi: 10.1016/j.tem.2011.12.006. [DOI] [PubMed] [Google Scholar]
- 4.Zhang S-C, et al. The lysosomal v-ATPase-ragulator complex is a common activator for AMPK and mTORC1, acting as a switch between catabolism and anabolism. Cell Metab. 2014;20:526–540. doi: 10.1016/j.cmet.2014.06.014. [DOI] [PubMed] [Google Scholar]
- 5.Hanyu Y, et al. Schizosaccharomyces pombe cell division cycle under limited glucose requires Ssp1 kinase, the putative CaMKK, and Sds23, a PP2A-related phosphatase inhibitor. Genes Cells. 2009;14:539–554. doi: 10.1111/j.1365-2443.2009.01290.x. [DOI] [PubMed] [Google Scholar]
- 6.Davie E, Forte GM, Petersen J. Nitrogen regulates AMPK to control TORC1 signalling. Curr Biol. 2015;25:445–454. doi: 10.1016/j.cub.2014.12.034. [DOI] [PMC free article] [PubMed] [Google Scholar]
- 7.Koch A, Krug K, Pengelley S, Macek B, Hauf S. Mitotic substrates of the kinase aurora with roles in chromatin regulation identified through quantitative phosphoproteomics of fission yeast. Sci Signal. 2011;4:rs6. doi: 10.1126/scisignal.2001588. [DOI] [PubMed] [Google Scholar]
- 8.Wilson-Grady JT, Villén J, Gygi SP. Phosphoproteome analysis of fission yeast. J Proteome Res. 2008;7:1088–1097. doi: 10.1021/pr7006335. [DOI] [PubMed] [Google Scholar]
- 9.Wissing J, et al. Proteomics analysis of protein kinases by target class-selective prefractionation and tandem mass spectrometry. Mol Cell Proteomics. 2007;6:537–547. doi: 10.1074/mcp.T600062-MCP200. [DOI] [PubMed] [Google Scholar]
- 10.Parker BL, et al. Targeted phosphoproteomics of insulin signaling using data-independent acquisition mass spectrometry. Sci Signal. 2015;8:rs6. doi: 10.1126/scisignal.aaa3139. [DOI] [PubMed] [Google Scholar]
- 11.Chen L, et al. Conserved regulatory elements in AMPK. Nature. 2011;472:230–233. doi: 10.1038/nature12189. [DOI] [PubMed] [Google Scholar]
- 12.Petersen J, Nurse P. TOR signalling regulates mitotic commitment through the stress MAP kinase pathway and the Polo and Cdc2 kinases. Nat Cell Biol. 2007;9:1263–1272. doi: 10.1038/ncb1646. [DOI] [PubMed] [Google Scholar]
- 13.Matsuzawa T, Fujita Y, Tohda H, Takegawa K. Snf1-like protein kinase Ssp2 regulates glucose derepression in Schizosaccharomyces pombe. Eukaryot Cell. 2012;11:159–167. doi: 10.1128/EC.05268-11. [DOI] [PMC free article] [PubMed] [Google Scholar]
- 14.Du W, Hálová L, Kirkham S, Atkin J, Petersen J. TORC2 and the AGC kinase Gad8 regulate phosphorylation of the ribosomal protein S6 in fission yeast. Biol Open. 2012;1:884–888. doi: 10.1242/bio.20122022. [DOI] [PMC free article] [PubMed] [Google Scholar]
- 15.Álvarez B, Moreno S. Fission yeast Tor2 promotes cell growth and represses cell differentiation. J Cell Sci. 2005;119:4475–4485. doi: 10.1242/jcs.03241. [DOI] [PubMed] [Google Scholar]
- 16.Wolfson RL, Sabatini DM. The dawn of the age of amino acid sensors for the mTORC1 pathway. Cell Metab. 2017;26:301–309. doi: 10.1016/j.cmet.2017.07.001. [DOI] [PMC free article] [PubMed] [Google Scholar]
- 17.Dite TA, et al. The autophagy initiator ULK1 sensitizes AMPK to allosteric drugs. Nat Commun. 2017;18 doi: 10.1038/s41467-017-00628-y. 571. [DOI] [PMC free article] [PubMed] [Google Scholar]
- 18.Cybulski N, Zinzalla V, Hall MN. Inducible raptor and rictor knockout mouse embryonic fibroblasts. Methods Mol Biol. 2012;821:267–278. doi: 10.1007/978-1-61779-430-8_16. [DOI] [PubMed] [Google Scholar]
- 19.Gwinn DM, et al. AMPK phosphorylation of raptor mediates a metabolic checkpoint. Mol Cell. 2008;30:214–226. doi: 10.1016/j.molcel.2008.03.003. [DOI] [PMC free article] [PubMed] [Google Scholar]
- 20.de Souza Almeida Matos AL, et al. Allosteric regulation of AMP-activated protein kinase by adenylate nucleotides and small-molecule drugs. Biochem Soc Trans. 2019 doi: 10.1042/BST20180625. Epub ahead of print. [DOI] [PubMed] [Google Scholar]
- 21.Liu X, et al. Discrete mechansism of mTOR and cell cycle regulation by AMPK agonists independent of AMPK. Proc Natl Acad Sci USA. 2013;111:E435–44. doi: 10.1073/pnas.1311121111. [DOI] [PMC free article] [PubMed] [Google Scholar]
- 22.Hülsmann HJ, et al. Activation of AMP-activated protein kinase sensitizes lung cancer cells and H1299 xenografts to erlotinib. Lung Cancer. 2014;86:151–157. doi: 10.1016/j.lungcan.2014.09.001. [DOI] [PubMed] [Google Scholar]
- 23.Lopez-Mejia IC, et al. CDK4 phosphorylates AMPKα2 to inhibit its activity and repress fatty acid oxidation. Mol Cell. 2017;68:336–349. doi: 10.1016/j.molcel.2017.09.034. [DOI] [PubMed] [Google Scholar]
- 24.Zhang C-S, et al. Fructose-1,6-bisphophate and aldolase mediate glucose sensing by AMPK. Nature. 2017;548:112–116. doi: 10.1038/nature23275. [DOI] [PMC free article] [PubMed] [Google Scholar]
- 25.Barban S, Schulze HO. The effects of 2-deoxyglucose on the growth and metabolism of cultured cells. J Biol Chem. 1961;236:1887–1890. [PubMed] [Google Scholar]
- 26.Egan DF, et al. Small molecule inhibition of the autophagy kinase ULK1 and identification of ULK1 substrates. Mol Cell. 2015;59:285–297. doi: 10.1016/j.molcel.2015.05.031. [DOI] [PMC free article] [PubMed] [Google Scholar]
- 27.Dite TA, et al. AMP-activated protein kinase selectively inhibited by the type II inhibitor SBI-0206965. J Biol Chem. 2018;293:8874–8885. doi: 10.1074/jbc.RA118.003547. [DOI] [PMC free article] [PubMed] [Google Scholar]
- 28.Jeon S-M. Regulation and function of AMPK in physiology and diseases. Exp Mol Med. 2016;48:e245. doi: 10.1038/emm.2016.81. [DOI] [PMC free article] [PubMed] [Google Scholar]
- 29.Inoki K, Zhu T, Guan K-L. TSC2 mediates cellular energy response to control cell growth and survival. Cell. 2003;115:577–590. doi: 10.1016/s0092-8674(03)00929-2. [DOI] [PubMed] [Google Scholar]
- 30.Fantes PA. Control of cell size and cycle time in Schizosaccharomyces pombe. J Cell Sci. 1977;24:51–67. doi: 10.1242/jcs.24.1.51. [DOI] [PubMed] [Google Scholar]
- 31.Petersen J, Russell P. Growth and the environment of Schizosaccharomyces pombe. Cold Spring Harb Protoc. 2016 doi: 10.1101/pdb.top079764. [DOI] [PMC free article] [PubMed] [Google Scholar]
- 32.Caspari T, et al. Characterization of Schizosaccharomyces pombe Hus1: a PCNA-related protein that associates with Rad1 and Rad9. Mol Cell Biol. 2000;20:1254–1262. doi: 10.1128/mcb.20.4.1254-1262.2000. [DOI] [PMC free article] [PubMed] [Google Scholar]
- 33.Oakhill JS, et al. β-Subunit myristoylation is the gatekeeper for initiating metabolic stress sensing by AMP-activated protein kinase (AMPK) Proc Natl Acad Sci USA. 2010;107:19237–19241. doi: 10.1073/pnas.1009705107. [DOI] [PMC free article] [PubMed] [Google Scholar]
- 34.Langendorf CG, et al. Structural basis of allosteric and synergistic activation of AMPK by furan-2-phosphonic derivative C2 binding. Nat Commun. 2016;7 doi: 10.1038/ncomms10912. 10912. [DOI] [PMC free article] [PubMed] [Google Scholar]
- 35.Smiles WJ, et al. Modulation of autophagy signaling with resistance exercise and protein ingestion following short-term energy deficit. Am J Physiol Regul Integr Comp Physiol. 2015;309:R603–612. doi: 10.1152/ajpregu.00413.2014. [DOI] [PubMed] [Google Scholar]
- 36.Scott JW, et al. Small molecule drug A-769662 and AMP synergistically activate naive AMPK independent of upstream kinase signaling. Chem Biol. 2014;21:619–627. doi: 10.1016/j.chembiol.2014.03.006. [DOI] [PubMed] [Google Scholar]
- 37.Scott JW, et al. Thienopyridone drugs are selective activators of AMP-activated protein kinase beta1-containing complexes. Chem Biol. 2008;15:1220–1230. doi: 10.1016/j.chembiol.2008.10.005. [DOI] [PubMed] [Google Scholar]
- 38.Scott JW, et al. Inhibition of AMP-activated protein kinase at the allosteric drug-binding site promotes islet insulin release. Chem Biol. 2015;22:705–711. doi: 10.1016/j.chembiol.2015.05.011. [DOI] [PubMed] [Google Scholar]
- 39.Xiao B, et al. Structure of mammalian AMPK and its regulation by ADP. Nature. 2011;472:230–233. doi: 10.1038/nature09932. [DOI] [PMC free article] [PubMed] [Google Scholar]
- 40.Tatebe H, Morigasaki S, Murayama S, Zeng CT, Shiozaki K. Rab-family GTPase regulates TOR complex 2 signaling in fission yeast. Curr Biol. 2010;20:1975–1982. doi: 10.1016/j.cub.2010.10.026. [DOI] [PMC free article] [PubMed] [Google Scholar]
- 41.Bimbó A, et al. Systematic deletion analysis of fission yeast protein kinases. Eukaryot Cell. 2005;4:799–813. doi: 10.1128/EC.4.4.799-813.2005. [DOI] [PMC free article] [PubMed] [Google Scholar]
Associated Data
This section collects any data citations, data availability statements, or supplementary materials included in this article.


