Abstract.
Immunohistochemistry (IHC) is one of the main clinical techniques for biomarker assessment on tissue biopsies. It consists in chromogenic labeling with specific antibodies, followed by optical imaging, and it is used for diagnosis and therapeutic targeting. A well-known drawback of IHC is its limited robustness, which often precludes quantitative biomarker assessment. We combine microfluidic immunostaining, fluorescence imaging, and image-based cell segmentation to create an ultrafast procedure for accurate biomarker assessment via IHC. The experimental protocol is very simple and based on fast delivery of reagents in a microfluidic chamber created by clamping a half-chamber patterned in a silicon chip on top of a tumor tissue section. Also, the imaging procedure simply requires a standard fluorescence microscope, already widely used in clinical practice. The image processing is based on local-contrast enhancement and thresholding of the obtained fluorescence image, with subsequent Voronoi segmentation. To assess the experimental and analytical procedure on robust biological controls, we apply our method to well-characterized cell lines, which guarantee higher reproducibility than whole-tissue samples and therefore enable to disentangle the technical variability from the biological variability. To increase the potential translationality, we address the detection and quantification of the human epidermal growth factor receptor 2 (HER2) protein, which is a biomarker for HER2-type breast carcinoma diagnosis and therapy. We report both ultrafast immunofluorescence staining (5 min per sample) of two breast cancer biomarkers and ultrafast cell segmentation (1 min per sample = processing of thousands of cells). This provides a quantitative, cell-based immunofluorescent signal, with which we propose a potential diagnostic criterion to separate HER2-positive and HER2-negative breast cancer cells at high sensitivity and specificity.
Keywords: breast cancer, image segmentation, immunofluorescence, biomarker quantification, microfluidic chip
1. Introduction: Assessment of Breast Cancer Status in Clinics
In the field of breast cancer research and diagnostics, the human epidermal growth factor receptor 2 (HER2) receives major clinical interest since this membrane protein is targeted with an FDA-approved drug, namely Trastuzumab.1 To assess the status of the HER2 protein and to decide about the application of an HER2-targeted therapy, clinical guidelines have been set.2 They are based on the outcome of a standard experimental technique for the evaluation of protein overexpression, which is called immunohistochemistry (IHC).3 It consists of using antibodies and enzymatic reactions to stain a tissue slice obtained from a tumor biopsy of the patient. The optical readout consists in colored membranes of which the intensity indicates the overexpression level, scored as 0, (negative), (ambiguous), and (positive). According to the guidelines, for which patients can benefit from HER2-targeted therapy,2 a unique score is attributed to the entire tissue, but previous work was proposed to score each cell individually,4 which is advantageous to study intratumoral heterogeneity and its consequences in disease prognosis.5
A recognized problem in standard IHC is the difficulty to obtain robust and quantitative assessment.6 Therefore, classification of the HER2 overexpression levels using IHC staining depends on the experience of each evaluator. Previous attempts to solve this issue used microfluidics to perform immunofluorescent staining.7,8 The crucial point was to decrease the incubation time required for the staining of the cancer tissue using a microfluidic tissue processor for a fast and local delivery of reagents on the sample. Such well-controlled microfluidic staining helped to decrease the number of ambiguous () cases compared with manual procedures. Another study used image processing on immunofluorescence staining to characterize the ratio between the HER2 expression and the cytokeratin (CK) expression (a biomarker used to define the tumor region in patient biopsies)9 and showed that this parameter helps with estimating the HER2 gene amplification in patient tissues.10 Nevertheless, those studies used a quantification method that involved a standardization with respect to a positive () patient introduced in each test, which can result in a normalization bias because (i) the status can vary from case to case (patient specificity) and (ii) each tissue slice from the same patient may have a slightly different score depending on its location within the tumor (intratumoral heterogeneity). Moreover, the biomarker quantification was based on an average value calculated on all the cells within the image, which may hide interesting information on the individual cells.
Microfluidic methods were also implemented to enable multiplexed immunofluorescence staining on tissue slides.11 The approach used fluorescence spectroscopy on quantum dots to detect multiple epitopes on the same sample using three parallel microfluidic channels. The same multichannel approach was then used to standardize the staining conditions by exploiting a Christmas-tree design for linear gradient generation.12 A main advantage of such a method is the ability to provide a semiquantitative assessment on robust controls, such as cell lines. Conversely, its main drawback is the use of a multichannel microfluidic design for multiplexing, which, while providing information on different biomarkers in different locations of the same sample, prevents coexpression or correlation analysis of cells expressing more than one biomarker.
To solve the limitations of the previous approaches and increase the robustness of the HER2 status assessment, we studied the possibility to apply cell-based biomarker assessment on breast cancer cell lines for two biomarkers on the whole sample. We developed high-throughput fluorescence-based cell recognition and signal quantification for cell pellets stained using a very simple microfluidic design. Six different types of human breast cancer cell lines, with different HER2 expression status,13 have been studied. The goal was to evaluate an experimental and analytical pipeline to define robust cell line-based controls and diagnostic criteria for future clinical HER2 assessment in breast carcinomas.
2. Materials and Methods
2.1. Materials
Formalin-fixed paraffin-embedded slides of cell lines (SK-BR-3, BT-474, T-47D, MDA-MB-231, MDA-MB-468, and MCF-7) were purchased from AMS Biotechnology (Europe) Ltd., Switzerland. Specifications for cell preparation can be found at the AMS Biotechnology’s website. Phosphate-buffered saline (PBS) and Tween20 were purchased from Sigma. PBS was obtained by diluting the concentrated PBS stock in deionized water. For immunostaining, the primary antibodies rabbit antihuman c-erbB-2 oncoprotein primary antibody (HER2, code: A0485) and mouse antihuman cytokeratin (CK, code M3515) were purchased from Agilent Technology (Switzerland) and diluted from the stock in PBS supplemented with Tween 0.05% (PBST 0.05%) to get a final concentration (for HER2) and CK (for CK). Secondary antibodies Alexa Fluor 594 goat antirabbit IgG (H+L, code: A-11037) and Alexa Fluor 647 goat antimouse IgG (code: A-21236) were purchased from Thermo Fisher Scientific (Switzerland) and diluted in PBST 0.05% to get the final concentration of .
2.2. Fabrication of the Microfluidic Chip
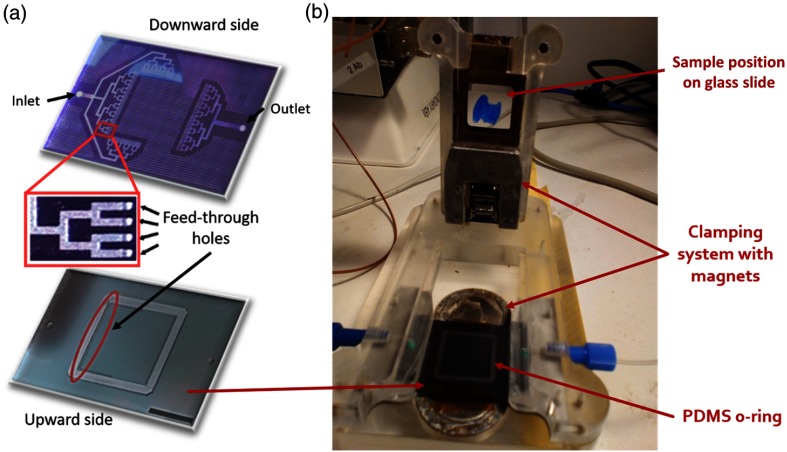
The structure and fabrication of the chip were reported previously.7,10,14 First, a 4-in. silicon wafer with a wet-oxide layer was taken, on which AZ9260 photoresist was spun, exposed with the channel mask, and developed to form the channels. The oxide underneath was etched by reactive ion etching (601E; Alcatel, France). The resist was stripped, and an additional lithography was realized by spinning AZ9260 photoresist (MicroChemicals GmbH, Germany) and exposing the latter to a second mask. After the lithography, the front side was etched in two steps by deep reactive ion etching (DRIE; 601E, Alcatel, France) to form channels and vertical access holes with different depths. First, the wafer was etched to a depth of and the resist was stripped. Thereafter, the channels were etched via the patterned hard mask realized in the first step. The etch depth varied between 50 and , depending on the design. Subsequently, the silicon wafer was bonded to a parylene-C-coated Pyrex wafer using a low-stress parylene-C bonding procedure. After bonding, additional lithography of the glass/silicon-bonded stack was done on the silicon side using a -thick AZ9260 resist. Then, one more step of DRIE was performed from the backside until the access holes were reached, a process used at the same time to generate notches for o-ring incorporation. Subsequently, the resist was stripped and oxygen plasma was applied to clean the device. Fabrication was finalized by dicing the glass/silicon micromachined structures into their final shapes [Fig. 1(a)].
Fig. 1.
Microfluidic chip for immunostaining: (a) three-dimensional schematics of both sides of the chip, with a zoom on the feed-though holes passing from one side of the chip to the other; scale bar: 1 mm and (b) picture of the experimental setup, with the location of the constitutive elements.
2.3. Immunofluorescence Staining
Cell slides were deparaffinized in three Histoclear II solutions (National Diagnostics) for 5 min each. Then, they were transferred to gradual ethanol series of 100%, 95%, 70%, and 40%, for 2 min each. Finally, they were put 40 min at 95°C in Target Retrieval Solution Citrate pH 6 (Dako, cose S169984), and then stored in PBS until the staining process. Next, they were stained using the microfluidic tissue processor. For the staining, the chip was mechanically clamped to the sample slide together with a soft (polydimethylsiloxane) o-ring that constitutes the walls of the -height chamber above the slide. The microfluidic tissue processor was connected to external syringes and pumps via the unique inlet and used to deliver specific antibodies and buffer solutions homogeneously onto the surface of the cell pellet via the tree-like microfluidic channels [Fig. 1(b)]. An automatic syringe pump system delivered the following solutions: PBST 0.05% (flow rate for 12 s), HER2 and CK primary antibody cocktail (flow rate for 12 s then for 2 min), PBS wash (flow rate for 30 s), AF594 and AF647 secondary antibody cocktail (flow rate during 5 s then for 2 min), PBS wash (flow rate for 30 s), and distilled water (DIW, flow rate during 30 s). After these automatic reagent flushing steps, the slide was removed from the setup and cleaned again in DIW before receiving SlowFade™ Gold Antifade mountant (Life Technologies) containing 4′, 6-diamidino-2-phenylindole (DAPI). The slide was coverslipped and stored in the fridge before imaging. All other slides in the batch were treated in the same manner. The incubation time and the volume of primary and secondary antibodies’ solution were optimized in our previous studies.7,10
2.4. Image Acquisition
The whole microscope slide was scanned tile by tile (10% overlap) using the microscope Axio Imager M2m (Zeiss, Germany) with a objective (Plan-Apochromat, numerical aperture = 0.8) in binning mode. The exposure time was first adjusted using an HER2+ slide that received primary Abs to reach 80% of the highest nonsaturated exposure. This exposure time and light intensity were kept constant for all slides. In each position, emissions of three fluorophores AF594, AF647, and DAPI, corresponding to HER2, CK, and DAPI signals, respectively, under adaptive excitation lights were recorded and merged into an image. Images were represented by three colors (blue, green, and red), corresponding to the DAPI, CK, and HER2 signals, respectively. After scanning, tiles were stitched using the Axiovision software.
3. Results
3.1. Ultrafast and Automated Optical Detection of Biomarkers: Microfluidic Staining and Fluorescence-Based Cell Segmentation
To test the opportunity to characterize clinical controls at the cell level with a rapid and robust procedure, we applied a protocol of immunofluorescence staining to breast cancer cell lines with the microfluidic tissue processor and, subsequently, analyzed the fluorescence images with an automatic processing algorithm. We have chosen to characterize both HER2+ (SK-BR-3 and BT-474) and HER2− (T-47D, MDA-MB-231, MDA-MB-468, and MCF-7) cell lines to find robust parameters for quantification that could be used as clinical controls when staining patient tissues. Based on previous results reporting the importance of both HER2 and CK assessment for potential breast cancer diagnostics,10 we stained and quantified both biomarkers.
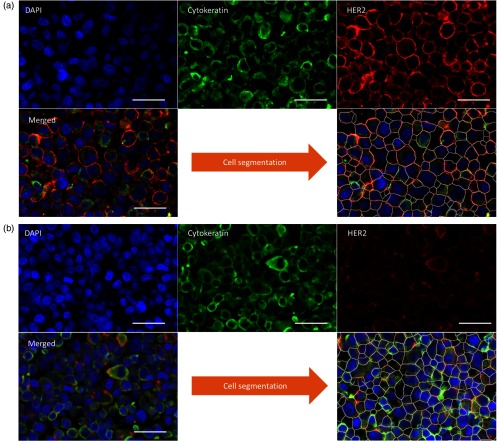
The on-chip protocol was very simple and fast: delivery of the primary Ab cocktail (rabbit antihuman HER2 IgG and mouse antihuman CK IgG) for 12 s; incubation for 2 min, washing for 30 s, delivery of the secondary Ab cocktail (goat antirabbit IgG tagged with A596 and goat antimouse IgG tagged with A647) for 12 s, incubation for 2 min, and washing for 1 min. The entire protocol, including slide removal and coverslip mounting, takes only 5 min. The result of this procedure is shown in Fig. 2. The membrane staining of HER2 is sharp and visible for HER2+ cell lines, as well as the CK in the cytoplasm, whereas only the latter is visible in HER2− cell lines. This is expected because, according to previous research,7,10 microfluidic immunofluorescence imposes a fast, well-controlled staining that limits nonspecific adsorption of antibodies.
Fig. 2.
Immunofluorescence staining and cell segmentation. False-color fluorescence images of biomarkers in the case of an HER2+ cell line (SK-BR-3, a) and an HER2− cell line (T-47D, b) with the segmented version after image processing, in which the white lines define the region of a specific cell. Scale bars: .
To analyze the biomarker expression at the cell level, we developed an algorithm to segment the cells in the images. The procedure are as follows:
-
1.
A median filter was applied to the HER2 image to decrease the local noise.
-
2.
The image was sharpened by subtracting a blurred version of it to make the membranes much brighter than the background.
-
3.
A median-filtered version of the CK image was subtracted from the sharpened HER2 image to remove the cytoplasmic pixels.
-
4.
A median-filtered version of the DAPI image was subtracted from the sharpened HER2 image to remove the nuclear pixels.
-
5.
A grayscale attribute filtering was applied to smooth the membranes.
-
6.
A threshold was applied to select the membranes only.
-
7.
The thresholded image was inverted and segmented based on the Voronoi method, which partitions the image by lines of points having equal distance to the borders of the two nearest particles.
-
8.
To retrieve the signal for each biomarker from each cell:
-
a.
The HER2 and CK signals were measured around the border of each cell by making a band of 10 pixel width centered in the border.
-
b.
Each cell was shrunk by 5 pixels and the mean DAPI intensity was measured.
-
a.
Examples of the result of this procedure are shown in Fig. 2.
The regions in which the image is partitioned by this algorithm define a cell in the majority of cases, but for those that correspond to the background or to only a part of a cell, we excluded them from all subsequent analysis using robust filtering methods:
-
1.
All the regions were sorted by area, and both the bottom and the top 5% were excluded; this step filters out the regions corresponding to parts of cells (small areas) and large background regions (large areas).
-
2.
All remaining regions were sorted by mean DAPI intensity and the bottom 5% was excluded; this step filters out the background regions (low DAPI signal).
3.2. Quantitative Biomarker Analysis of Breast Cancer Cell Lines
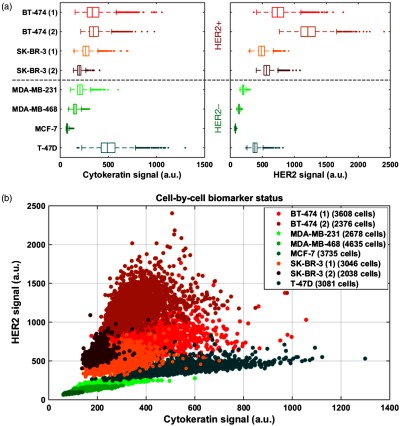
We performed on-chip staining, fluorescence imaging, and image processing on four cases of HER2+ cell lines and four cases of HER2− cell lines. Among the two biomarkers, none of them defines a clear separation between HER+ and HER2− status, and their distributions partially overlap [Fig. 3(a)]. We also plotted the cell-by-cell status in the HER2 versus CK scatter plot [Fig. 3(b)]. We observe that the cells belonging to a particular cell line cluster together in the biomarker expression plot, as expected. Moreover, duplicates of HER2+ cell lines (SK-BR-3 and BT-474) are also close to each other. This indicates that the experimental and analytical procedure reliably quantifies the expression of the biomarkers despite the potential technical variations of the staining and the imaging steps (e.g., excitation light intensity, washing efficiency, and temperature) between a slide and another, which can explain the small differences between duplicates of the same cell line. Furthermore, we observe that HER2+ and HER2− cell lines likely cluster apart following a straight line with positive slope. This can provide a robust method to distinguish between positive and negative cases.
Fig. 3.
Biomarker status in breast cancer cell lines: (a) box-plot of CK and HER2 expression for several cell lines and (b) HER2 expression versus CK expression for several cell lines.
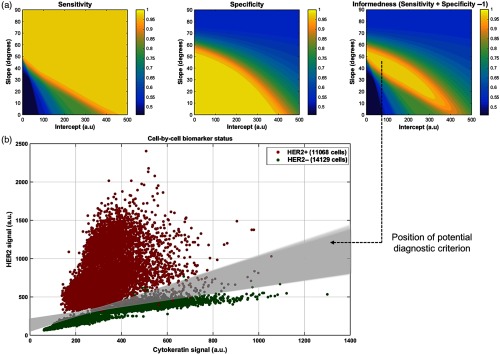
To test a potential diagnostic criterion to split HER2+ and HER2− cells using a simple straight line in the biomarker-expression scatter plot, we calculated the number of true negatives (TN), true positives (TP), false negatives (FN), and false positives (FP) from the scatter plot for all the possible straight lines with positive slope. These quantities are defined as: true (resp. false) positives all the HER2+ (resp. HER2−) cells lying above the line and true (resp. false) negatives all the HER2− (resp. HER2+) cells lying below the line. We subsequently calculated the sensitivity (), the specificity (), and the informedness () of the test [Fig. 4(a)], which are major clinically relevant parameters used in the field of diagnostics.15 We observe that sensitivity and specificity are mainly mutally exclusive [Fig. 4(a) left and middle] as expected,15 but there is a region within which any straight line splits the positive and the negative populations of cells in a very reliable fashion with In [Fig. 4(a) right]. This could, therefore, provide an effective and robust diagnostic criterion for HER2-type breast carcinoma, using HER2+ and HER2− cell lines as control samples to set the threshold line [Fig. 4(b)].
Fig. 4.
Diagnostics analysis based on biomarker expression. (a) Sensitivity, specificity, and informedness of a potential diagnostic test that uses a straight line to split HER2+ and HER2− cells, as a function of its slope and intercept in the HER2-/CK-expression scatter plot. (b) HER2-/CK-expression scatter plot. Any straight line included in the gray-shaded region provides informedness .
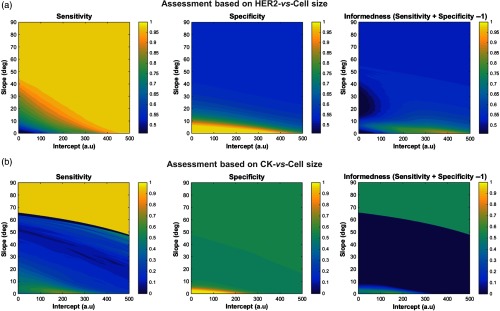
Beyond the information on the biomarker expression, we explored the possibility to use the cell size as another indicator of the cancer status (Fig. 5) and found that the performance in the discrimination of cells is much less effective (i.e., lower informedness), which confirms the similarity in size of HER2+ and HER2− cancer cells identifiable in cancer tissues.4,10
Fig. 5.
Diagnostics analysis based on biomarker expression and cell size. (a) and (b) Sensitivity, specificity, and informedness of a potential diagnostic test as in Fig. 4, but using the cell size as variable together with one of the two biomarkers.
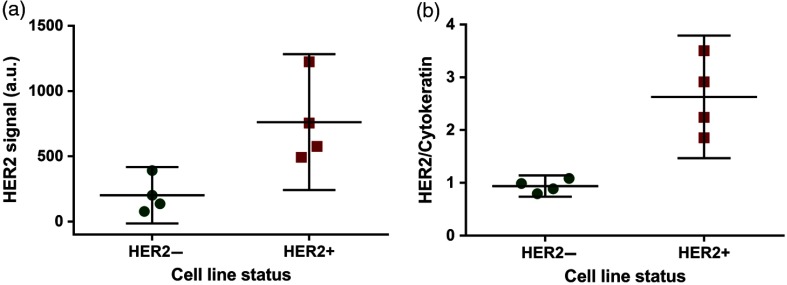
Finally, to quantitatively compare to what was observed previously on tissue samples at a tile level,10 we computed the average cell HER2/CK ratio of the different samples and showed it together with the HER2 signal of the same samples (Fig. 6). When using the HER2 signal alone [Fig. 6(a)], the 95% confidence intervals of HER2− and HER2+ samples overlap, which show the indistinguishability of the two types. Whereas, when adjusting for CK expression at single-cell level [Fig. 6(b)], the two types are much more separated.
Fig. 6.
HER2 signal versus HER2/CK ratio. (a) Cell-based HER2 signal, average and 95% confidence interval for the positive and negative cell lines. (b) Cell-based HER2/CK, average and 95% confidence interval for the positive and negative cell lines.
4. Discussion
In this work, we presented an ultrafast experimental and analytical method to robustly discriminate HER2+ and HER2− breast cancer cells at single-cell level. This technique based on microfluidic immunostaining with fluorescence imaging coupled to high-throughput cell segmentation offers a quantitative assessment of the cell-by-cell HER2 and CK status in breast cancer cell lines. Using the HER2- and CK-expression scatterplot, we achieved a strong discrimination of different cell types of various HER2 status in a highly sensitive and specific manner, paving the way for standardized HER2 protein assessment for diagnostic use. Given the current lack of a methodology to precisely evaluate the HER2 overexpression in breast cancer patients with robust clinical controls, we anticipate that our quantitative cell-based approach will have an important impact on the creation of clinical standards. In the future, we can apply this method to breast cancer tissues from patients. The clinical results can be thus benchmarked with the cell line staining for an accurate HER2 classification, eventually in a high-throughput manner. This study is the first step to realize this aim, giving the opportunity to disentangle the technical variability of the method itself from the biological variability usually present in tissue samples. Moreover, its potential coupling with diverse experimental techniques for breast cancer assessment (e.g., fluorescence in situ hybridization, assessment of estrogen/progesteron receptors) and with advanced statistical modeling can provide unprecedented detailed information on key features, such as intratumoral heterogeneity at the cell level.
Acknowledgments
We thank the European Union Ideas Program for supporting this work (Grant No. ERC-2012-AdG-320404).
Biographies
Daniel Migliozzi received his BSc degree in engineering physics from Politecnico di Milano, Italy, in 2011. He received a double MSc degree in bioengineering from École Polytechnique Fédérale de Lausanne (EPFL), Switzerland, and Ecole Polytechnique, France, in 2014. He worked on research projects in collaboration with CEA-LETI, France, Nestlé, and Lunaphore Technologies, Switzerland. Currently, he is a PhD candidate at EPFL, where he develops optical and microfluidic technologies for cancer diagnostics and live-cell imaging. He is a student member of SPIE.
Huu T. Nguyen received his MSc degree in nanotechnologies from Ecole Centrale de Lyon, INSA de Lyon, Université Claude Bernard, France, in 2013 and his PhD in microsystems and microelectronics from EPFL, Switzerland, in 2018. His research focuses on the development of technologies for breast cancer diagnostics.
Martin A. M. Gijs received his MSc degree in physics from the Katholieke Universiteit Leuven, Belgium, in 1981 and his PhD in physics from the same university in 1986. He joined the Philips Research Laboratories, Eindhoven, The Netherlands, in 1987. He joined EPFL in 1997. His present interests are in developing technologies for innovative magnetic devices, new microfabrication technologies for microsystems fabrication in general, and the development and use of microsystems technologies for microfluidic and biomedical applications in particular.
Disclosures
The authors declare no conflicts of interest.
References
- 1.Vogel C. L., et al. , “Efficacy and safety of Trastuzumab as a single agent in first-line treatment of HER2-overexpressing metastatic breast cancer,” J. Clin. Oncol. 20, 719–726 (2002). 10.1200/JCO.2002.20.3.719 [DOI] [PubMed] [Google Scholar]
- 2.Wolff A. C., et al. , “Recommendations for human epidermal growth factor receptor 2 testing in breast cancer: American Society of Clinical Oncology/College of American Pathologists clinical practice guideline update,” J. Clin. Oncol. 31, 3997–4013 (2013). 10.1200/JCO.2013.50.9984 [DOI] [PubMed] [Google Scholar]
- 3.Perez E. A., et al. , “HER2 testing: current status and future directions,” Cancer Treat. Rev. 40, 276–284 (2014). 10.1016/j.ctrv.2013.09.001 [DOI] [PubMed] [Google Scholar]
- 4.Potts S. J., et al. , “Evaluating tumor heterogeneity in immunohistochemistry-stained breast cancer tissue,” Lab. Invest. 92(9), 1342–1357 (2012). 10.1038/labinvest.2012.91 [DOI] [PubMed] [Google Scholar]
- 5.Vance G. H., et al. , “Genetic heterogeneity in HER2 testing in breast cancer: panel summary and guidelines,” Arch. Pathol. Lab. Med. 133, 611–612 (2009). [DOI] [PubMed] [Google Scholar]
- 6.Nitta H., et al. , “The assessment of HER2 status in breast cancer: the past, the present, and the future,” Pathol. Int. 66(6), 313–324 (2016). 10.1111/pin.2016.66.issue-6 [DOI] [PubMed] [Google Scholar]
- 7.Ciftlik A. T., Lehr H.-A., Gijs M. A. M., “Microfluidic processor allows rapid HER2 immunohistochemistry of breast carcinomas and significantly reduces ambiguous (2+) read-outs,” Proc. Natl. Acad. Sci. U.S.A 110, 5363–5368 (2013). 10.1073/pnas.1211273110 [DOI] [PMC free article] [PubMed] [Google Scholar]
- 8.Brajkovic S., et al. , “Microfluidics for rapid cytokeratin immunohistochemical staining in frozen sections,” Lab. Invest. 97, 983–991 (2017). 10.1038/labinvest.2017.49 [DOI] [PMC free article] [PubMed] [Google Scholar]
- 9.Subik K., et al. , “The expression patterns of ER, PR, HER2, CK5/6, EGFR, Ki-67 and AR by immunohistochemical analysis in breast cancer cell lines,” Breast Cancer 4, 35–41 (2010). 10.1177/117822341000400004 [DOI] [PMC free article] [PubMed] [Google Scholar]
- 10.Dupouy D. G., et al. , “Continuous quantification of HER2 expression by microfluidic precision immunofluorescence estimates HER2 gene amplification in breast cancer,” Sci. Rep. 6, 20277 (2016). 10.1038/srep20277 [DOI] [PMC free article] [PubMed] [Google Scholar]
- 11.Kwon S., et al. , “Automated measurement of multiple cancer biomarkers using quantum-dot-based microfluidic immunohistochemistry,” Anal. Chem. 87, 4177–4183 (2015). 10.1021/acs.analchem.5b00199 [DOI] [PubMed] [Google Scholar]
- 12.Kwon S., et al. , “A microfluidic immunostaining system enables quality assured and standardized immunohistochemical biomarker analysis,” Sci. Rep. 7, 45968 (2017). 10.1038/srep45968 [DOI] [PMC free article] [PubMed] [Google Scholar]
- 13.Holliday D. L., Speirs V., “Choosing the right cell line for breast cancer research,” Breast Cancer Res. 13, 215 (2011). 10.1186/bcr2889 [DOI] [PMC free article] [PubMed] [Google Scholar]
- 14.Nguyen H. T., et al. , “Microfluidics-assisted fluorescence in situ hybridization for advantageous human epidermal growth factor receptor 2 assessment in breast cancer,” Lab. Invest. 97, 93–103 (2017). 10.1038/labinvest.2016.121 [DOI] [PubMed] [Google Scholar]
- 15.Fawcett T., “An introduction to ROC analysis,” Pattern Recognit. Lett. 27, 861–874 (2006). 10.1016/j.patrec.2005.10.010 [DOI] [Google Scholar]


