Abstract.
Surgical excision of the whole prostate through a radical prostatectomy procedure is part of the standard of care for prostate cancer. Positive surgical margins (cancer cells having spread into surrounding nonresected tissue) occur in as many as 1 in 5 cases and strongly correlate with disease recurrence and the requirement of adjuvant treatment. Margin assessment is currently only performed by pathologists hours to days following surgery and the integration of a real-time surgical readout would benefit current prostatectomy procedures. Raman spectroscopy is a promising technology to assess surgical margins: its in vivo use during radical prostatectomy could help insure the extent of resected prostate and cancerous tissue is maximized. We thus present the design and development of a dual excitation Raman spectroscopy system (680- and 785-nm excitations) integrated to the robotic da Vinci surgical platform for in vivo use. Following validation in phantoms, spectroscopic data from 20 whole human prostates immediately following radical prostatectomy are obtained using the system. With this dataset, we are able to distinguish prostate from extra prostatic tissue with an accuracy, sensitivity, and specificity of 91%, 90.5%, and 96%, respectively. Finally, the integrated Raman spectroscopy system is used to collect preliminary spectroscopic data at the surgical margin in vivo in four patients.
Keywords: Raman spectroscopy, prostate cancer, robotic surgery
1. Introduction
Prostate cancer is the second most frequently diagnosed cancer worldwide.1 In the United States, in 2015, there were an estimated 220,800 new cases and 27,540 deaths, namely of all cancer-related deaths.2 Surgical excision of the whole prostate through radical prostatectomy is an important part of the standard of care for prostate cancer. Recent large surveys of the SEER and National Cancer databases show an increase in the use of radical prostatectomy to 40% to 55% of cases, while rates of radiotherapy-based treatment have decreased for medium- and high risk patients over the past decade.3,4 Radical prostatectomy procedures can be performed either using open or minimally invasive techniques (classic laparoscopy or robotic-assisted surgical methods). Minimally invasive techniques have comparable clinical outcomes; however, robotic-assisted prostatectomy procedures lead to shorter hospital stays, less blood loss, and reduced complication rates.5 Furthermore, robotic surgery provides magnified, stereoscopic, high-definition visualization, a wide range of motion (seven degrees of freedom), elimination of tremor, and surgeon comfort at a seated console.6 Adoption of the robotic surgery systems has also been rising over the last decade: a retrospective study of prostatectomies performed in the U.S. found adoption rates for robotic surgery leaping from 0.7% in 2003 to 42% in 2010.7
The clinical objective of a radical prostatectomy procedure is the complete removal of the organ while sparing nerves and other surrounding tissues. Removing the entirety of the prostate is made difficult by the lack of a clear histological capsule which often results, in part due to limitations of current tissue imaging techniques, in prostate tissue being left in the surgical cavity after the procedure in as many as 29% of cases.8 This is an important clinical problem often leading to biochemical recurrences, namely a rise in the blood level of prostate-specific antigen (PSA) in prostate cancer patients after the surgical treatment, which may misleadingly be interpreted as disease recurrence. However, none of the currently available technologies to identify cancerous tissue (including histopathology, computed tomography, magnetic resonance imaging, positron emission tomography scans and ultrasound) can be used reliably during surgery.
Raman spectroscopy is an emerging technology that has shown promising results for highly sensitive and specific molecular tissue characterization.9–11 It is based on the detection of inelastically scattered light following tissue excitation with monochromatic light. The resulting spectral shifts are associated with molecular vibrations and provide an avenue for precise and quantitative fingerprinting as different molecular species have their own spectral signature. Raman spectroscopy has previously been shown by our group to detect glioma in vivo during surgery by successfully differentiating normal brain from cancer tissue in 17 patients with grade 2 to 4 gliomas with a sensitivity of 93% and a specificity of 91%.12 More recently, a multimodal (fluorescence spectroscopy, diffuse reflectance spectroscopy, and Raman spectroscopy) optical cancer detection system was used to show that brain, lung, colon, and skin cancers could be detected in situ during surgery with an accuracy, sensitivity, and specificity of 97%, 100%, and 93%, respectively.13 Raman spectroscopy has also very recently been integrated to a commercial biopsy needle for in vivo targeted brain cancer tissue biopsies.14 More specific to prostate cancer, in a study involving 32 fresh and nonprocessed human prostate specimens obtained immediately following radical prostatectomy, Raman spectroscopy distinguished prostatic from extra prostatic tissue with sensitivity/specificity of 82%/83%, and benign from malignant tissue with sensitivity/specificity of 87%/86%.15 Other works have also demonstrated the utility of Raman spectroscopy for prostate cancer detection: it has been shown to identify cancer cells with high accuracy in vitro in a study where four different cell lines varying from benign prostate cells to prostate adenocarcinoma were identified with a sensitivity and a specificity of 96% to 100% and 99% to 100%, respectively.16 Using 38 prostate samples, classification algorithms trained on 197 Raman spectra were shown to distinguish benign prostate, hyperplasia, and inflammation from prostate cancer with an accuracy of 86%.17 In a study involving 27 patients, prostate cancer could be classified into Gleason scores (GS) , and with an accuracy of 89%.18
Previous Raman spectroscopy work shows promise to leverage the molecular specificity of the method to distinguish both benign and cancerous prostatic tissue from surrounding organs/structures which in turn could improve outcomes of radical prostatectomy. Robotic-assisted surgical systems provide an ideal platform for the integration and clinical translation of Raman spectroscopy. As such, this work demonstrates the design, engineering, and successful integration of a Raman spectroscopy system to a surgical robotics platform, its validation on a phantom, as well as preliminary ex vivo and in vivo spectroscopic data and associated classification results.
2. Methods
2.1. Raman Spectroscopy System
2.1.1. System overview
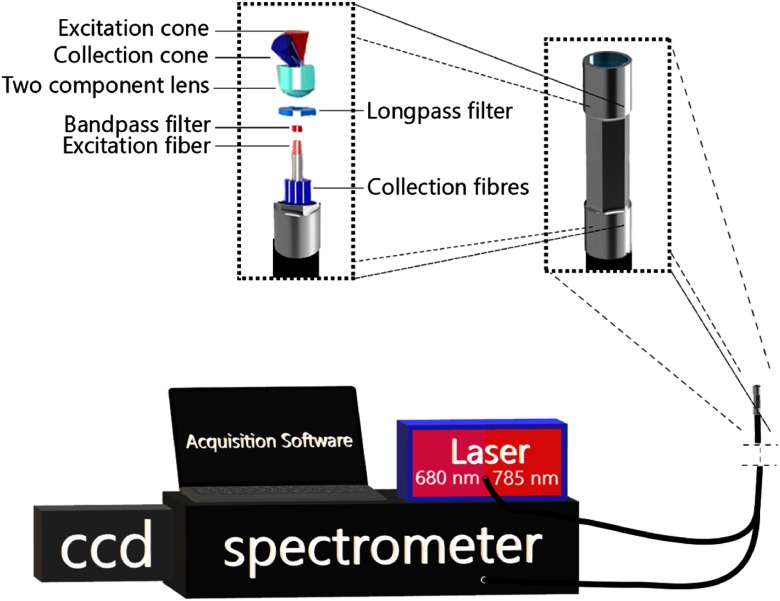
The Raman spectroscopy system is composed of a dual-wavelength laser source, a purpose-built spectrometer (Emvision LLC., Loxahatchee, Florida), a high-resolution CCD camera (Andor Newton 920), and a custom probe (Emvision LLC.) adapted for laparoscopic use. The dual-wavelength laser (Innovative Photonics Solutions, model # 0811A100-B Fat Boy) provides interchangeable 680- and 785-nm excitation to the optical probe through a single-optical fiber (0.22 NA, FC/PC connector, diameter core). The spectrometer was designed to capture both the fingerprint (785-nm excitation) and high wavenumber (680-nm excitation) Raman spectra through the same slit (width: ) and grating. Table 1 shows the physical properties of the spectrometer for each spectral region.
Table 1.
Principal technical specification of the Raman spectroscopy system.
| Excitation wavelength (nm) | Spectral range () | Interrogated area diameter (mm) | Delivered power (mW) | Spectral resolution (nm) |
|---|---|---|---|---|
| 680 | 2500 to 4000 | 0.5 | 0 to 150 | 0.1 to 0.2 |
| 785 | 500 to 2000 | 0.5 | 0 to 150 | 0.1 to 0.2 |
The custom-built probe is a redesign of an instrument developed by our group for work on in vivo human brain studies.12 Briefly, lenses and filters disposed at the distal end of the probe allow for collection of the spectroscopic signal from which the Raman contribution can be isolated using optical fibers: a single central fiber for tissue excitation and 12 concentric fibers for detection (Fig. 1). A bandpass 785-nm interference filter is placed in front of the excitation fiber for laser line clean-up and a donut-shaped long-pass filter used in front of the collection to reduce the impact of Rayleigh scattered light in the detection path. The filters also eliminate the silica Raman signal created from the optical fibers. Other than the fact both high wavenumber and fingerprint detection can be achieved with the system, the main difference with respect to our neurosurgery instrument is that the outer casing of the new probe was designed to facilitate robotic grasping. It consists of a 12-mm-long stainless steel cylinder with a 2.5 mm (2.3 hex flat to hex flat) outer diameter. The central portion of the outer casing is machined to have a hexagonal cross section such that all opposing faces of the outer portion are flat and parallel making easy to be clamped by a standard grasping instrument such as a needle driver or a ProGrasp (Intuitive Surgical #470093) forceps. The probe is connected to the Raman spectroscopy system through a 3-m-long fiber optics cable wrapped in a housing flexible enough to allow for the probe to be inserted into the surgical cavity and manipulated by the robotic-assisted surgical system. The probe is made of materials compatible with standard Sterrad sterilization procedures to allow for reuse between procedures.
Fig. 1.
Visual representation of the Raman spectroscopy system designed and built for integration in a robotic-assisted surgical system. Depicted is a close-up view of the hexagonal profile machined on the probe tip to facilitate grasping using standard robotic equipment. A blown up view of the main optical elements making up the probe is shown as well as a schematic representation of the coincident excitation and detection light cones.
Spectroscopic data acquisition (CCD detection triggered and precisely timed with laser activation) was coordinated using software written in C++ and Qt. From a high level, the software allows the system operator to perform calibration (see Sec. 2.1.2), set acquisition parameters (laser power, imaging time, camera gain, and number of repeat measurements), perform acquisitions, and view results (both raw and processed spectra) in real time. The software also allows for automatic calculation of optimal laser power for each wavelength to occupy maximum dynamic range of the camera by performing low-power acquisitions with each wavelength and extrapolating optimal power. Laser power calibration is performed using this software and a powermeter (PM1000D, Thorlabs) prior to each use.
2.1.2. Spectral preprocessing
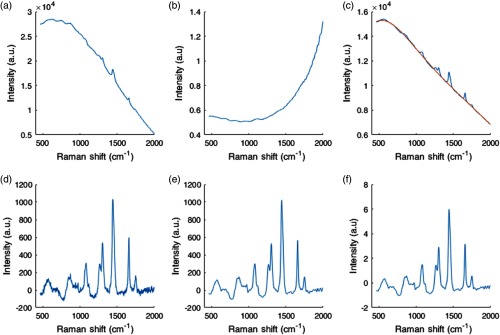
Several processing steps were applied to each acquired raw spectrum to isolate the vibrational spectroscopy contribution from background light (e.g., ambient light, intrinsic tissue fluorescence) and system response function. Each acquisition consisted of 10 to 15 consecutive spectra that were averaged together and from which a dark noise measurement (spectrum acquired with laser off) was subtracted to correct for dark noise and ambient light contributions. Spectra were then scaled for relative intensity changes using a NIST 2241 SRM standard19 lending Raman spectra corrected for the instrument response.20 Remaining background contributions, including intrinsic tissue fluorescence, were then removed using an automated subtraction algorithm developed by Zhao et al.21,22 The spectra were then smoothed with a Savitsky–Golay filter (of order 2 and with a frame size of 11) and normalized using standard normal variate (SNV) normalization. The calibration of the -axis of the fingerprint spectra was performed by direct comparison with acetaminophen peaks from the literature.23 Briefly, peaks on an acetaminophen spectrum measured with the system are manually identified and a second-degree polynomial fit is calculated between measured and literature peaks to generate a calibrated -axis for the system. For the high wavenumber region, the calibrated -axis in wavenumbers for the fingerprint region was converted to nanometers using the known 785-nm excitation wavelength and back to Raman shifts using the known 680-excitation wavelengths (precise excitation wavelengths within 0.1 nm were provided by the laser manufacturer) (Fig. 2).
Fig. 2.
Preprocessing steps for a 785-nm fingerprint ex vivo prostate Raman spectrum. (a) Raw spectrum after averaging and dark noise subtraction, (b) NIST correction curve shown for visualisation of instrument response features. (c) Raw spectrum multiplied by the NIST correction curve (blue curve) and polynomial fit computed to estimate the fluorescence background contribution (orange). (d) Subtraction of the fluorescence background curve from the NIST corrected raw spectrum in (c). (e) Savitsky–Golay filtered signal to eliminate high-frequency noise. (f) SNV-normalized spectrum.
2.1.3. Optical probe integration in a robotic-assisted surgical system
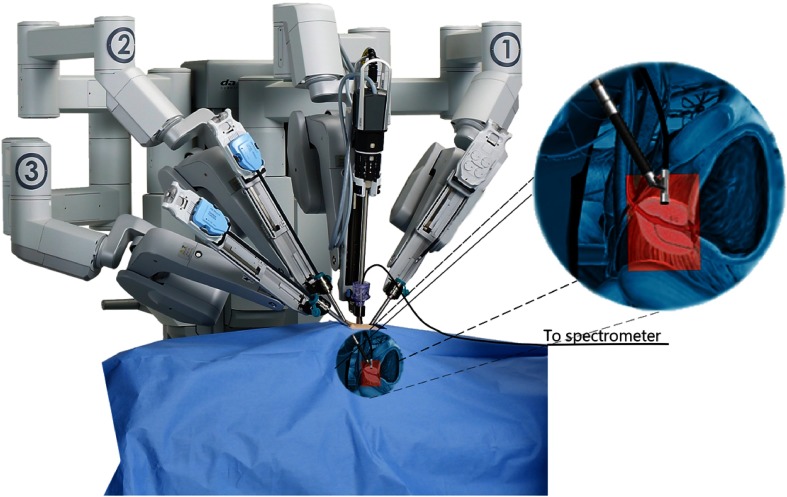
The Raman probe system was integrated with a robotic-assisted surgical system (daVinci Xi, Intuitive Surgical) to allow Raman spectroscopy tissue interrogation during radical prostatectomy procedures. Integration of the spectroscopy system with the robotic-assisted surgical system imposed several constraints on the design, including the fact the probe needed to be inserted into the patient through an assistant port that consists of an 8- to 12-mm trocar placed through the patient’s abdomen. Moreover, the mechanical design needed to allow the surgeon to grasp, manipulate, and immobilize the probe using a standard robotic grasping instrument. Integration also needed to provide enough flexibility to perform measurements at various angles throughout the surgical cavity despite a design based on optical fibers with limited bending radii. Figure 3 shows an overview of the design constraints imposed and how the Raman spectroscopy probe was integrated with the robotic platform to allow intraoperative measurements.
Fig. 3.
Representation of the Raman spectroscopy probe integrated with the da Vinci robot-assisted surgical system composed of four independently controllable robotic arms (three visible here, labeled 1, 2, and 3). The arms have interchangeable instruments and the probe was manufactured to be compatible with grasping instruments (such as the Prograsp or needle driving arm manufactured by Intuitive surgical). The grasping arm is shown grasping the Raman spectroscopy probe for intraoperative measurements, with a magnified view (target anatomy highlighted in red) provided as an aid to visualization.
A phantom was fabricated and used in the scope of an experiment to verify that the integration of the spectroscopy system with the robot-assisted surgery platform allowed repeatable measurements to be achieved over a sufficiently broad range of fiber optics cable curvatures. The phantom consisted of a 6.5-cm-diameter (consistent with the size of a diseased human prostate) hemisphere with regularly spaced 3-mm-diameter insertions along intersecting arcs on the surface [Fig. 4(a)]. The insertions were evenly spaced across two perpendicular great circles of the hemispheres (11 for each great circle, between insertions). The phantom was built using a 3-D printer (Prusa i3) and the insertions were filled using a silicone mixture (GE 100% silicone) with clearly distinguishable vibrational spectroscopy features and relatively low-fluorescence level. A trained robotic surgeon was asked to manipulate the probe and put it in contact with all insertions along one of the two arcs without letting go of the probe. A spectroscopy measurement was obtained each time contact was made between the probe and an insertion, totaling 11 raw average Raman spectra acquired and processed as described in Sec. 2.1.2. This allowed data to be acquired for various optical cable bending radii for angles (between the main axis of the probe and the base of the phantom) ranging from 0 deg to 90 deg.
Fig. 4.
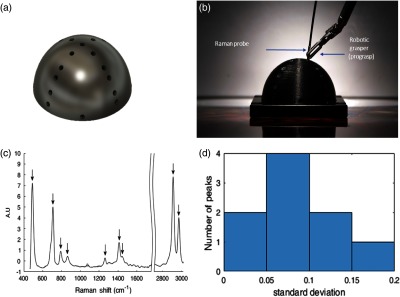
(a) Conceptual view of the prostate-simulating phantom used for validation, (b) Raman spectroscopy probe manipulated by a surgeon using a robot-assisted surgical system to measure the spectrum of silicone inserts, (c) mean and standard deviation computed from all SNV-normalized Raman spectra acquired on the silicone inserts with the most prominent Raman peaks of the material identified with arrows. As the variances in (c) are too small to be visualized, (d) a histogram of the standard deviation between the spectra acquired at each phantom location across all nine peaks identified is shown in the same units as the processed spectra (e.g., two peaks have standard deviation between 0 and 0.05).
2.2. Data Collection on Ex Vivo Human Prostates
This portion of the study was designed to characterize Raman spectra associated with prostatic tissue. Spectroscopic data were collected directly on freshly excised whole human prostates following radical prostatectomy. The measurements were performed on a mobile cart equipped with the Raman spectroscopy platform and a light-tight box ensuring minimum levels of ambient light contributions. Using an adjustable arm, the probe was securely placed in contact with freshly excised, nonprocessed prostate tissue at the plane of resection, the doors to the dark box were closed, and measurements were performed. Specifically, 10 to 15 spectra per point were acquired, the on-tissue laser power was automatically computed between 0 and 150 mW using the automated power adjustment routine (see Sec. 2.1.1), camera gain was set to , and exposure time at 75 to 100 ms per spectrum. Measurements were planned according to grossly estimated prostate anatomy; for each prostate, spectra were collected on the apex, the base, the left and right lateral lobes, the posterior face, the left and, when possible, the right seminal vesicles and the vas deferens canals (Fig. 5). The ex vivo study was approved by the institutional ethics Review Board (CHUM Research Center, Montreal, Canada, REB #17.149), and all methods were performed in accordance with the relevant guidelines and regulations. More details on the data acquisition protocol can be found in previous work using Raman spectroscopy for prostate tissue characterization.15 In total, 599 spectra were acquired from 20 patients (on average 30 spectra per patient) and grouped by anatomical regions (Table 2). Acquisition times totaled per point including spectral preprocessing and display. Overall, for each prostate acquisition time (including tissue sample handling and probe positioning) totaled 30 to 45 min per prostate after which the specimen followed routine pathological analysis.
Fig. 5.
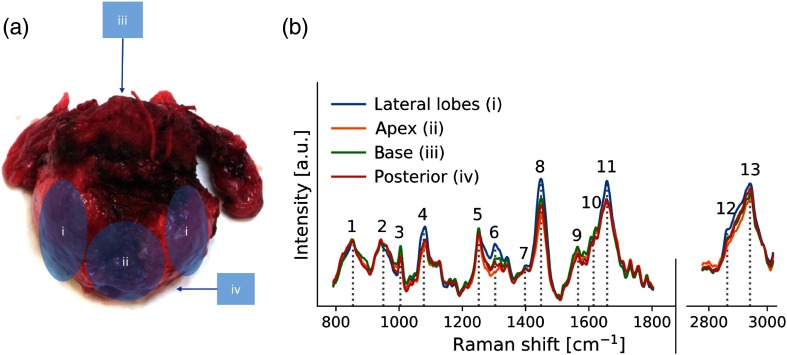
(a) Prostate regions surveyed using the Raman spectroscopy probe: (i) left and right lateral lobes, (ii) apex, (iii) base, and (iv) posterior. (b) Mean ex vivo spectra measured for each region across 20 patients with prominent Raman bands identified (see Table 4).
Table 2.
Distribution of ex vivo Raman spectra acquired on whole prostates following radical prostatectomy procedures.
| Anatomical region | Subregion | Number of spectra |
|---|---|---|
|
Anterior |
Total | 383 |
| Apex | 102 | |
| Base | 108 | |
| Lateral lobes |
173 |
|
|
Posterior |
|
105 |
|
Extraprostatic |
Total | 120 |
| Vas deferens | 41 | |
| Seminal vesicles |
79 |
|
| Total | 599 |
2.3. In Vivo Data Collection During Robotic-Assisted Radical Prostatectomy Procedures
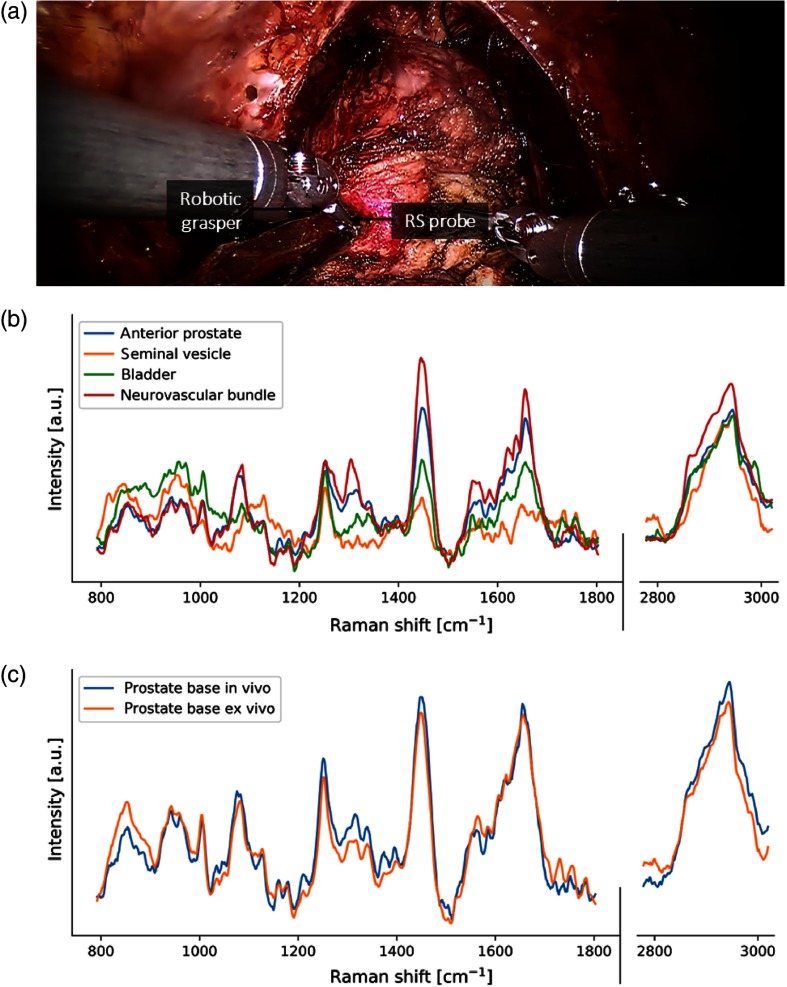
Raman spectra of prostate tissue near the surgeon’s plane of resection around the prostate (at the surgical margin) were acquired in vivo using the Raman spectroscopy system in combination with a robotic-assisted surgical platform (daVinci Xi, Intuitive Surgical). The in vivo study was approved by the institutional ethics Review Board (CHUM Research Center, Montreal, Canada, REB #17.149), and all procedures were performed in accordance with the relevant guidelines and regulations. Toward the end of the prostatectomy procedure, the probe was inserted into the patient’s abdominal cavity and manipulated by the surgeon using a forceps robotic instrument (Intuitive Surgical #470093). The surgeon placed the probe on each point of interest by establishing visual contact between the probe tip and tissue and applying minimal pressure [Fig. 7(a)]. Actions were taken to avoid contamination of the Raman spectrum from blood that is not specific to the tissue of interest: (1) the surgeon was asked to avoid areas contaminated by blood, (2) a laparoscopic assistant was present to suction away any excess blood, (3) increased pressure in the abdomen from insufflation (standard for robot-assisted radical prostatectomy procedures24) reduced bleeding. Before each measurement, the probe was locked into place long enough to allow spectroscopic data acquisition using the same procedure as described in Sec. 2.2. Measurement locations were chosen by the surgeon to match the gross anatomical regions identified in the ex vivo study and were recorded by the Raman system operator. Acquisition times totaled per point including spectral preprocessing and display—quick enough for real-time interrogation of tissue with little perturbation to surgical workflow. In vivo spectroscopic data were acquired during four robotic-assisted radical prostatectomy procedures for different prostate regions either associated with prostatic (anterior region only) or extraprostatic tissue (Table 3).
Fig. 7.
(a) Close up views of Raman spectroscopy probe during spectral acquisition on prostate base in vivo, (b) mean spectra of specific tissue classes acquired in vivo, and (c) comparison of average in vivo and ex vivo spectra for the base prostate region.
Table 3.
Distribution of in vivo Raman spectra acquired in surgical cavity during radical prostatectomy procedures in four patients.
| Anatomical region | Subregion | Number of spectra |
|---|---|---|
|
Anterior |
Total | 7 |
| Apex | 1 | |
| Base |
6 |
|
|
Extraprostatic |
Total | 13 |
| Neurovascular Bundle | 5 | |
| Seminal vesicles | 3 | |
| Bladder |
5 |
|
| Total | 20 |
3. Results
3.1. Integration of the Raman Spectroscopy System with the Robotic-Assisted Surgical Platform
The spectroscopic data acquired for multiple angles on the validation phantom using the Raman spectroscopy robotic-assisted surgical system are shown in Fig. 4(c). The Raman spectra were computed by evaluating the mean of the spectra measured on the 11 silicone inserts along a hemispheric arc of the phantom. As demonstrated by the small standard deviation (plotted but indistinguishable in the figure), minimal variation occurs across all spectra despite increases in the bending radius of the optics cable. A histogram of the measurements standard deviation was computed to provide a more quantitative representation of the variance [Fig. 4(d)]. Measurements were acquired across all points on a 180 deg arc of the phantom without having to let go of the probe and without imposing significant bending/strain on the optical fibers. However, the minimum bend radius of the optical fibers is not necessarily a critical consideration with the proposed drop-in design. In fact, the thickest fiber in the probe has a minimum bend radius of . Bending this extreme is easily avoidable with this design for two reasons: slack provided by the 1.5 m of fiber allows for larger bend radii and the drop-in design allows for the probe to be picked up at different instrument angles.
3.2. Ex Vivo and In Vivo Raman Spectroscopies in Robotic-Assisted Radical Prostatectomy Procedures
Figure 5(b) shows the mean (across all patients) ex vivo Raman spectra for each gross anatomical prostate regions that were interrogated. Several of the main peaks and bands usually associated with biological tissues are identified with numbers (1 to 13) in the figure, including the phenylalanine peak at , the amide III band around as well at the amide III band around .
Spectra originating from the prostate (apex, base, lateral lobes, and anterior face) were then grouped together and labeled as “prostate” spectra while spectra collected on surrounding anatomy (vas deferens, seminal vesicles) were labeled “extraprostatic” [Fig. 6(a)]. The prominent Raman bands were also observed in the “extraprostatic” tissue measurements, with perhaps the most apparent differences—when compared with prostate tissue—in and around the amide I band. Analysis was then performed to assess the performance of Raman spectroscopy in distinguishing prostate and extraprostatic spectra by creating a classification model using support vector machines. The model was created using the data associated with the full spectrum (no features selection) and was tested on an independent dataset. The latter consisted of 25% of all spectra randomly selected across the full dataset ensuring no data from the same patient were used in the training phase. Using this model, prostate tissue could be distinguished from extraprostatic tissue with an accuracy, sensitivity, and specificity of 91%, 90.5%, and 96%, respectively. These values were computed from the receiver-operating-characteristic (ROC) curve shown in Fig. 6(b), which has area-under-the-curve (AUC) of 0.96.
Fig. 6.
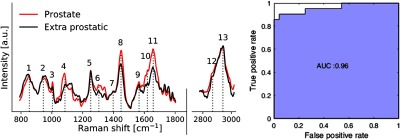
(a) Mean ex vivo Raman spectra for prostate and extra prostatic measurements and (b) ROC curve of corresponding classification result obtained using support vector machines.
Figure 7(b) shows the average in vivo Raman spectra associated with all interrogated prostate areas, showing that same spectral bands and peaks that were identified in the ex vivo spectra can be seen. Figure 7(c) shows the average in vivo and ex vivo Raman spectra associated with the base prostate region. In general, all spectra acquired in vivo express peaks in the same 13 spectral bands as those on ex vivo spectra (see Table 4 for peak/molecular identification). Direct visual comparison between mean in vivo and ex vivo spectra for the base region of the prostate demonstrates that they are similar in the fingerprint region based on the bands/peaks that are expressed as well as their relative intensities. However, the peaks in the high wavenumber region, however, have noticeably lower intensities for in vivo data when compared with ex vivo data.
Table 4.
Prominent biological tissue Raman bands identified on the ex vivo prostate spectra.
| Band identification label (see Fig. 5) | Wavenumber () | Molecular bond assignment | Molecular species | Molecules |
|---|---|---|---|---|
| 1 | 854 | C-O-C | Proteins | Tyrosine |
| 2 | 950 | Proteins | Proline, valine | |
| 3 | 1004 | C-C | Proteins | Phenylalanine |
| 4 | 1078 | C-C/C-O/amide II | Phospholipids, nucleic acids | |
| 5 | 1252 | DNA/RNA | Guanine, cytosine | |
| 6 | 1307 | Proteins, lipids | Collagen | |
| 7 | 1398 | Proteins, lipids | -carotene | |
| 8 | 1449 | Proteins, lipids | ||
| 9 | 1566 | Proteins | Tyrosine, tryptophan | |
| 10 | 1615 | Proteins | Tyrosine, tryptophan | |
| 11 | 1658 | Proteins, lipids | ||
| 12 | 2879 | Lipids, proteins | ||
| 13 | 2931 | Proteins |
4. Discussion
There is a clinical need in oncology for new technologies to allow accurate and rapid intraoperative molecular tissue characterization at the surgical margin during tumor resection interventions. Optimal disease management using surgery is critical for prostate cancer patients where positive surgical margins occur for as many as 1 in 5 radical prostatectomy cases.25 Limiting the risk of disease recurrence for patients undergoing radical prostatectomy can be achieved by ensuring that the prostate organ is completely removed and that the disease has not spread beyond the prostatic capsule. Ensuring that no prostate tissue is left in the cavity following the procedure can also help minimize false positives during postsurgical follow-ups based on PSA, which is secreted by both normal and malignant prostate cells. Residual prostatic benign tissue can lead to detectable serum PSA, which can be falsely interpreted at disease recurrence. The need to limit the resection of and damage to normal tissue is also critical in prostate cancer; for example, sparing nerves is critical to reduce the risk of erectile dysfunction and preserving continence.26,27 However, current standard of care technologies used to assist radical prostatectomy procedures are limited in their ability to provide detailed point-by-point molecular tissue characterization and thus cannot provide surgeons with the information they need to achieve optimal surgical outcome.
A growing number of radical prostatectomy procedures are performed worldwide using robotic-assisted surgical systems.7 This rise in robotic-assisted procedures provides a unique opportunity for the mechanical integration of new tissue characterization tools alongside standard robotic accessories (e.g., graspers, needle drivers, and cauterizers) for routine intraoperative use. These new tools could then be used to address the current needs in prostate surgery, namely: (i) prostate tissue detection, (ii) nerve sparring, and (iii) detection of cancer cells that have invaded beyond the confines of the prostate. The use of optical technologies such as Raman spectroscopy can provide an avenue for point-by-point molecular tissue characterization and highly accurate classification as demonstrated over the last decades by several groups.28,29 Given sufficiently large datasets (spectra and tissue class labels determined based on histopathology analyses), mathematical models can be trained using supervised learning techniques for live tissue classification.
In this work, we have presented the integration of Raman spectroscopy to a robotic-assisted surgical system. Specifically, we have presented the initial steps that led to the use of the spectroscopy platform for ex vivo tissue characterization as well as a feasibility study demonstrating—for the first time—measurements of Raman spectra in vivo at the surgical margin during robotic-assisted radical prostatectomy procedures. Validation of the spectroscopy system’s ability to acquire spectra at multiple angles compatible with those required for prostate measurements was assessed using a custom prostate-simulating phantom. Then, a preliminary clinical proof-of-principle study was presented based on ex vivo measurements. Using data acquired from 20 prostates (599 spectra in total), a classification model was produced based on support vector machines to distinguish prostate from extra prostatic tissue. Using a holdout validation dataset (25% of all spectra), the model was able to distinguish between prostatic and extraprostatic tissue with an accuracy of 91%, a sensitivity of 90.5%, and specificity of 96%.
Although those preliminary results are promising, the development of sufficiently general models for live and reliable intraoperative tissue characterization will not only require larger datasets, but also the development of modeling approaches that can perform independently of whether the measurements are made under ex vivo or in vivo conditions. As a first step in that direction, in this work we have demonstrated the feasibility of acquiring Raman spectra in vivo using a robotic-assisted surgical system and demonstrated the validity of the acquired spectra based on the detection of expected molecular vibrational modes in biological tissues as assessed by the presence of the main tissue bands and peaks (e.g., amide bands, phenylalanine peak). As a preliminary demonstration of the consistency between in vivo and ex vivo measurements, in vivo and ex vivo spectra from the base region of prostate were compared and demonstrated to be compatible in the fingerprint region, but significant relative intensity differences in the high wavenumber region were observed. The presence of blood in the surgical cavity could be among possible explanations for these discrepancies. Despite efforts made to reduce the amount of blood in the cavity (surgeon avoiding bloody areas, suction of excess blood, increased intra-abdominal pressure during laparoscopic procedures), residual blood left on the tip of the probe from contact on points measured could compromise signal quality. Measures should be taken in the future to address this issue either directly (such as wiping the probe tip between measurements) or indirectly (such as developing a classifier robust enough to perform despite the impact on signal quality). Developing a classifier that is valid for clinical use will require either the demonstration of interchangeability between the two datasets or collection of enough in vivo spectra to train a robust classifier.
Robotic integration was sufficient for this proof of concept though many improvements remain possible. First, spectral acquisitions were all dependent on the presence of an operator for the Raman spectroscopy system. Optimal integration of such a system will instead be controlled by the pedals and switches provided directly to the surgeon through the da Vinci surgeon console (as is the case for existing activated instruments such as cauterizing ones). Moreover, the current “drop in” design requires the optical probe to be grasped by a separate instrument. As a result, setting up the probe for spectral readings hampers the clinical workflow by interrupting the procedure for set- up and unnecessarily occupying a second robotic arm. The development of a custom robotic arm already integrated with the fibers, lenses, and filters required for Raman spectroscopy will allow for more seamless spectral acquisitions and reduce the time required to set up the instrument. The integrative work outlined above, however, lays the groundwork for further study into characterization of prostate tissue at the surgical margin using Raman spectroscopy and similar optical techniques. Data gathering at a larger scale will be a crucial step toward the development of clinically relevant and robust algorithms capable of providing surgeons with information regarding tissue make up in real time. This technology holds promise for detecting prostate tissue left behind at the margin leading to more complete but circumscribed resections, of localizing cancer’s spread when it extends out of the prostate and perhaps even of detecting nerves critical for erectile and urinary functions.
5. Conclusion
There is a strong clinical need for characterization of tissue (be it benign or cancerous) at the surgical margin during radical prostatectomy. The molecular specificity provided by Raman spectroscopy could be leveraged to achieve this goal given the right steps toward clinical translation. Here, for the first time, we have designed, built, and integrated a Raman spectroscopy system to a surgical robotics platform and demonstrated the feasibility of acquiring measurements in vivo in real-time during radical prostatectomy (). The same system was used on ex vivo human prostates () immediately following radical prostatectomy as a proof of concept that Raman spectroscopy can successfully be used to distinguish prostate tissue from surrounding organs and tissues with high accuracy.
Acknowledgments
This work was supported by a MEDTEQ/NSERC-CRD grant to F. Lesage and D. Trudel. The authors would like to thank Ian McDowall at Intuitive Surgical for providing parts and technical guidance; Sylvie Lau from Minogue Medical for providing invaluable training and technical assistance. Claudia Syed and Mirela Birlea for patient recruitment and technical support; Khaled Ajib for operating the da Vinci robot during phantom experiments. Rajeev Yadav from ODS Medical for technical guidance in spectral processing.
Biography
Biographies of the authors are not available.
Disclosures
F. Leblond is cofounder of ODS Medical Inc., a medical device company that seeks to commercialize the Raman spectroscopy system for real-time detection of tissue abnormalities.
References
- 1.Stewart B. W., Wild C. P., “World Cancer Report 2014,” International Agency for Research on Cancer, Lyon, France: (2014). [Google Scholar]
- 2.Siegel R. L., Miller K. D., Jemal A., “Cancer statistics, 2015,” CA Cancer J. Clin. 65, 5–29 (2015). 10.3322/caac.21254 [DOI] [PubMed] [Google Scholar]
- 3.Gray P. J., et al. , “Recent trends in the management of localized prostate cancer: results from the National Cancer Data Base,” J. Clin. Oncol. 32, 5066 (2014). 10.1200/jco.2014.32.15_suppl.5066 [DOI] [Google Scholar]
- 4.Chen J., et al. , “National trends in management of localized prostate cancer: a population based analysis 2004–2013,” The Prostate 78, 512–520 (2018). 10.1002/pros.v78.7 [DOI] [PubMed] [Google Scholar]
- 5.Akand M., et al. , “Open, laparoscopic and robot-assisted laparoscopic radical prostatectomy: comparative analysis of operative and pathologic outcomes for three techniques with a single surgeon’s experience,” Eur. Rev. Med. Pharmacol. Sci. 19, 525–531 (2015). [PubMed] [Google Scholar]
- 6.Estey E. P., “Robotic prostatectomy: the new standard of care or a marketing success?” Can. Urol. Assoc. J. 3, 488–490 (2009). 10.5489/cuaj.1182 [DOI] [PMC free article] [PubMed] [Google Scholar]
- 7.Chang S. L., et al. , “The impact of robotic surgery on the surgical management of prostate cancer in the USA,” BJU Int. 115, 929–936 (2015). 10.1111/bju.12850 [DOI] [PubMed] [Google Scholar]
- 8.Odisho A. Y., et al. , “Benign prostate glandular tissue at radical prostatectomy surgical margins,” Urology 82, 154–159 (2013). 10.1016/j.urology.2012.12.063 [DOI] [PMC free article] [PubMed] [Google Scholar]
- 9.Goyette A., et al. , “Sub-diffuse interstitial optical tomography to improve the safety of brain needle biopsies: a proof-of-concept study,” Opt. Lett. 40, 170–173 (2015). 10.1364/OL.40.000170 [DOI] [PubMed] [Google Scholar]
- 10.Kallaway C., et al. , “Advances in the clinical application of Raman spectroscopy for cancer diagnostics,” Photodiagn. Photodyn. Ther. 10, 207–219 (2013). 10.1016/j.pdpdt.2013.01.008 [DOI] [PubMed] [Google Scholar]
- 11.Jermyn M., et al. , “A review of Raman spectroscopy advances with an emphasis on clinical translation challenges in oncology,” Phys. Med. Biol. 61, R370–R400 (2016). 10.1088/0031-9155/61/23/R370 [DOI] [PubMed] [Google Scholar]
- 12.Jermyn M., et al. , “Intraoperative brain cancer detection with Raman spectroscopy in humans,” Sci. Transl. Med. 7, 274ra19 (2015). 10.1126/scitranslmed.aaa2384 [DOI] [PubMed] [Google Scholar]
- 13.Jermyn M., et al. , “Highly accurate detection of cancer in situ with intraoperative, label-free, multimodal optical spectroscopy,” Cancer Res. 77, 3942–3950 (2017). 10.1158/0008-5472.CAN-17-0668 [DOI] [PubMed] [Google Scholar]
- 14.Desroches J., et al. , “A new method using Raman spectroscopy for in vivo targeted brain cancer tissue biopsy,” Sci. Rep. 8, 1792 (2018). 10.1038/s41598-018-20233-3 [DOI] [PMC free article] [PubMed] [Google Scholar]
- 15.Aubertin K., et al. , “Mesoscopic characterization of prostate cancer using Raman spectroscopy: potential for diagnostics and therapeutics,” BJU Int. 122(2), 326–336 (2018). 10.1111/bju.2018.122.issue-2 [DOI] [PubMed] [Google Scholar]
- 16.Crow P., et al. , “The use of Raman spectroscopy to differentiate between different prostatic adenocarcinoma cell lines,” Br. J. Cancer 92, 2166–2170 (2005). 10.1038/sj.bjc.6602638 [DOI] [PMC free article] [PubMed] [Google Scholar]
- 17.Crow P., et al. , “Assessment of fiberoptic near-infrared Raman spectroscopy for diagnosis of bladder and prostate cancer,” Urology 65, 1126–1130 (2005). 10.1016/j.urology.2004.12.058 [DOI] [PubMed] [Google Scholar]
- 18.Crow P., et al. , “The use of Raman spectroscopy to identify and grade prostatic adenocarcinoma in vitro,” Br. J. Cancer 89, 106–108 (2003). 10.1038/sj.bjc.6601059 [DOI] [PMC free article] [PubMed] [Google Scholar]
- 19.ASTM International, “Standard guide for relative intensity correction of Raman spectrometers,” ASTM E2911–13, ASTM International, West Conshohocken, Pennsylvania: (2013). [Google Scholar]
- 20.Choquette S. J., et al. , “Relative intensity correction of Raman spectrometers: NIST SRMs 2241 through 2243 for 785 nm, 532 nm, and 488 nm/514.5 nm excitation,” Appl. Spectrosc. 61, 117–129 (2007). 10.1366/000370207779947585 [DOI] [PubMed] [Google Scholar]
- 21.Zhao J., et al. , “Automated autofluorescence background subtraction algorithm for biomedical Raman spectroscopy,” Appl. Spectrosc. 61, 1225–1232 (2007). 10.1366/000370207782597003 [DOI] [PubMed] [Google Scholar]
- 22.Guevara E., Implementation of the Vancouver Raman Algorithm, Vancouver (2016).Reference:ZhaoJ.et al., “Automated autofluorescence background subtraction algorithm for b..,” (2007).
- 23.McCreery Group, “Raman materials,” ~http://www.chem.ualberta.ca/~mccreery/ramanmaterials.html#acetamidophenol (24 July 2018).
- 24.Stolzenburg J.-U., Truss M. C., “Technique of laparoscopic (endoscopic) radical prostatectomy,” BJU Int. 91, 749–757 (2003). 10.1046/j.1464-410X.2003.04206.x [DOI] [PubMed] [Google Scholar]
- 25.Tan P. H., et al. , “International Society of Urological Pathology (ISUP) consensus conference on handling and staging of radical prostatectomy specimens. Working group 5: surgical margins,” Mod. Pathol. 24, 48–57 (2011). 10.1038/modpathol.2010.155 [DOI] [PubMed] [Google Scholar]
- 26.Briganti A., et al. , “Predicting erectile function recovery after bilateral nerve sparing radical prostatectomy: a proposal of a novel preoperative risk stratification,” J. Sex. Med. 7, 2521–2531 (2010). 10.1111/j.1743-6109.2010.01845.x [DOI] [PubMed] [Google Scholar]
- 27.Suardi N., et al. , “Nerve-sparing approach during radical prostatectomy is strongly associated with the rate of postoperative urinary continence recovery,” BJU Int. 111, 717–722 (2013). 10.1111/bju.2013.111.issue-5 [DOI] [PubMed] [Google Scholar]
- 28.Short M. A., et al. , “Development and preliminary results of an endoscopic Raman probe for potential in vivo diagnosis of lung cancers,” Opt. Lett. 33, 711–713 (2008). 10.1364/OL.33.000711 [DOI] [PubMed] [Google Scholar]
- 29.Lui H., et al. , “Real-time Raman spectroscopy for in vivo skin cancer diagnosis,” Cancer Res. 72, 2491–2500 (2012). 10.1158/0008-5472.CAN-11-4061 [DOI] [PubMed] [Google Scholar]


