

Highlights
▸ A longitudinal study investigating test–retest reliability of amygdala and PFC. ▸ Task activates emotion and face processing related brain areas. ▸ Over time, there are no differences in activation on group-level. ▸ Intra-subject reliability of bilateral amygdala activation is poor. ▸ Implications for longitudinal studies in clinical samples.
Keywords: Adolescence, Emotions, Faces, Limbic system, Longitudinal, Test–retest reliability
Abstract
Prior developmental functional magnetic resonance imaging (fMRI) studies have demonstrated elevated activation patterns in the amygdala and prefrontal cortex (PFC) in response to viewing emotional faces. As adolescence is a time of substantial variability in mood and emotional responsiveness, the stability of activation patterns could be fluctuating over time. In the current study, 27 healthy adolescents (age: 12–19 years) were scanned three times over a period of six months (mean test–retest interval of three months; final samples N = 27, N = 22, N = 18). At each session, participants performed the same emotional faces task. At first measurement the presentation of emotional faces resulted in heightened activation in bilateral amygdala, bilateral lateral PFC and visual areas including the fusiform face area. Average activation did not differ across test-sessions over time, indicating that at the group level activation patterns in this network do not vary significantly over time. However, using the Intraclass Correlation Coefficient (ICC), fMRI reliability demonstrated only fair reliability for PFC (ICC = 0.41–0.59) and poor reliability for the amygdala (ICC < 0.4). These findings suggest substantial variability of brain activity over time and may have implications for studies investigating the influence of treatment effects on changes in neural levels in adolescents with psychiatric disorders.
1. Introduction
Processing of emotional faces has consistently been associated with activation in the amygdala and prefrontal cortex (PFC). Therefore, both brain areas are considered part of the social information processing network and the overlapping face processing network (Scherf et al., 2012). These networks are known to be involved in the fast recognition of social stimuli (including faces), and the processing and the interpretation of social-affective stimuli (Adolphs et al., 2003). Interestingly, prior studies have shown stronger activation in the amygdala when seeing fearful compared to happy or neutral faces (see for an overview Costafreda et al., 2008), although increased activation for happy faces has been reported as well (Fusar-Poli et al., 2010, Somerville et al., 2004). In addition, studies have indicated that the PFC is more activated during explicit face processing compared to implicit face processing and that PFC is differentially activated depending on the context, such as whether the faces need to be rated or need to be passively viewed (Fusar-Poli et al., 2010, Monk et al., 2003, Monk, 2008).
Pronounced differences in amygdala and PFC activation have been found across adolescent development (Casey et al., 2011). This is not surprising, because adolescence is a developmental phase characterized by ongoing changes in gray and white matter across the brain (Giedd et al., 1999), which is also related to enhanced plasticity in cognitive and emotional functioning (Steinberg, 2005): intensification of emotions (Dahl, 2004) and developmental improvements in face processing (for a review, see Scherf et al., 2011). For example, when using an emotional go-nogo task with fearful and neutral faces, Hare et al. (2008) indicated that adolescents have exaggerated amygdala activation to fearful faces relative to children and adults. These findings are consistent with other studies reporting heightened amygdala responses to emotional faces in adolescence (Baird et al., 1999, Guyer et al., 2008, Monk et al., 2003, Pfeifer et al., 2011, Thomas et al., 2001). At present, most of these studies used cross sectional designs and therefore it is not yet known to what extent amygdala and PFC activation vary across time during adolescence. There are only a few studies that used longitudinal study designs to investigate the processing of emotions in adolescents (Moore et al., 2012, Pfeifer et al., 2011, Shaw et al., 2011, Shaw et al., 2012). For example, a study by Pfeifer et al. (2011) investigated the neuronal coupling between ventral striatum and amygdala over time. However, none of these studies investigated the test–retest reliability of specific activation patterns. It is important to investigate the stability of brain activation patterns because it is closely related to the investigation of ongoing changes in gray and white matter and plasticity of the brain during adolescence. When we have more knowledge about stability of brain activation patterns, studies investigating plasticity can take this knowledge into account when interpreting their results, especially in studies investigating intervention effects.
Functional neuroimaging techniques are being investigated because of their potential for quantifying longitudinal brain activation changes associated with disease or intervention effects (e.g. Maslowsky et al., 2010, McClure et al., 2007a, Strawn et al., 2012). In such repeated measures designs it is important to know whether brain activation patterns in healthy comparison subjects vary over time or not. When there is a lot of variation over time within healthy comparison subjects, this should be taken into account when performing longitudinal analyses in clinical samples investigating for example treatment effects. For this reason, test–retest reliability and reproducibility of fMRI over time are extensively studied in adults (for review, see Bennett and Miller, 2010). So far, it is known that reliability varies depending on scan-interval, task and experimental design, method to assess reliability and sample characteristics (e.g. healthy vs. illness, young vs. old). The majority of reliability studies have focused on motor and cognitive tasks, with only few studies examining face processing. For example, Plichta et al. (2012) used an emotional face-processing task in which participants had to match a target stimulus (i.e. emotional face or geometric shape) with one of two other stimuli (one corresponding to the target and the other being different). Their results indicated that amygdala activation showed good reliability on between-group level but poor reliability on within-subjects level (Intraclass Correlation Coefficient-values (ICC) values < 0.4). In a passive viewing face-processing task with neutral, happy and fearful facial expressions, poor to excellent ICC-values were reported depending on the contrast chosen (Johnstone et al., 2005). So far, none of these studies included adolescent participants, even though significant changes in emotional functioning occur during this stage of development. Therefore, the main goal of this study was to examine the variability of activation in the amygdala and PFC across multiple measurements in healthy mid-adolescents.
Previously, Monk et al. suggested that amygdala and PFC activation differs depending on the question that is posed prior to the presentation of the face. They demonstrated higher neural activation in several brain areas when adolescents had to rate emotions compared to when attending to a non-emotional feature of the face or during passive viewing (McClure et al., 2007b, Monk et al., 2003). However, how state questions influence the activation patterns of the amygdala and PFC is not yet well understood. By including state questions in the current paradigm, we were able to further investigate neural responses to emotional faces that are modulated by three different state questions and a passive viewing condition.
To test the questions posed in this experiment, we performed a longitudinal study in which healthy adolescents were scanned three times over a period of six months. During each scan session participants performed an adapted version of the face attention paradigm used in the studies of McClure et al. (2007b) and Monk et al. (2003). We investigated neural responses to emotional faces and whether there were interactions with context. Based on these previous studies, we expected increased activation in bilateral amygdala, PFC and visual cortex. Furthermore, we expected higher test–retest reliability for the visual cortex and prefrontal cortex than for the amygdala (Plichta et al., 2012).
2. Methods
2.1. Participants
In total, 31 healthy right-handed adolescents (aged 12–19) participated in the first measurement of the fMRI experiment. They took part in the larger EPISCA study (Emotional Pathways’ Imaging Study in Clinical Adolescents), a longitudinal MRI study in which adolescents (healthy comparison group and two clinical groups) were followed over a period of six months. Five of the 31 adolescents were excluded due to excessive head movement (>4 mm; N = 1), technical problems during scanning (N = 1), an anomalous finding reported by the radiologist (N = 1) or subclinical scores on some questionnaires (N = 1), leading to a final sample of 27 adolescents for the first measurement (mean age = 14.56, SD = 1.60, 24 female). The samples for the longitudinal test–retest analyses consisted of 22 adolescents (two measurements; mean age at Time Point 1 (TP1) = 14.45, SD = 1.37, 19 females) and 18 adolescents (three measurements; Mean Age at TP 1 = 14.33, SD = 1.37, 17 females). Estimated full scale IQ scores were acquired with the use of six subtests of either the Wechsler Intelligence scale for Children-III or the Wechsler Adult Intelligence Scale (Wechsler, 1991, Wechsler, 1997): picture completion, similarities, picture arrangement, arithmetic, block design and comprehension. All participants scored in the average range (TP1 (N = 27) Mean = 106, SD = 7.4; TP1 (N = 22) Mean = 107, SD = 7.3; TP1 (N = 18) Mean = 106, SD = 7.7). The sex distribution was unequal with a higher number of females than males.
Adolescents were recruited through local advertisement. They were included if they met the following criteria: right-handed, normal or corrected-to-normal vision, sufficient understanding of the Dutch language, no history of neurological or psychiatric impairments and no contraindications for MRI testing. Furthermore, both parents and the adolescents were assessed with a semi-structured diagnostic interview (ADIS-C/P, Silverman and Albano, 1996), and filled out several questionnaires (i.e., CBCL and YSR, Achenbach, 1991a, Achenbach, 1991b), to make sure that they did not have psychiatric problems. Informed consent was obtained by participants, and by parents and participants in case of minors. The adolescents received a financial compensation including travel expenses for participation. The study was approved by the medical ethics committee of the Leiden University Medical Center. All anatomical scans were reviewed and cleared by a radiologist.
2.2. Procedure
All adolescents included in the study were scanned three times: first measurement (TP1), second measurement approximately three months after TP1 (TP2; Mean (SD) = 3.3 months (0.43)) and third measurement, approximately six months after TP1 (TP3; Mean (SD) = 6.6 months (0.63). At each measurement all participants were tested individually and were trained to lie still in a mock scanner, which simulated the environment and sounds of an actual MRI scanner. In-between scanning, participants were asked to report subjective stress levels on a visual analogue scale (VAS) ranging from 0–100 (Mean (SD) reported stress level: TP1 (N = 27) = 17.7 (14.5) range: 0–58.3, TP1 (N = 18) = 18.7 (16.3) range: 0–58.3, TP2 (N = 18) = 10.2 (12.4) range: 0–43.3, TP3 (N = 18) = 6.9 (7.9) range: 0–22.3. There was a significant decline in subjective stress level between measurements (F(2,34) = 8.4, p = 0.005), but no significant differences between subsamples at TP1. Stimulus presentation and the timing of all stimuli and response events were acquired using E-Prime software. Head motion was restricted by a pillow and foam inserts that surrounded the head.
2.3. Task
We administered a well-known face-attention paradigm (McClure et al., 2007b, Monk et al., 2003) with a few adjustments: (1) angry faces were excluded (due to similar response of angry and sad in prior studies); (2) the state question ‘how happy are you?’ was included; (3) the number of response options was restricted from five to four; and (4) the number of trials was extended to get a good estimation of the BOLD response (Blood Oxygen Level Dependent). The adapted task consisted of three constrained conditions (state questions: how afraid are you?; how happy are you?; how wide is the nose?) and an unconstrained state condition (passive viewing). States were rated for all faces on a four-point rating scale: (1) ‘Not at all’, (2) ‘A little’, (3) ‘Quite’ and (4) ‘Very’. During the task, reaction times and subjective scoring of the different emotional faces were recorded for behavioral analyses.
The faces with emotional expressions were drawn from two widely used sets of standardized faces (Karolinska (Lundqvist et al., 1998) and NimStim faces (Tottenham et al., 2009)) and were selected to resemble the Dutch population (equal amount of males/females and ethnic diversity). In total, 42 actors were selected who expressed fourteen fearful, fourteen happy and fourteen neutral faces. We are aware of the ongoing debate whether “neutral” faces exist, or whether “ambiguous” faces should be used (e.g. Tahmasebi et al., 2012), but for consistency we use the term ‘neutral’ faces.
Trials had the following structure: participants were presented with a state question for 4000 milliseconds, followed by a centrally located cue with a jittered interval between 500 and 6000 milliseconds, after which one of the pictures was shown for 3000 milliseconds followed by a centrally located cue with a jittered interval between 500 and 6000 milliseconds (Fig. 1). During picture presentation, participants had to rate the picture by pressing one of four buttons. In case they did not respond within 3000 milliseconds, nothing happened and the next trial was presented. Missing trials (1.98% in total) were not included in the analyses. In total there were three runs consisting of four blocks, with each block representing one state. Each state was followed by 21 faces, with seven faces for each emotion (fearful, happy and neutral). The states were presented randomly and the pictures of faces with emotional expressions within a state were pseudo-randomly presented. In total there were 84 trials per run (four states × 21 faces), 63 trials per state (three runs × 21 faces), 84 trials per emotion (three runs × four states × 7 faces per emotion), 21 trials per condition (one of the state questions × one of the emotions) and 252 trials in total.
Fig. 1.

Display of task design. Subjects were presented with one of four states, followed by a centrally located cue, after which one of the emotional faces was shown. Subjects were asked to rate each emotional face on a four-point rating scale ranging from ‘not at all’ to ‘very’, based on the presented state. During scanning reaction times and subjective scoring were registered.
2.4. Image acquisition
Data were acquired using a 3.0T Philips Achieva (Philips, Best, The Netherlands) scanner at the Leiden University Medical Center. Stimuli were presented onto a screen located at the head of the scanner bore and viewed by participants by means of a mirror mounted to the head coil assembly. First a localizer was obtained for each participant. Subsequently, T2*-weighted Echo-Planar Images (EPI) (TR = 2.2 s. TE = 30 ms, 80 × 80 matrix, FOV = 220, 38 slices of thickness 2.75 mm) were obtained during three functional runs of 192 volumes each. Each run had two additional scans at the start, which were discarded to allow for equilibration of T1 saturation effects. Also, a sagittal 3-dimensional gradient-echo T1-weighted image was acquired with the following scan parameters: repetition time 9 ms; echo time 3.5 ms; flip angle 80°; 170 sagittal slices; no slice gap; field of view 256 mm × 256 mm; 1 mm isotropic voxels.
2.5. fMRI analyses
The collected data were analyzed using SPM5 (Wellcome Department of Cognitive Neurology, London). The functional time series were realigned to compensate for small head movements and differences in slice timing acquisition. Functional volumes were spatially normalized to the EPI template. The normalization algorithm used a 12-parameter affine transformation together with a nonlinear transformation involving cosine basis functions and resampled the volumes to three mm. cubic voxels. Functional volumes were spatially smoothed with an 8 mm, full-width at half-maximum isotropic Gaussian kernel. The MNI (Montreal Neurological Institute) 305 stereotaxic space templates (Cocosco et al., 1997) were used for visualization and all results are reported in this template, which is an approximation of Talairach space (Talairach and Tournoux, 1988).
Individual subjects’ data were analyzed using the general linear model in SPM5. The fMRI time series were modeled by a series of events convolved with a canonical hemodynamic response function (HRF). The state questions were modeled separately as 4 s events and were added as covariates of no interest. The picture presentation of each emotional face was modeled as a zero duration event. In the model, the picture presentation was further divided in twelve separate function trials (four state questions by three expressed emotions). The modeled events were used as a covariate in a general linear model along with a basic set of cosine functions that high-pass filtered the data. The least squares parameter estimates of the height of the best-fitting canonical HRF for each condition were used in pair wise contrasts (i.e. all faces vs. fixation, fearful faces vs. fixation, happy faces vs. fixation and neutral faces vs. fixation). The resulting contrast images, computed on a subject-by-subject basis, were submitted to group analyses. At the group level, contrasts between conditions were computed by performing one-tailed t-tests on these images, treating subjects as a random effect. Task-related responses were considered significant if they consisted of at least 10 contiguous voxels at a corrected threshold of p < 0.05 (FDR corrected). Furthermore, we performed voxelwise ANOVAs to identify regions that showed time-related differences in relation to the picture presentation.
We used the Marsbar toolbox for use with SPM5 (http://marsbar.sourceforge.net/; Brett et al., 2002) to perform region of interest (ROI) analyses to further investigate patterns of activation. ROIs were defined based on a priori hypothesis and regions that were identified in the functional mask of the whole-brain analyses (all faces vs. fixation and happy faces vs. fixation; FDR corrected, p < 0.05, at least 10 contiguous voxels). ROIs used for the longitudinal analyses were based on the full baseline sample, i.e. N = 27. ROIs that spanned several functional brain regions were subdivided by sequentially masking the functional ROI with each of several anatomical MarsBaR ROIs.
To analyze the reliability of behavioral data and brain activation we calculated IntraClass Correlation Coefficients (ICCs). For the behavioral data (reaction times, subjective scoring and reported stress-level) we used stability analyses in SPSS (ICC(3,3)). We calculated the ICC value for different conditions and different time point comparisons. Furthermore, we calculated measures of intra-voxel reliability on individual contrast values for each ROI by using the ICC toolbox provided by (Caceres et al., 2009). For this analysis, the same ROIs were used as for the functional analyses, i.e. based on the full baseline sample of N = 27. Furthermore, we added bilateral inferior occipital regions to control for method validity, as these regions are associated with face processing (Plichta et al., 2012) and had substantial overlap with the functional ROIs derived from the all vs. fixation contrast (overlap: left 56%, right: 88%). By analyzing only ROIs based on the first measurement we could test whether the level of group activation of the first session could predict the consistency of activation within participants. Previous studies proposed different criteria regarding reliability criteria for fMRI studies. We followed the guidelines proposed by Cicchetti for qualifying reliability: poor (<0.4), fair (0.41–0.59), good (0.60–0.74) or excellent (>0.75) (Cicchetti and Sparrow, 1981, Cicchetti, 2001). These proposed criteria parallel suggested acceptance levels of the neuroimaging community of critical ICC-values of 0.4 (Eaton et al., 2008, Aron et al., 2006).
3. Results
3.1. Behavioral data
Fig. 2 shows the rating- and reaction time patterns for the full baseline sample (N = 27). The results at TP1 were similar for those participants who took part in two (N = 22) or three (N = 18) follow-up measurements. For both subsets, there were no main effects for time.
Fig. 2.

Mean reaction times and subjective scores for the different states and emotions (N = 27 at TP1).
3.1.1. Subjective rating of emotional faces
Time (3 levels) and emotion (3 levels) were added to the analysis as within-subject variables. The scores were analyzed separately for each state question, because values of the scores represent different interpretations for each state. In case sphericity was not assumed, Greenhouse–Geisser correction (GG-corr.) was applied.
The repeated measure ANOVAs resulted in main effects for emotion in all three states. In the ‘how afraid are you?’ state the main effect of emotion (F(2,52) = 13.27, p < 0.001) resulted in higher subjective scores for fearful and neutral faces than for happy faces (both p's < 0.005). For ‘how happy are you?’ the main effect of emotion (F(2,52) = 35.87, p < 0.001, GG-corr.) resulted in higher scores for happy faces than for both other faces (both p's < 0.001). Finally, in the state ‘How wide is the nose?’ state the main effect of emotion (F(2,52) = 174.13, p < 0.001) resulted in scores that were highest for happy faces and lowest for neutral faces (all p's < 0.001).
3.1.2. Reaction times
For reaction time, one repeated measure ANOVA was performed with a three (state) by three (emotion) design. The results showed a main effect for state (F(2,52) = 5.04, p < 0.05), a main effect for emotion (F(2,52) = 4.49, p < 0.05) and an interaction effect of state by emotion (F(4,104) = 4.44, p < 0.05). Reaction times were longer for the ‘how happy are you?’ state compared to the ‘how afraid are you?’ state (p < 0.01) and when viewing fearful faces compared to happy faces (p < 0.05).
Separate comparisons for each state resulted in a main effect of emotion (F(2,52) = 9.32, p < 0.001) for the ‘how afraid are you?’ state, with longer reaction times for fearful (p < 0.005) and neutral (p < 0.05) faces than for happy faces. For the other two states (‘how happy are you?’ and ‘how wide is the nose?’), no significant differences were found. Separate comparisons for each emotion resulted in a main effect for state (F(2,52) = 11.70, p < 0.001) for the happy faces, with longer reaction times for happy faces in the ‘how happy are you?’ (p < 0.005) and ‘how wide is the nose?’ (p < 0.005) states than in the ‘how afraid are you?’ state. For the separate comparison of neutral faces there was a main effect of state ((F(2,52) = 3.95, p < 0.05), but none of the emotions differed from each other when further testing the main effect. For the fearful faces, no significant differences between states in reaction times were found.
For the subsets of N = 22 (TP1–TP2) and N = 18 (TP1–TP3) the analyses of subjective scores and reaction times showed similar results at TP1 and there were no significant main or interaction effects for time, indicating that these patterns were consistent over time and across state questions.
3.1.3. Test–retest reliability of behavioral data
To investigate the test–retest reliability of the behavioral data, we performed reliability analyses with the use of SPSS (ICC(3,3)). We examined the different state questions, the emotional faces that were presented and the reported stress-levels. The results showed good ICC values for the subjective scoring of fearful faces for TP1–TP3 (ICC = 0.62). All other comparisons for both the reaction times and the subjective scoring resulted in excellent ICC values (ranging from 0.76 to 0.96). Furthermore, the ICC values for the VAS-scores were poor for TP1–TP3 (ICC = 0.35), fair TP1–TP2 (ICC = 0.52) and TP1–TP2–TP3 (ICC = 0.69), but excellent for TP2–TP3 (ICC = 0.89).
3.2. fMRI analyses
The fMRI results are organized in three sections. First, neural responses to emotional faces and state questions were investigated in the sample of 27 adolescents who participated in the cross-sectional part. Second, the effect of repeated task assessments was investigated for 22 adolescents who participated in two sessions and 18 adolescents who took part in three sessions with the use of ROI analyses. Third, the test–retest reliability was tested using ICCs.
3.2.1. First measurement cross-sectional analyses: effects of emotions and state questions
The neural responses to emotions were assessed by whole brain analyses in 27 adolescents. For this purpose, we ran four contrasts on the whole-brain level to extract ROIs for specific state question analyses (FDR corrected, p < 0.05, at least 10 contiguous voxels). The first contrast, all emotional faces > fixation, resulted in expected bilateral activation in the amygdala and bilateral activation in the lateral PFC (Fig. 3a). The second contrast, fearful faces > fixation resulted in activation in bilateral amygdala and bilateral lateral PFC (Fig. 3b). The third contrast, happy faces > fixation resulted in activation in bilateral amygdala and medial prefrontal cortex (Fig. 3c). The final contrast, neutral faces > fixation, resulted only in bilateral lateral PFC activation (Fig. 3d). Supplementary Table 1 lists the MNI coordinates for peak values of each activated region.
Fig. 3.
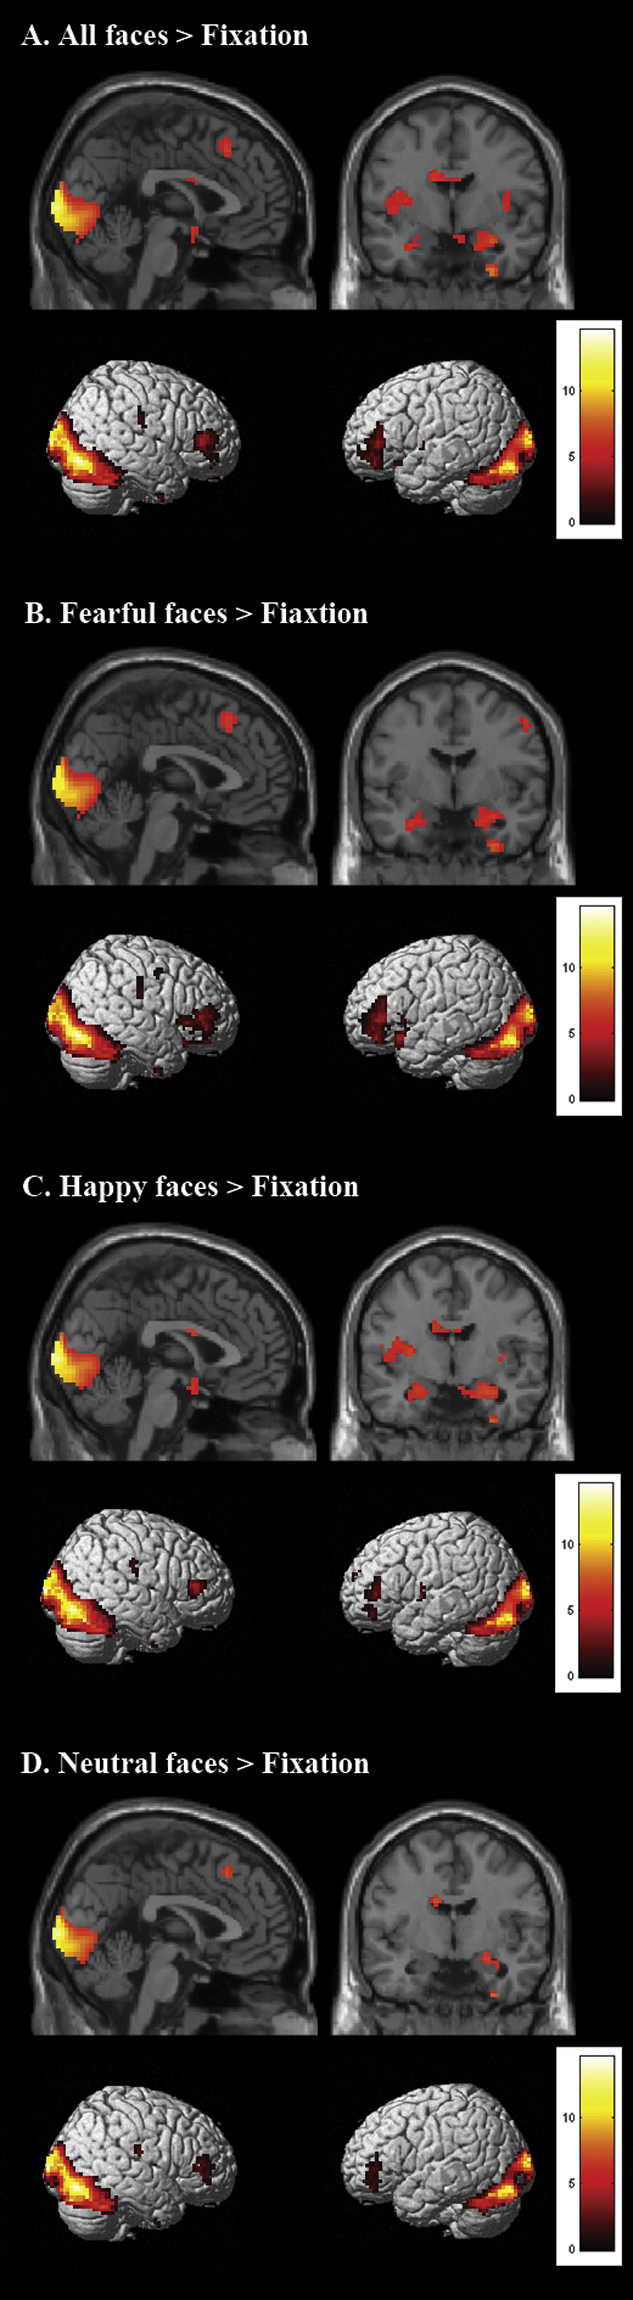
Stimulus-onset-locked whole brain contrast for N = 27 at TP 1 showing effects of A. all faces > fixation, B. all fearful faces > fixation, C. all happy faces > fixation and D. all neutral faces > fixation (FDR corrected, p < 0.05; 10 contiguous voxels).
Next, three areas (amygdala, lateral PFC and medial PFC) were further explored in ROI analyses. Here we focus on left-lateralized areas due to space limitations. The ROI results of right-lateralized areas were highly comparable concerning main effects for emotion and state. All ROIs were defined based on task activation in the whole brain functional mask.
The ROI for masked left amygdala (based on all faces > fixation) resulted in a main effect of emotion (F(2,52) = 3.20, p < 0.05). Post hoc comparisons showed that the amygdala responses were larger for happy than for neutral faces (p = 0.05), whereas fearful faces did not differ significantly from either happy or neutral faces. No main or interaction effects were found for the different states.
A main effect for emotion was found for left lateral PFC (based on all faces > fixation; F(2,52) = 6.11, p < 0.005). As expected, left lateral PFC was more active in response to fearful faces compared to both neutral and happy faces (both p's < 0.005). As depicted in Fig. 4, left lateral PFC also showed a main effect of state (F(3,78) = 6.65, p < 0.001). Post hoc comparisons revealed that left lateral PFC was less active following the question ‘passive viewing’ compared to ‘how happy are you?’ and ‘how wide is the nose?’ (p < 0.001 and p < 0.05 resp.).
Fig. 4.

Parameter estimates for three ROIs: left amygdala (masked; based on all faces > fixation), left lateral PFC (based on all faces > fixation) and medial PFC (based on all happy faces > fixation). Results are presented separately for the states and emotion (FDR corrected, p < 0.05; 10 contiguous voxels) and correspond to the sample of N = 27 at TP1.
Finally, a state effect was found in medial prefrontal cortex (based on happy faces > fixation; F(3,78) = 4.82, p < 0.01) showing that there was more activation following the question ‘how afraid are you?’ compared to ‘passive viewing’ (p < 0.05). Furthermore, there was more activation after the question ‘how happy are you’ compared to the question ‘how wide is the nose?’ (p < 0.05).
Taken together, prefrontal cortex (lateral and medial) was responsive to the state question, irrespective of emotional content, suggesting that this area is more sensitive to the specific context of the experiment than the amygdala.
3.2.2. Longitudinal analyses: testing for effects of time
All analyses reported above were repeated with the subsamples of 22 participants who took part in two measurements and of 18 participants who participated in all three measurements. As results were similar for both groups, we report the results of participants included in all three measurements.
We performed a whole brain repeated measures ANOVA (full factorial design) with time as an additional factor (i.e. testing for interactions between emotion, state and time). These analyses resulted in a highly comparable set of activation compared to TP1. Again, the contrast all emotions > fixation resulted in activation in bilateral amygdala and bilateral PFC (Fig. 5a). The contrast fearful faces > fixation resulted in activation in bilateral PFC (Fig. 5b) and the contrast happy faces > fixation resulted in bilateral amygdala and bilateral PFC activation (Fig. 5c). Finally, the contrast neutral faces > fixation resulted in bilateral PFC and right amygdala activation (Fig. 5d). The effects confirm the findings from the ROI analysis in the first measurement, which showed that the amygdala is more responsive to happy faces. Supplementary Table 2 lists the MNI coordinates for peak values of each activated region.
Fig. 5.
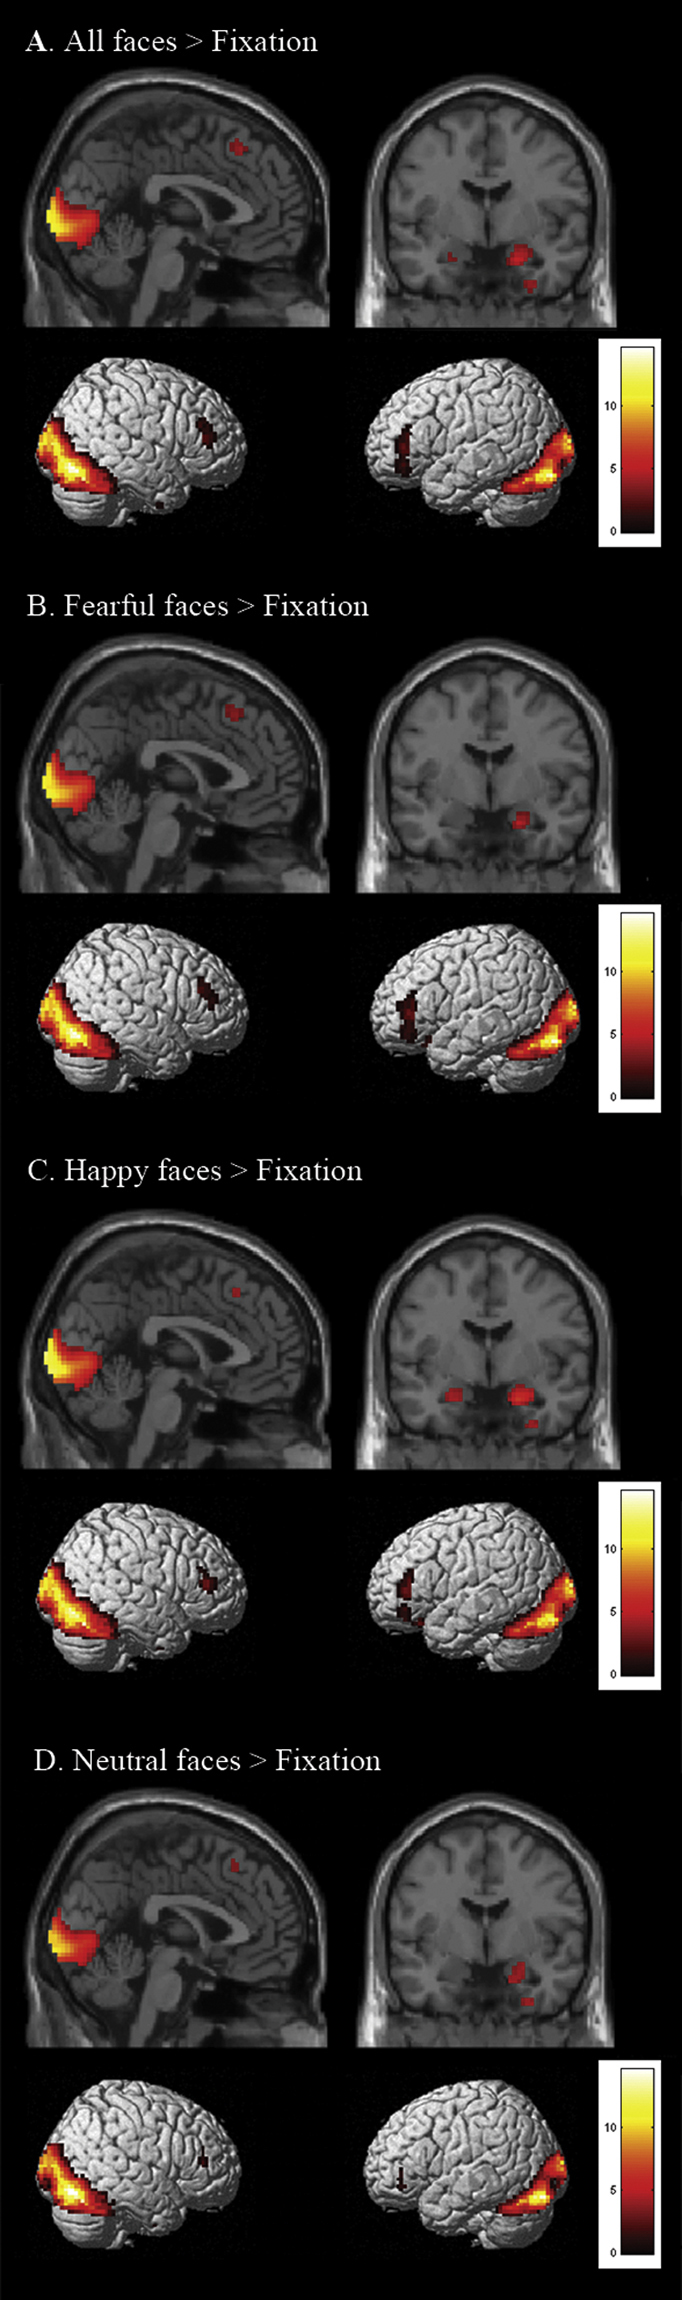
Stimulus-onset-locked whole brain contrast for N = 18 at TP 1/TP2/TP3 showing effects of A. all faces > fixation, B. all fearful faces > fixation, C. all happy faces > fixation and D. all neutral faces > fixation (FDR corrected, p < 0.05; 10 contiguous voxels). Results derive from a repeated measurement analysis in which time was taken as an additional factor.
To investigate the effect of time we performed four repeated measures ANOVA using the flexible factorial design (one for each contrast). In the analysis we included ‘subjects’ (independency = yes, variance = equal) and ‘time’ (independency = no, variance = equal) as factors. None of the analyses showed a main effect for time. The absence of this effect may suggest that, on group-level, the activations in these areas do not significantly vary over time. This was further tested using two approaches: (1) ROI analyses testing for time effects, because ROIs can have possibly more power for detecting small changes, and (2) test–retest reliability to test for stability within individuals.
3.3. ROI analyses testing for effects of time
As depicted in Fig. 6, the time (3 levels) by state (4 levels) by emotion (3 levels) ANOVA for left amygdala resulted in a main effect of emotion (all faces > fixation; F(2,34) = 3.89, p < 0.05), but no interaction effect with time. Post hoc comparisons showed more activation for happy faces compared to neutral faces (p < 0.05). There was no difference in activation between fearful and happy faces and there was no main effect for state or time.
Fig. 6.

Parameter estimates for three ROIs: left amygdala (masked; based on all faces > fixation), left lateral PFC (based on all faces > fixation) and medial PFC (based on all happy faces > fixation). Results are presented separately for the states and emotion (FDR corrected, p < 0.05; 10 contiguous voxels) and correspond to the sample of N = 18 at TP1/TP2/TP3.
The time (3 levels) by state (4 levels) by emotion (3 levels) ANOVA for left lateral PFC resulted in a main effect for state (F(3,51) = 7.58, p < 0.001) and a main effect of emotion (F(2,34) = 5.09, p < 0.05), but no interaction effect with time. Specific post hoc comparisons for the main effect of state revealed that there was more activation in the condition ‘How happy are you?’ compared to the ‘Passive viewing’ and ‘How afraid are you?’ conditions (both p's < 05). Also, there was more activation in the condition ‘how wide is the nose?’ compared to ‘how afraid are you?’ (p < 0.05). Furthermore, the post hoc comparisons for the main effect of emotion showed more activation for fearful faces than for neutral faces (p < 0.05).
The time (3 levels) by state (4 levels) by emotion (3 levels) ANOVA for medial PFC resulted in a main effect for emotion, F(2,34) = 3.31, p = 0.05. Post hoc comparisons for this effect revealed more activation after happy faces compared to fearful faces (p = 0.05). No effects for state and/or time were found.
3.3.1. Test–retest reliability
Intra-voxel reliability (ICC) measures were based on ROIs at TP1 for the full baseline sample of adolescents (N = 27; FDR corrected, p < 0.05, 10 contiguous voxels). Beside the functional ROI definition, anatomical and masked ROI were also defined and the results of these were highly comparable to the results of the functional ROIs (see Supplementary Table 3). Intra-voxel reliabilities were calculated for each contrast of interest and for each time period, resulting in ICCs for adolescents N = 22 for TP1-TP2; and adolescents N = 18 for TP1–TP2, TP2–TP3 and TP1–TP3. Table 1 list the ICCs for the contrast all emotions > fixation for each Time point. ICC-values for the other contrasts can be found in Supplementary Table 3a–c. Fig. 7 displays ICC-values with SE bands for the TP1-TP2 (N = 18) sample. ICCs were computed for each participant and the population estimate was based on bootstrap methods. Overall, ICC-values were poor for the amygdala and right lateral PFC (<0.4), irrespective of Time Point and type of ROI (i.e. functional, masked or anatomical). Left lateral PFC demonstrated fair ICC-values [0.4–0.6] predominantly in the “all emotions” and “happy faces” > fixation contrast, while values varied between poor to fair in the other contrasts. The two “control” regions, i.e. bilateral inferior occipital cortices, showed excellent ICC-values for all, except one, contrasts and Time Points. Furthermore, the ICC-values for the different Time Point comparisons (TP1–TP2, TP1–TP3 and TP2–TP3) were similar, suggesting that the ICC-values were not influenced by the different scan interval.
Table 1.
Reliability measurements of ROIs for all emotions vs. fixation.
| All-fix | TP1–TP2 | TP1–TP2 | TP2-TP3 | TP1–TP3 |
|---|---|---|---|---|
| N22 | N18 | N18 | N18 | |
| ROI | medICC (SE) | medICC (SE) | medICC (SE) | medICC (SE) |
| L amygdala anat | 0.07 (0.11) | 0.10 (0.14) | 0.28 (0.05) | 0.21 (0.08) |
| L amygdala | 0.12 (0.12) | 0.14 (0.13) | 0.09 (0.12) | 0.12 (0.07) |
| L amygdala masked | 0.01 (0.20) | 0.06 (0.23) | -0.02 (0.10) | 0.10 (0.11) |
| R amygdala anat | 0.15 (0.10) | 0.15 (0.10) | 0.34 (0.14) | 0.34 (0.09) |
| R amygdala | 0.01 (0.14) | 0.11 (0.18) | 0.17 (0.10) | 0.19 (0.07) |
| R amygdala masked | 0.13 (0.14) | 0.15 (0.15) | 0.32 (0.14) | 0.35 (0.12) |
| L LPFC | 0.50 (0.12) | 0.48 (0.13) | 0.44 (0.07) | 0.41 (0.08) |
| L LPFC InfTri masked | 0.50 (0.12) | 0.45 (0.14) | 0.56 (0.10) | 0.36 (0.15) |
| R LPFC | 0.35 (0.09) | 0.32 (0.09) | 0.31 (0.12) | 0.28 (0.07) |
| R LPFC InfTri masked | 0.36 (0.10) | 0.35 (0.11) | 0.34 (0.12) | 0.28 (0.11) |
| MedPFC | 0.23 (0.14) | 0.30 (0.12) | 0.17 (0.10) | 0.31 (0.19) |
| L occipital Inf | 0.84 (0.04) | 0.81 (0.05) | 0.86 (0.05) | 0.85 (0.03) |
| R occipital Inf | 0.89 (0.03) | 0.89 (0.03) | 0.90 (0.04) | 0.91 (0.03) |
Intraclss correlation coefficient values per ROI within the contrast all faces > fixation. ROIs are based in the full sample of N = 27 subject at TP1 (FDR corrected, p < 0.05; 10 contiguous voxels). Interpretation of ICC-values: poor (<0.4), fair (0.41–0.59), good (0.60–0.74) or excellent (>0.75). Abbreviations: fix; fixation; TP; time point; medICC; median intraclass correlation coefficient; SE; standard error; ROI; region of interest; L; left; anat; anatomical ROI derived from Marsbar AAL regions; R; right; LPFC; lateral prefrontal cortex; InfTri; inferior triangularis; MedPFC; medial prefrontal cortex; Inf; inferior.
Fig. 7.

Intraclass Correlation Coefficients (ICC) based on ROIs at TP1 for 27 subjects (FDR corrected, p < 0.05; 10 contiguous voxels). The bars represent ICC-values for the ROIs within the contrast all faces > fixation for TP1 and TP2.
4. Discussion
The key questions in this study were whether and to what extent activation the amygdala and prefrontal cortex varies over time in adolescents during emotional face processing. Overall the task successfully activated brain regions in the emotional face processing network (e.g. bilateral amygdala, bilateral lateral PFC and visual cortex). Furthermore, on the group level there was no significant variation in activation patterns over time suggesting that activation during an emotional face processing task is relatively stable. However, analyses investigating test–retest reliability on intra-subject level indicated only fair reliability of PFC areas and poor reliability of bilateral amygdala. This indicates that, on the individual level, there is variability in activation patterns for the specific brain areas (i.e. bilateral amygdala, bilateral lateral PFC) over time.
The results showed that the amygdala was activated during the presentation of both happy and fearful faces, with a slightly stronger response to happy faces. These findings are consistent with the hypothesis that the amygdala is not solely a fear processing node but more a general emotion-processing node (Cunningham et al., 2008, Whalen, 1998). The relatively higher response to happy faces than to fearful faces may be specific for mid-adolescence (Somerville et al., 2011), a period during which there is an imbalance between the subcortical driven emotional and frontal-cortical driven control areas of the brain, that may influence the intensity or extent of the amygdala response during emotional face processing (Dahl, 2004). However, this hypothesis should be tested in more detail in future research.
The medial and lateral PFC showed dissociable responses to emotional faces and the different (un)constrained conditions. That is to say, the medial PFC was only more active when viewing happy faces, and lateral PFC was more active during the presentation of all three emotions, although it was relatively more responsive to fearful faces than to happy and neutral faces. Furthermore, both PFC areas showed effects related to the different conditions and context. Thus, in adolescence the amygdala seems to be an area related to emotion processing in general, while PFC shows more specific activation patterns depending on context and type of emotion.
The sensitivity of PFC areas to the different state questions be explained by participants not having to indicate their subjective feeling in the passive viewing condition. In other words, participants did not have to actively select a choice alternative or regulate their emotion when viewing faces in this context. Only a few studies directly compared active and passive state questions in combination with different emotions in the same design. For example, a study by Monk et al. (2003) used a similar task and they demonstrated that brain activation patterns in adults seem to depend mostly on attention states, while adolescents were more responsive to the expressed emotion. Furthermore, the authors found that in adolescents, amygdala activation when viewing fearful faces was strongest during passive viewing. This may suggest that the activation pattern in the amygdala is modulated by the context during which adolescents view emotional faces. No such context effect was found in the present study, but future studies should examine the relation between states and emotions in more detail.
Next, we asked the question how stable these patterns were over time. In the behavioral analyses, there were no effects of time suggesting that participant's reaction time patterns and subjective scoring of emotional faces were stable over a period of six months. This finding was confirmed by the ICC analyses on the reaction times and subjective scoring that showed excellent values for almost all conditions. Furthermore, it is interesting to see that the ICC values of the stress-level rating showed an inconsistent pattern: the ICC values for the comparison TP1–TP2 and TP1–TP3 were very low while the comparison TP2–TP3 resulted in an excellent ICC-value. This finding can be explained by the scanner stress that participants probably experience during the first measurement but not during the second and third measurement. The whole brain longitudinal analyses indicated similar recruitment of the face processing network during a period of six months, a finding that was further confirmed by ROI analyses. However, the results of the ICC analyses showed that these findings could not be generalized to individuals. That is to say, ICC-values of the inferior occipital cortex were excellent, but ICC-values for the bilateral lateral PFC and bilateral amygdala were respectively fair and poor indicating large variability in activation patterns over time. These results correspond to the findings of Plichta et al. (2012) who also found low ICC-values for amygdala activation over time during an emotional face-processing task (face matching) in adults (mean scan interval was 14.6 days). Possibly, amygdala activation fluctuates in general in both adults and adolescents. On the individual level, this would not correspond with the results of earlier studies (Monk et al., 2003) that indicated that amygdala activation is mainly influenced by the context in which adolescents view emotional faces. However, these kinds of studies used group-level analyses, for which we found stable activation. Apparently, when using group-level analyses the within subject variation is cancelled out between subjects which in turn results in stable activation patterns, i.e. when subject one scores high on a variable and subject two scores low, than the average is still in the middle. Contrary, in the ICC analyses the within-subject variation is taken into account leading to more specific analyses and sometimes less stable results.
Another explanation for the large variability in amygdala activation can be related to habituation effects of amygdala response. However, a study by Johnstone et al. (2005) suggested that the habituation effect only lasts for approximately two weeks and that habituation resets with longer time periods. In their study fifteen adults were scanned three times (0, 2 and 8 weeks) and performed a passive face viewing task. The results of this study indicated that for neutral faces there was a habituation effect after two weeks, i.e. participants showed less activation in the left amygdala. However, this effect was diminished at the 8-week scan session. These findings make it unlikely that habituation effects influenced the current findings, because the test interval of approximately three months is larger compared to prior studies.
Finally, it may be possible that the low test–retest reliability is explained by the fact that we only included healthy participants that did not show a large amount of variability. Future studies should perform comparable analyses including healthy and clinical participants like adolescents with anxiety and/or depression.
There are some limitations in the current study that should be mentioned. First, the subsamples of N = 22 and N = 18 for the longitudinal analyses were relatively small. Nevertheless, the results we found correspond to the existing literature on face processing in adults and adolescents and also the result of large variability over time in the amygdala is supported by prior literature (Plichta et al., 2012). A second limitation was the relatively broad age-range (12–19 years). Earlier studies suggested that developmental differences in brain activation linked to emotional face processing occur in this developmental phase (Casey et al., 2011, Dahl, 2004, Scherf et al., 2011). In the current study we did not find any age effects, similar to other studies with adolescent groups of a similar age range (Hare et al., 2008, Somerville et al., 2011, Williams et al., 2006). Yet, future studies should replicate these findings and should further investigate the possible influence of puberty on brain activation patterns related to emotional face processing. Finally, this study included more females than males (24 vs. 3) due to the larger EPISCA study design in which also two clinic groups are included that mainly consist of females. Due to the very small number of boys in the current study it is not expected that the results are influenced by the imbalance in sex. Furthermore, the current sample size of male participants is too small to make any firm conclusions about the influence of sex on the results reported. It would have been very interesting to investigate the influence of menstrual cycle on amygdala activation patterns, due to the large proportion of females included in this study. Previous research by Derntl et al. (2008) indicated that amygdala activation patterns during emotional face processing are influenced by the level of progesterone, which relates to the menstrual phase females are in. Unfortunately, we did not collect the necessary information to perform these analyses. Future studies should investigate this relation in light of our current findings.
Knowledge about variability over time of amygdala and PFC activation in relation to emotional face processing has important implications for clinical conditions, such as anxiety and depression. These conditions are associated with heightened amygdala activation when viewing fearful faces, and especially amygdala activation during emotional face processing is often seen as an important characteristic of anxiety disorders (McClure et al., 2007a). A study by McClure et al. (2007a) used between-group level analyses to indicate whether there were differences across measurements. They investigated whether there were fMRI predictors of treatment outcome in a sample of children/adolescents who were predominantly diagnosed with generalized anxiety disorder. The results of their study indicated that participants who responded better to treatment (medication or cognitive behavior therapy) had more left amygdala activation before treatment. These findings are obviously highly relevant as to understand treatment effects at a group level. Future studies should examine whether these patterns are also found for individual analyses.
Taken together, the current study showed that longitudinal analyses can reveal to what extent neural activation is variable over time in healthy adolescents. Specifically, findings on a group level do not necessarily extend to the individual level. In future research, it will be important to investigate test–retest reliability in clinical samples and to compare these results with the results found in our study. Such studies will set the stage to examine the influence of treatment effects on changes in behavioral and neural levels.
Conflict of interest
There is no known conflict of interest.
Acknowledgments
Adolescents and their parents involved in the EPISCA study are gratefully acknowledged, as well as all the colleagues from the participating centers involved: GGZ Rivierduinen department of Child and Adolescent Psychiatry, Child and Adolescent Trauma Center Haarlem, departments of Psychiatry and Radiology of the LUMC, departments of Psychology and Child and Family studies of the University of Leiden, and the Leiden Institute for Brain and Cognition. The authors also gratefully acknowledge the financial supports given by the participating centers: LUMC vrije beleidsruimte, WOP (Rivierduinen) and Hersenstichting. Furthermore, S.A. Rombouts and E. A. Crone are supported by a grant of the Netherlands Organization for Scientific Research (NWO vidi grant nr. 917 863 68).
Footnotes
Supplementary data associated with this article can be found, in the online version, at http://dx.doi.org/10.1016/j.dcn.2012.09.005.
Contributor Information
Bianca G. van den Bulk, Email: b.g.van_den_bulk@curium.nl.
P. Cédric M.P. Koolschijn, Email: koolschijnpcmp@gmail.com.
Paul H.F. Meens, Email: p.h.f.meens@curium.nl.
Natasja D.J. van Lang, Email: n.d.j.van_lang@curium.nl.
Nic J.A. van der Wee, Email: n.j.a.van_der_wee@lumc.nl.
Serge A.R.B. Rombouts, Email: s.a.r.b.rombouts@lumc.nl.
Robert R.J.M. Vermeiren, Email: r.r.j.m.vermeiren@curium.nl.
Eveline A. Crone, Email: ecrone@fsw.leidenuniv.nl.
Appendix A. Supplementary data
The following are the Supplementary data to this article:
References
- Achenbach T.M. University of Vermont, Department of Psychiatry; Burlington: 1991. Manual for the Child Behavior Checklist/4-18 and 1991 Profile. [Google Scholar]
- Achenbach T.M. University of Vermont, Department of Psychiatry; Burlington: 1991. Integrative guide for the 1991 CBCU4-18, YSR and TRF Profiles. [Google Scholar]
- Adolphs R., Tranel D., Damasio A.R. Dissociable neural systems for recognizing emotions. Brain and Cognition. 2003;52(1):61–69. doi: 10.1016/s0278-2626(03)00009-5. [DOI] [PubMed] [Google Scholar]
- Aron A.R., Gluck M.A., Poldrack R.A. Long-term test–retest reliability of functional MRI in a classification learning task. Neuroimage. 2006;29(3):1000–1006. doi: 10.1016/j.neuroimage.2005.08.010. [DOI] [PMC free article] [PubMed] [Google Scholar]
- Baird A.A., Gruber S.A., Fein D.A., Maas L.C., Steingard R.J., Renshaw P.F., Cohen B.M., Yurgelun-Todd D.A. Functional magnetic resonance imaging of facial affect recognition in children and adolescents. Journal of the American Academy of Child and Adolescent Psychiatry. 1999;38(2):195–199. doi: 10.1097/00004583-199902000-00019. [DOI] [PubMed] [Google Scholar]
- Bennett C.M., Miller M.B. How reliable are the results from functional magnetic resonance imaging? Year in Cognitive Neuroscience 2010. 2010;1191:133–155. doi: 10.1111/j.1749-6632.2010.05446.x. [DOI] [PubMed] [Google Scholar]
- Brett M., Johnsrude I.S., Owen A.M. The problem of functional localization in the human brain. Nature Reviews Neuroscience. 2002;3(3):243–249. doi: 10.1038/nrn756. [DOI] [PubMed] [Google Scholar]
- Caceres A., Hall D.L., Zelaya F.O., Williams S.C., Mehta M.A. Measuring fMRI reliability with the intra-class correlation coefficient. Neuroimage. 2009;45(3):758–768. doi: 10.1016/j.neuroimage.2008.12.035. [DOI] [PubMed] [Google Scholar]
- Casey B., Jones R.M., Somerville L.H. Braking and accelerating of the adolescent brain. Journal of Research on Adolescence. 2011;21(1):21–33. doi: 10.1111/j.1532-7795.2010.00712.x. [DOI] [PMC free article] [PubMed] [Google Scholar]
- Cicchetti D.V. The precision of reliability and validity estimates re-visited: distinguishing between clinical and statistical significance of sample size requirements. Journal of Clinical and Experimental Neuropsychology. 2001;23(5):695–700. doi: 10.1076/jcen.23.5.695.1249. [DOI] [PubMed] [Google Scholar]
- Cicchetti D.V., Sparrow S.A. Developing criteria for establishing interrater reliability of specific items: applications to assessment of adaptive behavior. American Journal of Mental Deficiency. 1981;86(2):127–137. [PubMed] [Google Scholar]
- Cocosco C.A., Kollokian V., Kwan R.K.S., Evans A.C. BrainWeb: online interface to a 3D MRI simulated brain database. Neuroimage. 1997;5:s425. [Google Scholar]
- Costafreda S.G., Brammer M.J., David A.S., Fu C.H. Predictors of amygdala activation during the processing of emotional stimuli: a meta-analysis of 385 PET and fMRI studies. Brain Research Reviews. 2008;58(1):57–70. doi: 10.1016/j.brainresrev.2007.10.012. [DOI] [PubMed] [Google Scholar]
- Cunningham W.A., Van Bavel J.J., Johnsen I.R. Affective flexibility: evaluative processing goals shape amygdala activity. Psychological Science. 2008;19(2):152–160. doi: 10.1111/j.1467-9280.2008.02061.x. [DOI] [PubMed] [Google Scholar]
- Dahl R.E. Adolescent development and the regulation of behavior and emotion: introduction to part VIII. Annals of the New York Academy of Sciences. 2004;1021:294–295. doi: 10.1196/annals.1308.034. [DOI] [PubMed] [Google Scholar]
- Derntl B., Windischberger C., Robinson S., Lamplmayr E., Kryspin-Exner I., Gur R.C., Moser E., Habel U. Facial emotion recognition and amygdala activation are associated with menstrual cycle phase. Psychoneuroendocrinology. 2008;33(8):1031–1040. doi: 10.1016/j.psyneuen.2008.04.014. [DOI] [PMC free article] [PubMed] [Google Scholar]
- Eaton K.P., Szaflarski J.P., Altaye M., Ball A.L., Kissela B.M., Banks C., Holland S.K. Reliability of fMRI for studies of language in post-stroke aphasia subjects. Neuroimage. 2008;41(2):311–322. doi: 10.1016/j.neuroimage.2008.02.033. [DOI] [PMC free article] [PubMed] [Google Scholar]
- Fusar-Poli P., Bhattacharyya S., Allen P., Crippa J.A., Borgwardt S., Martin-Santos R., Seal M., O’Carroll C., Atakan Z., Zuardi A.W., McGuire P. Effect of image analysis software on neurofunctional activation during processing of emotional human faces. Journal of Clinical Neuroscience. 2010;17(3):311–314. doi: 10.1016/j.jocn.2009.06.027. [DOI] [PubMed] [Google Scholar]
- Giedd J.N., Blumenthal J., Jeffries N.O., Castellanos F.X., Liu H., Zijdenbos A., Paus T., Evans A.C., Rapoport J.L. Brain development during childhood and adolescence: a longitudinal MRI study. Nature Neuroscience. 1999;2(10):861–863. doi: 10.1038/13158. [DOI] [PubMed] [Google Scholar]
- Guyer A.E., Monk C.S., Clure-Tone E.B., Nelson E.E., Roberson-Nay R., Adler A.D., Fromm S., Leibenluft E., Pine D.S., Ernst M. A developmental examination of amygdala response to facial expressions. Journal of Cognitive Neuroscience. 2008;20(9):1565–1582. doi: 10.1162/jocn.2008.20114. [DOI] [PMC free article] [PubMed] [Google Scholar]
- Hare T.A., Tottenham N., Galvan A., Voss H.U., Glover G.H., Casey B.J. Biological substrates of emotional reactivity and regulation in adolescence during an emotional go-nogo task. Biological Psychiatry. 2008;63(10):927–934. doi: 10.1016/j.biopsych.2008.03.015015. [DOI] [PMC free article] [PubMed] [Google Scholar]
- Johnstone T., Somerville L.H., Alexander A.L., Oakes T.R., Davidson R.J., Kalin N.H., Whalen P.J. Stability of amygdala BOLD response to fearful faces over multiple scan sessions. Neuroimage. 2005;25(4):1112–1123. doi: 10.1016/j.neuroimage.2004.12.016. [DOI] [PubMed] [Google Scholar]
- Lundqvist D., Flykt A., Öhman A. Karolinska Institutet; Stockholm: 1998. The Karolinska Directed Emotional Faces-KDEF, CD-ROM from Department of Clinical Neuroscience, Psychology section, Karolinska Institutet. [Google Scholar]
- Maslowsky J., Mogg K., Bradley B.P., McClure-Tone E., Ernst M., Pine D.S., Monk C.S. A preliminary investigation of neural correlates of treatment in adolescents with generalized anxiety disorder. Journal of Child and Adolescent Psychopharmacology. 2010;20(2):105–111. doi: 10.1089/cap.2009.0049. [DOI] [PMC free article] [PubMed] [Google Scholar]
- McClure E.B., Adler A., Monk C.S., Cameron J., Smith S., Nelson E.E., Leibenluft E., Ernst M., Pine D.S. fMRI predictors of treatment outcome in pediatric anxiety disorders. Psychopharmacology. 2007;191(1):97–105. doi: 10.1007/s00213-006-0542-9. [DOI] [PubMed] [Google Scholar]
- McClure E.B., Monk C.S., Nelson E.E., Parrish J.M., Adler A., Blair R.J., Fromm S., Charney D.S., Leibenluft E., Ernst M., Pine D.S. Abnormal attention modulation of fear circuit function in pediatric generalized anxiety disorder. Archives of General Psychiatry. 2007;64(1):97–106. doi: 10.1001/archpsyc.64.1.97. [DOI] [PubMed] [Google Scholar]
- Monk C.S. The development of emotion-related neural circuitry in health and psychopathology. Development and Psychopathology. 2008;20(4):1231–1250. doi: 10.1017/S095457940800059X. [DOI] [PubMed] [Google Scholar]
- Monk C.S., McClure E.B., Nelson E.E., Zarahn E., Bilder R.M., Leibenluft E., Charney D.S., Ernst M., Pine D.S. Adolescent immaturity in attention-related brain engagement to emotional facial expressions. Neuroimage. 2003;20(1):420–428. doi: 10.1016/s1053-8119(03)00355-0. [DOI] [PubMed] [Google Scholar]
- Moore W.E., 3rd, Pfeifer J.H., Masten C.L., Mazziotta J.C., Iacoboni M., Dapretto M. Facing puberty: associations between pubertal development and neural responses to affective facial displays. Soceity of Cognitive and Affective Neuroscience. 2012;7(1):35–43. doi: 10.1093/scan/nsr066. [DOI] [PMC free article] [PubMed] [Google Scholar]
- Pfeifer J.H., Masten C.L., Moore W.E., 3rd, Oswald T.M., Mazziotta J.C., Iacoboni M., Dapretto M. Entering adolescence: resistance to peer influence, risky behavior, and neural changes in emotion reactivity. Neuron. 2011;69(5):1029–1036. doi: 10.1016/j.neuron.2011.02.019. [DOI] [PMC free article] [PubMed] [Google Scholar]
- Plichta M.M., Schwarz A.J., Grimm O., Morgen K., Mier D., Sauer C., Gerdes A.B., Haddad L., Tost H., Esslinger C., Colman P., Wilson F., Kirsch P., Meyer-Lindenberg A. Test–retest reliability of evoked BOLD signals from a cognitive-emotive fMRI test battery. Neuroimage. 2012;60(3):1746–1758. doi: 10.1016/j.neuroimage.2012.01.129. [DOI] [PubMed] [Google Scholar]
- Scherf K.S., Behrmann M., Dahl R.E. Facing changes and changing faces in adolescence: a new model for investigating adolescent-specific interactions between pubertal, brain and behavioral development. Development and Cognitive Neuroscience. 2012;2(2):199–219. doi: 10.1016/j.dcn.2011.07.016. [DOI] [PMC free article] [PubMed] [Google Scholar]
- Scherf K.S., Luna B., Avidan G., Behrmann M. What precedes which: developmental neural tuning in face- and place-related cortex. Cortex. 2011;21(9):1663–1680. doi: 10.1093/cercor/bhq269. [DOI] [PMC free article] [PubMed] [Google Scholar]
- Shaw D.J., Grosbras M.H., Leonard G., Pike G.B., Paus T. Development of functional connectivity during adolescence: a longitudinal study using an action-observation paradigm. Journal of Cognitive Neuroscience. 2011;23(12):3713–3724. doi: 10.1162/jocn_a_00112. [DOI] [PubMed] [Google Scholar]
- Shaw D.J., Grosbras M.H., Leonard G., Pike G.B., Paus T. Development of the action observation network during early adolescence: a longitudinal study. Society of Cognitive and Affective Neuroscience. 2012;7(1):64–80. doi: 10.1093/scan/nsq105. [DOI] [PMC free article] [PubMed] [Google Scholar]
- Silverman W.K., Albano A.M. The Psychological Corporation; San Antonio: 1996. Anxiety Disorders Interview Schedule for DSM-IV Child Version, Child Interview Schedule. [Google Scholar]
- Somerville L.H., Fani N., Clure-Tone E.B. Behavioral and neural representation of emotional facial expressions across the lifespan. Development and Neuropsychology. 2011;36(4):408–428. doi: 10.1080/87565641.2010.549865. [DOI] [PMC free article] [PubMed] [Google Scholar]
- Somerville L.H., Kim H., Johnstone T., Alexander A.L., Whalen P.J. Human amygdala responses during presentation of happy and neutral faces: correlations with state anxiety. Biological Psychiatry. 2004;55(9):897–903. doi: 10.1016/j.biopsych.2004.01.007. [DOI] [PubMed] [Google Scholar]
- Steinberg L. Cognitive and affective development in adolescence. Trends in Cognitive Sciences. 2005;9(2):69–74. doi: 10.1016/j.tics.2004.12.005. [DOI] [PubMed] [Google Scholar]
- Strawn J.R., Wehry A.M., DelBello M.P., Rynn M.A., Strakowski S. Establishing the neurrobiologic basis of treatment in children and adolsecents with generalized anxiety disorder. Depression and Anxiety. 2012 doi: 10.1002/da.21913. [DOI] [PubMed] [Google Scholar]
- Tahmasebi A.M., Artiges E., Banaschewski T., Barker G.J., Bruehl R., Buchel C., Conrod P.J., Flor H., Garavan H., Gallinat J., Heinz A., Ittermann B., Loth E., Mareckova K., Martinot J.L., Poline J.B., Rietschel M., Smolka M.N., Strohle A., Schumann G., Paus T. Creating probabilistic maps of the face network in the adolescent brain: a multicentre functional MRI study. Human Brain Mapping. 2012;33(4):938–957. doi: 10.1002/hbm.21261. [DOI] [PMC free article] [PubMed] [Google Scholar]
- Talairach J., Tournoux P. Thieme; New York: 1988. Co-planar Stereotaxic Atlas of The Human Brain 3-Dimensional Proportional System: an Approach to Cerebral Imaging. [Google Scholar]
- Thomas K.M., Drevets W.C., Whalen P.J., Eccard C.H., Dahl R.E., Ryan N.D., Casey B.J. Amygdala response to facial expressions in children and adults. Biological Psychiatry. 2001;49(4):309–316. doi: 10.1016/s0006-3223(00)01066-0. [DOI] [PubMed] [Google Scholar]
- Tottenham N., Tanaka J.W., Leon A.C., McCarry T., Nurse M., Hare T.A., Marcus D.J., Westerlund A., Casey B.J., Nelson C. The NimStim set of facial expressions: judgments from untrained research participants. Psychiatry Research. 2009;168(3):242–249. doi: 10.1016/j.psychres.2008.05.006. [DOI] [PMC free article] [PubMed] [Google Scholar]
- Wechsler D. Harcourt Brace; Canada: 1991. The Wechsler Intelligence Scale for Children-III. [Google Scholar]
- Wechsler D. Harcourt Assessment; San Antonio, TX: 1997. Wechsler Adult Intelligence Scale–III. [Google Scholar]
- Whalen P.J. Fear, vigilance, and ambiguity: Initial neuroimaging studies of the human amygdala. Current Directions in Psychological Science. 1998;7(6):177–188. [Google Scholar]
- Williams L.M., Brown K.J., Palmer D., Liddell B.J., Kemp A.H., Olivieri G., Peduto A., Gordon E. The mellow years?: Neural basis of improving emotional stability over age. Journal of neuroscience. 2006;26(24):6422–6430. doi: 10.1523/JNEUROSCI.0022-06.2006. [DOI] [PMC free article] [PubMed] [Google Scholar]
Associated Data
This section collects any data citations, data availability statements, or supplementary materials included in this article.