Abstract.
We experimentally investigated the Cherenkov luminescence imaging (CLI) of the isotopes with different beta particles energies (, , , , and ) in semitransparent biological equivalent media. The main focus of this work is to characterize the CLI when the sources are at the depth comparable with the range of beta particles. The experimental results were compared with Monte Carlo (MC) simulation results to fine tune the simulation parameters to better model the phantom materials. This approach can be applied to estimate the CLI performance for different phantom materials and isotopes. This work also demonstrates some unique properties of high energy beta particles that can be beneficial for CLI, including the possibility to utilize the betas escaped from the object for imaging purposes.
Keywords: Cherenkov luminescence imaging, nuclear imaging, biomedical imaging
1. Introduction
Cherenkov luminescence imaging (CLI) is an imaging technique based on the Cherenkov effect,1 which is an emission of electromagnetic radiation [or Cherenkov radiation (CR)] by a charged particle moving through a medium faster than phase velocity of light in that medium. Its application to in vivo and in vitro imaging of the positron-emitting radiotracers (e.g., ) was introduced in 2009.2,3 Recently, several groups have demonstrated and characterized the use of CLI to measure the distribution of beta-emitting radionuclides (both positron and electron) in small animals by optical imaging systems.4–9 These studies demonstrated that a wide variety of beta-emitting radionuclides (including , , , , , , , and ) can be used for CLI. In the studies reported by Mitchell et al. and Gill et al.,7,8 the light output from the CR in transparent media was estimated using GEANT4-based Monte Carlo (MC) simulation. In Ref. 9, the characteristics of CLI in biological tissue were characterized using results from similar MC simulations convolved with parametrized tissue optical properties. The reported deviation between the experiment and simulation results demonstrates the complexity of modeling optical properties of biological tissues and their effects on CLI.
Despite these prior efforts, it is unclear which isotope is most suitable for a given type of in vivo CLI study because the answer is not obvious. While high energy betas provide higher CR output, the large beta particle ranges can reduce CLI resolution. The “Cherenkov emission range” (or “CR range”) here and after means a range of the particle until its energy drops below the CR production energy threshold for this medium (e.g., for water the minimal energy for a beta particle is 260 keV). However, in common biological tissues, the CLI resolution is limited primarily by the strong light scattering (e.g., for epidermis and dermis at 577 nm the scattering lengths are 0.08 and 0.05 mm, respectively10). Thus, for the sources where their depths are significantly larger than the mean beta particle CR range, CLI resolution is predominantly limited by the diffusion of the CR photons rather than by beta-particle CR ranges. Otherwise, CLI resolution for the sources in relatively shallow (compared to the mean beta particle CR range) depth is affected by both the beta particle CR range and the medium’s optical properties.
While MC simulation techniques have been widely used to study many physical and biological interactions, their applications to modeling CR in biological tissues have a few intrinsic problems. First of all, to get a correct “CR cones,” an “actual” trajectory of the beta particle should be simulated. Due to the infinite range of the Coulomb potential and, thus, large number of possible interactions, conventional event-by-event MC simulations are not possible, and some integral algorithms (where the changes in beta particles energy and direction accumulated along the simulation step will be applied in the next step) should be used. Although those semiempirical algorithms work well for many applications (such as energy deposit, beam transmission, straggling, and so on), they do not simulate an “actual” smooth beta particle trajectory. Second, the Frank–Tamm equation11 (used in all MC codes)
| (1) |
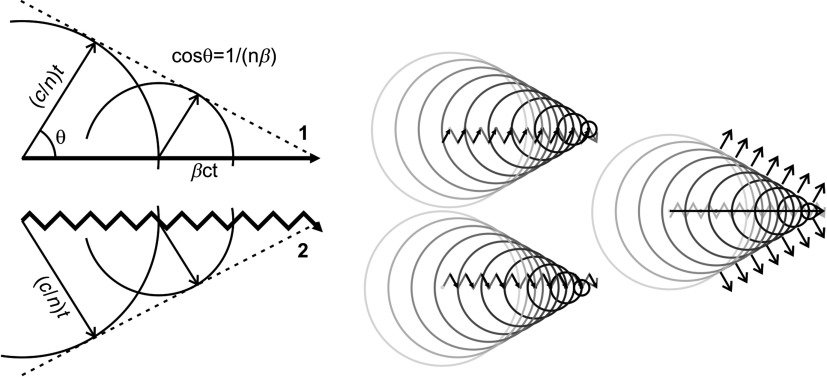
was derived with the following assumptions: the charge moves with the constant speed along a straight line in a uniform medium with a uniform index of refraction ; and there is no light attention or scattering in media. All of these conditions are barely satisfied in any biological tissue. In most MC codes, it is assumed that these conditions are satisfied locally in small simulation steps. Although the Cherenkov effect is on the border between quantum mechanics and classical electrodynamics, it is more on the classical side. This gives additional problems in using Eq. (1) locally: it can be applied only on the distances where: (1) a large amount of photons will be produced (to legitimize the transition from wave to photons); and (2) the index of refraction (macroscopic value) has a sensible meaning. “Wave-to-photon” transition also has a problem for MC. First of all, CR is an interference of the spherical polarization waves produced in dielectric by an electric field around the moving charge and, thus, there is no particular point for the CR photons emission. Second, some “loading” distance in trajectory is needed to excite polarization waves. Thus, an actual particle trajectory is not so important, but it is important that some of the particle positions produce an interference with the other previous positions. Following the most popular graphic explanation of CR (see Fig. 1), the secondary polarization waves for the trajectory 2 can be grouped in many ways (see Fig. 1 on the right). All of these partitions give the same CR cones with an axis that is not along the actual particle velocities but rather along the mean displacement. Thus, it should not be surprising that the direct implementation of Eq. (1) in MC simulations will lead to an overestimation of the CR output. This is a possible explanation for the overestimation reported in Ref. 12 (one of the most accurate and quantitative modeling of the CR production that we know) where the authors attributed the discrepancy to potential calibration error of the imager.
Fig. 1.
Cherenkov cones for two trajectories. Three different partitions (“top,” “bottom,” and “middle”) of polarization waves for trajectory 2 are shown on the right.
Since the small fluctuation in trajectory may be not so important for CR, the straight beta particles trajectory approach may be a reasonable approximation. Especially if we take into account that most of the beta particles scatterings are the scattering on small angles. This follows from the Mott differential cross section for the Coulomb scattering
| (2) |
where is the particle energy, and is the scattering angle. Also from Eq. (2) it follows that scattering rather happens at low beta energies (), thus, at the end of the trajectory where the CR emission will be minimal. Thus, statistically, the beta particle scattering can be ignored as it was demonstrated in our previous work.13 Also in this work, a straight trajectory approximation demonstrates reasonable results for the analytical calculations of the point spread functions for the CR sources in transparent media.
In this work, we studied the light output and image resolution for five radionuclides (, , , , and ) in tissue-equivalent phantoms. We combine both MC simulation and experimentally measured data to characterize CLI with respect to the beta particle end-point energy. This is an extension of our previous work13 where we studied the CLI of beta sources in transparent media. This work expands previous consideration to the semitransparent media, particular, to the characteristics of CLI when the depths of the radioactive sources are comparable to the mean beta particle CR range in the media. The reason that we are particularly interested in the behavior of CLI in this shallow depth is because the directional nature of CR in transparent media causes “flashlight effect.”13 That is, if there is no light scattering in a media, the only CR photons that can be detected by the camera are the photons emitted by the particles moving toward camera (within range of angles determined by the CR cone angle and camera’s aperture). Although the scattering of the light photons in semitransparent media should washout this effect, CR photons emitted by the particles moving toward the camera near the surface of the media will be less subjected to the absorption and scattering by the tissue. For this reason, the primary interest of this work is the case where the mean particle CR range is comparable with the source depth. Also, the goal of this work was to develop the simulation procedure that helps to predict/estimate CLI performance for the biological tissues with known optical properties.
Here is a summary for the questions to be answered: (1) what isotope is better for CLI? (2) is it possible to improve CLI resolution using different spectral region? and (3) can optical transducers (proposed in Ref. 13) be used for the CLI enhancement?
2. Experiment
In our experiments, we used an IVIS Lumina II XR System (Caliper Life Sciences, now PerkinElmer): an optical imaging system equipped with a thermoelectrically cooled CCD camera of and widely used in biological research. All images were obtained at the highest imager table position (field of view “A”: ) with 5-min exposure time. The “medium” bin size ( per bin) was used to reduce statistical noise. Imaging in different spectrum regions was acquired using four default IVIS transmission filters: GFP (515 to 575 nm), DsRed (575 to 650 nm), Cy5.5 (695 to 770 nm), and ICG (810 to 875 nm).
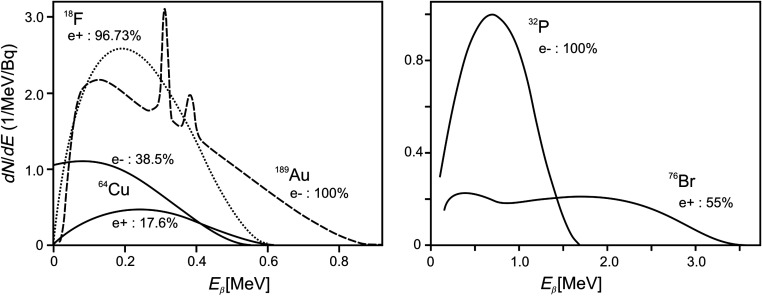
The following beta-emitting radionuclides were used: , , , , and . Corresponding beta-emission intensity , mean , and end-point energies of beta particles are presented in Table 1. Energy spectra of these isotopes are shown in Fig. 2.
Table 1.
The radionuclides used in this study.
| Activity (MBq) | (%) | (MeV) | (MeV) | ||
|---|---|---|---|---|---|
| 1.9 | 18 | 0.278 | 0.653 | ||
| 39 | 0.191 | 0.579 | |||
| 2.9 | 97 | 0.25 | 0.634 | ||
| 0.1 | 100 | 0.312 | 0.961 | ||
| a | 0.07 | 100 | 0.695 | 1.711 | |
| 0.6 | 55 | 1.18 | 3.941 |
Rough activity estimation.
Fig. 2.
Beta energy spectra of radioisotopes used in this study (plots are created using data from Refs. 14–22).
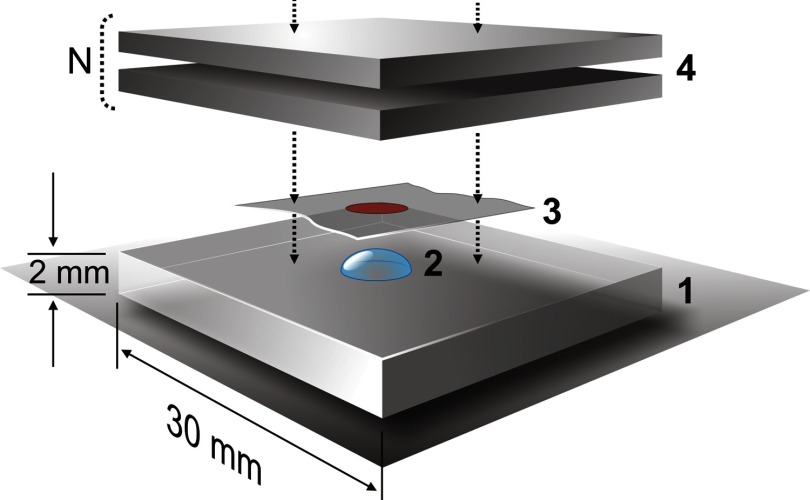
Point sources of each of these radionuclides were created by the evaporation of a droplet of the solution containing radioactivity on the surface of acrylic plate (; ; 3 mm thick). This procedure creates a point source of in diameter with activity ranging from 0.04 to 3 MBq. (Since the activity concentration of in solution was very low, the evaporation procedure was repeated a few times until the total activity became 0.1 MBq.) After the water evaporation, each source was secured by the Scotch “Magic tape” , thick (Fig. 3).
Fig. 3.
Experiment setup: (1) base: acrylic plate; (2) source: dried droplet of the activity solution in diameter; (3) scotch tape to protect the source; (4) phantom: from one to six layers () thick of the biological equivalent material.
The activity of all sources (except ) was measured by dropping the sealed point source along with the acrylic plate into a dose calibrator which typically has an accuracy of within 10% of its reading (see Table 1). In the case of , we do not have any instrument that can measure the radioactivity of a sealed source directly. Therefore, we relied on the volumetric measurement of the droplet times the “known” radioactivity concentration of the whole stock solution. Presented activity is an activity at the production time. Experimental results were decay–corrected to an actual experiment time.
The size of the point source was estimated by: (1) apparent droplet size on the surface before evaporation; and (2) by CLI of the source plates without any phantom (or “0” layers phantom, where the only source of CR is the Scotch tape over the source). As it was shown in Ref. 13, distribution of the CR emitted from the tape reproduces approximately the activity distribution on the acrylic plate. The CR profiles of the “0” layer phantoms are presented in Fig. 4. The corresponding full widths at the half maximum (FWHM) are shown in the plots.
Fig. 4.
CLI radiance profiles (normalized to the source activity) of the sources used in the experiment (“0 layers” source on the acrylic plate covered by the Scotch tape). The FWHMs of the radiance profiles approximately correspond to the visual diameters of the sources.
Our investigation requires access to phantoms that mimic biological tissues and meet the following requirements: (1) they should be uniform, stable in shape, and contents; (2) their thickness should be easily adjustable; (3) their parameters should remain unchanged during experiment; and (4) they should be readily available and reproducible. Fresh and frozen biological tissues do not meet these requirements. Through trial and error, we have identified that sliced bologna sausage to be the most readily available and reproducible phantom materials for our CLI experiments. Sliced bologna () has relatively uniform and stable structure that allows easy slice addition and removal to control the phantom thickness. For the experiments, we selected the samples with similar thickness based on the slice weight (, which corresponds to in thickness). Each slice was laid on top of a “white light table” to ensure no irregularity in the light transmission or “microscopic holes” that allow direct light leakage. Since the stopping power for beta particles () is mostly determined by the mean ionization potential, the beta energy loss is primarily determined by the water content of the medium. For this reason, bologna (60% of water with a variety of organic molecules) and biological tissues should have similar beta particle stopping properties {e.g., the difference in electron stopping powers for 0.5 MeV between compound [60% of water + 40% of ()] and NIST TISSUE SOFT (ICRP) is only 2%23}. Bologna phantom also has both strong light absorption and light scattering that mimic the biological tissue optical properties. Phantoms used in this work were not intended to reproduce the optical properties of a particular type of tissues, but rather used for comparison of the CLI characteristics for the different isotopes in a reproducible manner and also to validate the models used in MC simulations.
We emulate the source depth by adding one by one bologna slices on the top of the source plate (see Fig. 3). To avoid the air bubbles between the layers, we always follow the following procedure carefully. We bent a bologna slice and laid its center down first and then applied pressure from the center toward the edges to push air out of the surfaces in between. The oily surface of the bologna slices offers strong surface tension/adhesion and helps to provide good optical coupling between slices. (We practiced this procedure by laying down a bologna slice onto the surface of a clear plastic plate to ensure that we did not trap any air bubble in-between. With this procedure, we never see any irregularities in radiance images of the phantoms.)
Because some of the high energy betas can escape from the surface of the bologna phantom, we also imaged the phantoms under a microscope glass slide (1 mm thick: ). The glass slide acts as a transparent optical transducer with a high index of refraction () that produces an additional CR generated by the escaped beta particles, thus, increasing the total light output. More detailed explanation and demonstration of the transducer concept were presented in Ref. 13.
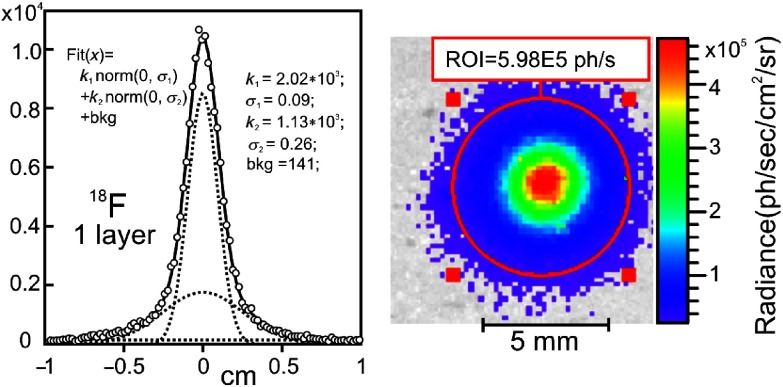
Maximum radiance and FWHM were used for CLI images quantification. Since some of the experimental radiance profiles (from the low energy isotopes with more than two layers of bologna) have very low intensity, the background radiation subtraction was very important. For this reason, radiance profiles from the obtained CLIs were fitted by the function combined from two Gaussian (“low” and “high” resolution) and a constant background. Maximum radiance and FWHM were estimated from this function after the background was subtracted. The error bars are taken from the comparison of the fitted profiles and the actual distributions (with and without background). An example of the CLI (superimposed on the “white field” photograph) with actual and fitted radiance profiles is shown in Fig. 5.
Fig. 5.
Example of the fitted radiance profile obtained from the CL image (on the right) of the one layer phantom for source. The experimental points are shown by circles. The fitted function, the sum of two normal distributions (low and high resolution), and constant background are shown by the solid line. Three components of the fitted function are shown by the dotted lines.
3. Monte Carlo Simulations
As mentioned before, continuous slowdown of the particle velocity and medium absorption should decrease the loading distance for the possible CR generation. Thus, it can be expected that the light output obtained in experiments will be smaller than those in MC simulations. In our MC simulations, the following approximation was used: CR output is only proportional to Eq. (1) and the coefficient of the proportionality will be obtained from the experiment.
MC simulations were carried out only for three isotopes: , , and . (The other two isotopes are similar to in energy.) For the photon propagation, we have used our MC code developed for the investigation of the optical (in infrared region) properties of the biological tissues.24 Those properties are: index of refraction ; asymmetry coefficient ; absorption , and scattering coefficients. The code simulates the light propagation (including reflection) through flat slabs of media (including tissues of different thickness assuming there is no air bubble trapped between adjacent bologna slices). Optical properties were adjusted as variables in the iterative MC simulations to improve the consistency with the experimental data. To simplify and, thus, accelerate simulations, the code exploits only the Fresnel’s reflection/transition coefficients for nonpolarized light, Snell’s law for the transition, and Henyey–Greenstein phase function for the light scattering. Henyey–Greenstein phase function is a single-parameter analytic form for the anisotropic scattering given as
| (3) |
where is the scattering angle, and is the asymmetry factor. The code simulates propagation of photons in a stack (in -direction) of infinite (in - and -directions) slabs of different tissues. The code outputs are the light distributions on the top (top) and the bottom (bottom) surfaces of the whole stack. This code was modified for the CR generated inside the phantom. A multilayer bologna phantom was considered as a single slab. Thus, only three slabs were used in simulations: acrylic base; Scotch tape; and a phantom with a thickness of -layers. “Base” and “tape” are crystal clear and have no dispersion.
CR photons were generated in the following approximations: (1) linear trajectories of the beta particles; (2) the beta particle stopping power is calculated in a “constant slow down approximation” for the “NIST TISSUE SOFT (ICRP)”;23 (3) CR photons are generated along the beta particle trajectory (simulation step is 0.1 mm) with an emission angle ; (4) the number of CR photons in a single simulation step was proportional to ; (5) the index of refraction was constant in the selected spectral region. Proportionality was used to overcome a statistical limitation for the Frank–Tamm Eq. (1). Thus, the simulated light output should be scaled to the experimental results. In this work, a single scaling factor was used for all isotopes, all spectral regions, and all phantoms. The beta energy spectrum,14–22 the number of photons, and the Cherenkov angle for a given beta energy were digitized with 1-keV simulation bins. The diameters of the simulated sources were assumed to be equal to the corresponding FWHMs of the experimental radiance profiles of the “0 layer” images (see Fig. 4).
Two types of the “top” radiance distributions were considered: (1) a distribution of the photons that pass through the tissue; and (2) a distribution of the photons that were collected by the camera above (with objective lens at ). There was not any tissue surface properties emulation. The first distribution can be considered as a case of the “white” surface: every photon is uniformly scattered in and the number of the detected photon will be proportional to the solid angle of the objective lens; while the second distribution can be considered as a case of an ideal surface without any scattering. The phantom used in this study is better described by the first case (white surface) while the glass-like materials in Ref. 13 is better represented by the second case.
To save simulation time, an adaptive number of decay (maximum decays) was used for every set of the input parameters (phantom thickness, , , , ) to keep, if it possible, a statistical error better than 3% (at least for the maximum radiance). Data outputs were normalized to the number of the simulated decays. The thickness of the phantom was counted in the unit of 1.7-mm thick layer of the NIST TISSUE SOFT (ICRP)23 with density .
4. Results and Discussion
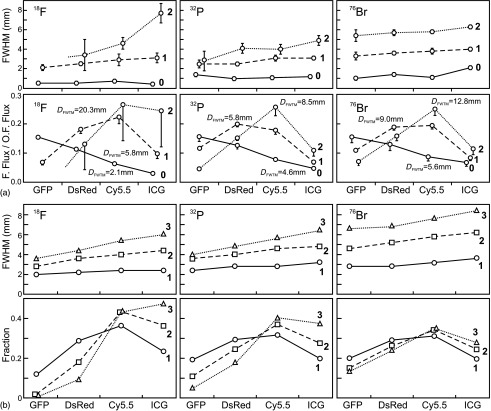
As it was expected, there was not a single set of optical parameters that can describe our experimental results for the different isotopes. For this reason, the experimental data were emulated using a sum of four different sets of optical parameters (emulation of four spectral regions used in the experiment) with the corresponding contribution factors. It was assumed that those factors are independent from the beta energies and material thickness. Since those four sets of parameters were compared with four spectral interval used in IVIS imager, “spectral” regions were named according to the filter names used in experiments (from “blue” to “red”): “GFP,” “DsRed,” “Cy5.5,” and “ICG.” To simplify the simulations, index of refraction and asymmetry factor were fixed to 1.4 and 0.8 correspondingly. From the experimental data for “0 layer” [see Fig. 6(a)], it can be seen that the spectral region contributions were almost similar for all three isotopes: 0.4/0.3/0.2/0.1. Thus, the same contribution factors (or fraction) were also fixed in our simulations.
Fig. 6.
FWHM of radiance profiles and the fraction of radiation in four different spectral regions: (a) experimental data for the first two layers. Here, fraction is defined as the ratio of filtered total flux to the total flux obtained with open filter. Flux is a radiance integrated over the region of interest with diameter equals to the full width at 0.1 of maximum (FWTM) of the source CLI with open filter. (b) MC simulation for the first three layers (the fraction is calculated for the whole region). Experimental data for “0” layer are shown in (a) for reference. The filtered images of the three-layer phantom in the experimental data is too dim for quantitative analysis.
Spectral measurement for every source (see Fig. 6) gives some estimation for the absorption coefficients that can be used as starting points for the MC iterations. Due to the complexity of the multiparameter fitting to the multidata sets (slices and isotopes), here only a few iterations were done for the demonstration purposes only.
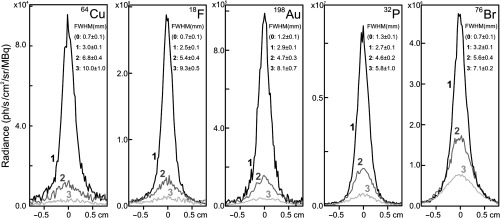
The experimental radiance profiles for the first three layers are shown in Fig. 7. These profiles were compared with the resulting MC profiles obtained with the fitted optical parameters [fraction, , (), (), ]: “GFP” - (0.4, 1.4, 12, 16, 0.8);”DsRed” - (0.3, 1.4, 5, 20, 0.8), “Cy5.5” - (0.2, 1.4, 2, 25, 0.8); “ICG” - (0.2, 1.4, 2, 25, 0.8).
Fig. 7.
Experimental radiance profiles for the phantoms with 1, 2, and 3 layers. The FWHM for “0 layers” is shown for the reference. Actual “0” profiles are shown in Fig. 4.
Maximum radiance and FWHM obtained in the experiments are shown in Fig. 8. Examples of the MC simulated profiles (sum of all four spectral regions) are shown in Fig. 9.
Fig. 8.
Experimental results: (a) maximum radiance; (b) FWHMs of the radiance profiles for , , ; and (c) FWHMs of the radiance profiles for and . [Dashed lines in (b) and (c) are for shown on both plots as a reference.]
Fig. 9.
MC simulated radiance profiles for the first -layers phantoms (sum of all four spectral regions).
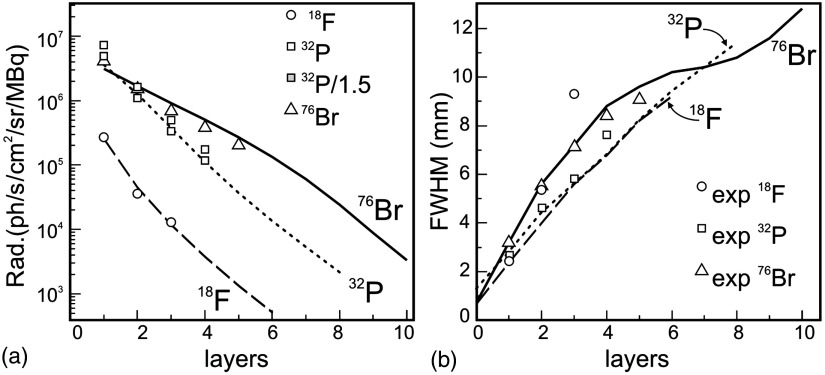
The comparison of the MC simulated (lines) and experimental (dots) values is shown in Fig. 10. The mean deviation between the MC simulated and the experimentally measured peak radiance from the , , and sources are 13%, 39%, and 29% of the MC simulated values. Since the peak of the detected CR profiles after several layers of bologna can span a large dynamic range (several orders of magnitude), a less than 30% error presents a small deviation in a semilog plot as shown in Fig. 10(a). It should be noted that the experimentally measured peak radiance of the source will be in better agreement with the MC calculation if the actual activity of the source was 1.5 times of the value estimated from the stock solution’s activity concentration (mean deviation will be 11%). The potential factors that may lead to the errors in the estimate of the total activity in the source include: buffer evaporation; nonuniform activity distribution inside the vial; pipetted volume deviated from the pipet setting due to different viscosity of the buffer solution from the calibration solution; and so on. Both the uncorrected experimental data and the corrected data are included in Fig. 10(a) for reference. It should also be noted that the assumption of a higher activity of the source () also improves the results previously presented in Ref. 13 where the same source was used.
Fig. 10.
(a) Maximum radiance and (b) FWHMs as a function of the phantom thickness (layers). Lines are for MC results: dashed line is for ; dotted line is for ; and solid line is for . MC data for the radiance were fitted to the experimental data (circles). Gray rectangles are for the data scaled by 1.5. (See remark in text.)
The FWHMs in Fig. 10(b) also demonstrate a good agreement between the experimental and MC results, except for with 2 and, especially, three layers of bologna phantoms. The discrepancy can be explained by the extremely low CR light intensities (or pixel values) of those images (see Fig. 7). Although the sources can still be clearly seen and provide correct estimation of the maximum radiance, it was difficult to quantify the FWHMs and the FWTMs of these sources. The shoulders of those distribution profiles are dominated by the noise (presumably produced by the electrons from the 511-keV gamma interactions). To subtract this background correctly, much higher image statistic is needed while we were limited by the maximum possible camera exposure time () and by the maximum available activity concentration.
As it was expected, has the largest penetration depth (among all radionuclides tested) for CLI. An interesting finding is that the growth rate of FWHM for isotopes and are similar: . It makes isotope the best in terms of the light output and resolution for the relatively thick phantoms (three to six layers). A second interesting finding is that, while originally the worst isotope in terms of image resolution, becomes a more preferable isotope when the source depth is more than six layers deep.
The hope that CLI in the “blue” or other spectral regions can provide better resolution was supported neither by the experiments nor by the simulations. Although there is a minor improvement in FWHMs in the “blue” region ( less than the “mean”), this improvement is not so impressive because of significant loss in the light output (less than 10% of the total flux when using no filter). This makes spectral CLI unpractical. (Although, it should be stated that this statement is only for our phantom, this may not be the case for some materials with very specific optical properties).
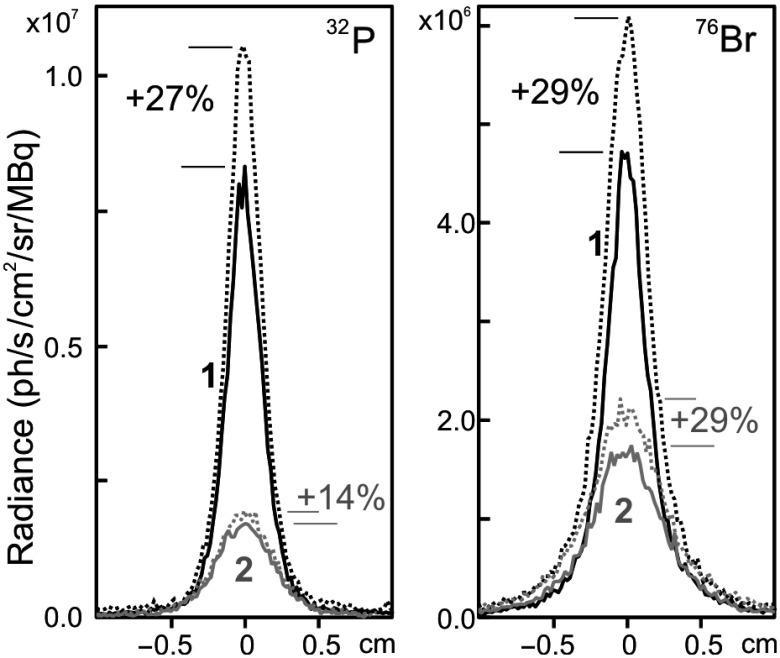
Application of the transducers on the phantom surface for the low energy isotopes demonstrates minor improvement in the light output even for a one-layer phantom (only a few percent in max radiance) and there are no detectable changes for two- and three-layer phantoms. This means that after one layer of medium, the CLI is governed by the light diffusion only. At the same time the radiance profiles for and (see Fig. 11) demonstrate up to improvement in the light output (with minor improvement in resolution). This improvement can be even more significant for the optically dark materials where the transducer will act rather as beta imager (as an example—CLI of the sources in nontransparent media presented in Ref. 13).
Fig. 11.
The radiance profiles 1 and 2 layers (black and gray lines, respectively) with (dotted lines) and without (solid lines) a glass transducer.
The pair of measurements with and without transducer opens a new possibility for biological imaging applications. The difference between these two images provides an “escaped beta CLI image” (EB CLI). EB CLI can be obtained also in a single measurement, if the CR light escaping from the phantom surface is blocked by a thin layer of aluminum foil (nontransparent for the light but transparent for the high energy betas). The simplest example of using EB CLI is an estimation of the minimal depth of the source. Using a few “spacers” (with known beta stopping power) of different thickness between the phantom and a “sealed” transducer, the thickness of the “spacer” with which CLI image can no longer be measured will provide an estimation of the minimal source depth in tissue. Unfortunately, EB CLI does not provide the maximum depth of the source in tissues that may be more important biologically (e.g., for estimating the melanoma invasion depth). Nevertheless, the information contents of CLI and EB CLI are different and can, theoretically, be extracted for further exploration.
We should note again that conclusions made here are only for the phantom used in our experiments and the results for the materials with other optical properties can be different. As it was shown in this paper CLI of other materials with known optical properties can be estimated by our code with the help of experimental data for parameters fitting and model improvement.
5. Conclusion
CLI is a simple and effective imaging tool for studying biomedical tissues qualitative. At the same time, quantitative analysis of the CL images is a challenge without prior knowledge of the optical properties of the tissues being studied. In this work, we present an approach that uses experimental data of the sample materials to fine tune MC simulation parameters in order to estimate the CLI performance for different materials and isotopes.
The MC code and our approach demonstrate good results not only for our semitransparent tissue-equivalent experiments but also for the transparent media as it was presented in Ref. 13. Although it was expected that the fitting parameters for the CR generation can be different for different materials, the same fitting works well for all isotopes and several materials used in this study (including transparent materials such as acrylic glass). The materials that we have tested so far all have similar stopping powers for the beta particles. Thus, its applicability to a broader range of materials is unknown. Nevertheless, the code can be used not only for the prediction of the CLI quality for the objects with known optical properties but also for the validation of the optical properties of unknown tissues under investigation.
Although the choice of isotope for a given study or application definitely depends on the object size and its optical properties, there is some advantages to use isotopes with mean beta ranges that are comparable with the source depth.
As it was mentioned before, the hope that CLI in “blue” or other spectral regions can provide better resolution was not supported by our experimental or simulation results. In our study, the “blue” filtration reduces the CLI intensity by a factor of 10 with a mere 20% improvement in FWHM.
Optical transducers provide some improvement in CLI for high energy beta-emitters. The use of transducers opens some opportunities for new approaches in CLI. De facto they are simple beta imagers that can be applied in situ and that can provide valuable information about objects.
Acknowledgments
The authors would like to thank Dr. Dong Zhou of Washington University in St. Louis and Dr. Cathy Cutler from University of Missouri-Research Reactor [now director of the Medical Isotope Research Production and Development group (MIRP) at Brookhaven National Laboratory] for providing and for the imaging experiments presented in this manuscript. This work was supported in part by the National Center for Research Resources (NCRR) of the National Institutes of Health (NIH), Award #S10RR031625; and in part by the Office of Science (BER), US Department of Energy (DOE), grant DE-SC0005157; and in part by the National Science Foundation, grant NSF-IIA-1430428; and in part by the Mallinckrodt Institute of Radiology (Allotment 10-006). The content is solely the responsibility of the authors and does not represent the official views of the NCRR of NIH, or the BER of DOE.
Biographies
Sergey Komarov is a research professor in radiology and biomedical engineering at Washington University in St. Louis. His research focuses on the developments and applications of multimodality molecular-imaging technologies for clinical, preclinical and plant-imaging research.
Yongjian Liu is an associate professor of Mallinckrodt Institute of Radiology, Washington University School of Medicine. He received his PhD from the Department of Chemistry, University of Missouri–Columbia, in May 2007 and completed his postdoctoral research associate training at Washington University in 2011. His research has focused on the development and translation of molecular probes including peptide, small molecules, antibody, and nanostructures for preclinical and human imaging and therapy
Yuan-Chuan Tai is an associate professor of radiology and biomedical engineering in Washington University in St. Louis. He received his PhD in biomedical physics in 1998 and his postdoctoral training in 2001 from the Department of Molecular and Medical Pharmacology, University of California, Los Angeles. His research interest includes the development of high-resolution and high-sensitivity PET imaging technologies, multimodal imaging devices, and molecular imaging and therapeutics for clinical, preclinical, and plant phenotyping research.
Disclosures
The authors have no relevant financial interests in this article and no potential conflicts of interest to disclose.
References
- 1.Čerenkov P. A., “Visible radiation produced by electrons moving in a medium with velocities exceeding that of light,” Phys. Rev. 52, 378–380 (1937). 10.1103/PhysRev.52.378 [DOI] [Google Scholar]
- 2.Robertson R., et al. , “Optical imaging of Cerenkov light generation from positron emitting radiotracers,” Phys. Med. Biol. 54, N355–N365 (2009). 10.1088/0031-9155/54/16/N01 [DOI] [PMC free article] [PubMed] [Google Scholar]
- 3.Cho J. S., et al. , “Cerenkov radiation imaging as a method for quantitative measurements of beta particles in a microfluidic chip,” Phys. Med. Biol. 54, 6757–6771 (2009). 10.1088/0031-9155/54/22/001 [DOI] [PMC free article] [PubMed] [Google Scholar]
- 4.Liu H., et al. , “Molecular optical imaging with radioactive probes,” PLoS One 5(3), e9470 (2010). 10.1371/journal.pone.0009470 [DOI] [PMC free article] [PubMed] [Google Scholar]
- 5.Ruggiero A., et al. , “Cerenkov luminescence imaging of medical isotopes,” J. Nucl. Med. 51(7), 1123–1130 (2010). 10.2967/jnumed.110.076521 [DOI] [PMC free article] [PubMed] [Google Scholar]
- 6.Spinelli A. E., et al. , “Cerenkov radiation allows in vivo optical imaging of positron emitting radiotracers,” Phys. Med. Biol. 55, 483–495 (2010). 10.1088/0031-9155/55/2/010 [DOI] [PubMed] [Google Scholar]
- 7.Mitchell G. S., et al. , “In vivo Cerenkov luminescence imaging: a new tool for molecular imaging,” Philos. Trans. R. Soc. A 369, 4605–4619 (2011). 10.1098/rsta.2011.0271 [DOI] [PMC free article] [PubMed] [Google Scholar]
- 8.Gill R. K., Mitchell G. S., Cherry S. R., “Computed Cerenkov luminescence yields for radionuclides used in biology and medicine,” Phys. Med. Biol. 60, 4263–4280 (2015). 10.1088/0031-9155/60/11/4263 [DOI] [PubMed] [Google Scholar]
- 9.Glaser A. K., et al. , “Cherenkov radiation fluence estimates in tissue for molecular imaging and therapy applications,” Phys. Med. Biol. 60, 6701–6718 (2015). 10.1088/0031-9155/60/17/6701 [DOI] [PMC free article] [PubMed] [Google Scholar]
- 10.Tuchin V. V., Tissue Optics: Light Scattering Methods and Instruments for Medical Diagnosis, 3rd ed., PM 254, SPIE Press, Bellingham, Washington: (2015). [Google Scholar]
- 11.Frank I. M., Tamm I. E., “Coherent radiation of fast electron in medium,” Dokl. Akad. Nauk SSSR 14, 107–113 (1937). [Google Scholar]
- 12.Beattie B. J., et al. , “Quantitative modeling of Cerenkov light production efficiency from medical radionuclides,” PLoS One 7(2), e31402 (2012). 10.1371/journal.pone.0031402 [DOI] [PMC free article] [PubMed] [Google Scholar]
- 13.Komarov S., et al. , “Cherenkov luminescence imaging in transparent media and the imaging of thin or shallow sources,” J. Biomed. Opt. 20(3), 036011, (2015). 10.1117/1.JBO.20.3.036011 [DOI] [PMC free article] [PubMed] [Google Scholar]
- 14.Blaser J. P., Boehm F., Marmier P., “The positron decay of F18,” Phys. Rev. 75, 1953–1953 (1949) 10.1103/PhysRev.75.1953 [DOI] [Google Scholar]
- 15.Daniel H., “Shapes of beta-ray spectra,” Rev. Mod. Phys. 40(3), 659–672 (1968). 10.1103/RevModPhys.40.659 [DOI] [Google Scholar]
- 16.Fan C.-Y., “Beta-spectra and internal conversion coefficients for , , , and ,” Phys. Rev. 87(2), 252–262 (1952). 10.1103/PhysRev.87.252 [DOI] [Google Scholar]
- 17.Jensen E. N., et al. , “The beta-spectra of and ,” Phys. Rev. 85(1), 112–119 (1952). 10.1103/PhysRev.85.112 [DOI] [Google Scholar]
- 18.Fultz S. C., Pool M. L., “Radioisotopes of bromine,” Phys. Rev. 86(3), 347–350 (1952). 10.1103/PhysRev.86.347 [DOI] [Google Scholar]
- 19.Konopinski E. J., The Theory of Beta Radioactivity, Oxford University Press, Oxford: (1966). [Google Scholar]
- 20.Langer L. M., Moffat R. D., Price H. C., “The beta-spectra of ,” Phys. Rev. 76, 1725–1726 (1949). 10.1103/PhysRev.76.1725.2 [DOI] [Google Scholar]
- 21.National Bureau of Standards, Tables for the Analysis of Beta Spectra, Applied Mathematics Series 13, U.S. Government Printing Office, Washington: (1952). [Google Scholar]
- 22.Wu C. S., Moszkowski S. A., Beta Decay, Interscience Publishers, New York: (1966). [Google Scholar]
- 23.Berger M. J., et al. , “Stopping power and range tables for electrons, positrons, and helium ions,” NIST, http://physics.nist.gov/PhysRefData/Star/Text/ESTAR.html (2005).
- 24.Zhang H., et al. , “Penetration depth of photons in biological tissues from hyperspectral imaging in shortwave infrared in transmission and reflection geometries,” J. Biomed. Opt. 21(12), 126006 (2016). 10.1117/1.JBO.21.12.126006 [DOI] [PMC free article] [PubMed] [Google Scholar]


