Abstract
Globally, few precipitation records extend to the 18th century. The England Wales Precipitation (EWP) series is a notable exception with continuous monthly records from 1766. EWP has found widespread use across diverse fields of research including trend detection, evaluation of climate model simulations, as a proxy for mid‐latitude atmospheric circulation, a predictor in long‐term European gridded precipitation data sets, the assessment of drought and extremes, tree‐ring reconstructions and as a benchmark for other regional series. A key finding from EWP has been the multi‐centennial trends towards wetter winters and drier summers. We statistically reconstruct seasonal EWP using independent, quality‐assured temperature, pressure and circulation indices. Using a sleet and snow series for the UK derived by Profs. Gordon Manley and Elizabeth Shaw to examine winter reconstructions, we show that precipitation totals for pre‐1870 winters are likely biased low due to gauge under‐catch of snowfall and a higher incidence of snowfall during this period. When these factors are accounted for in our reconstructions, the observed trend to wetter winters in EWP is no longer evident. For summer, we find that pre‐1820 precipitation totals are too high, likely due to decreasing network density and less certain data at key stations. A significant trend to drier summers is not robustly present in our reconstructions of the EWP series. While our findings are more certain for winter than summer, we highlight (a) that extreme caution should be exercised when using EWP to make inferences about multi‐centennial trends, and; (b) that assessments of 18th and 19th Century winter precipitation should be aware of potential snow biases in early records. Our findings underline the importance of continual re‐appraisal of established long‐term climate data sets as new evidence becomes available. It is also likely that the identified biases in winter EWP have distorted many other long‐term European precipitation series.
Keywords: data quality, drier summers, England Wales Precipitation, Gordon Manley, historical climate, sleet and snow, wetter winters
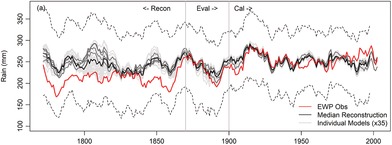
The trend towards wetter winters and drier summers in EWP can be explained by changes in measurement practice and data biases. For winter (Figure below), the timing of divergence aligns with the introduction of the Snowdon Pattern Rain Gauge in the UK around 1863. Given the widespread use of EWP across environmental and climate research, we expect that our findings will challenge understanding of multi‐centennial trends in precipitation in the UK. These changes in measurement practice are also likely to affect other long‐term precipitation records in north‐west Europe.
1. INTRODUCTION
Long‐term, quality‐assured records are essential for understanding climate variability and change (Brázdil et al., 2005). Globally, few such records extend to the 18th century, particularly for precipitation. The England Wales Precipitation (EWP) series (Wigley et al., 1984; Wigley and Jones, 1987; Alexander and Jones, 2000; Simpson and Jones, 2014) is a rare exception, providing a continuous monthly record from 1766. This areal precipitation series, derived from five rainfall regions to avoid sampling bias, is regarded as homogenous (Wigley et al., 1984; Croxton et al., 2006) and is routinely updated by the UK Met Office (UKMO) Hadley Centre. Over more than three decades, EWP has found widespread use in understanding precipitation variability in Northwest Europe (e.g., Murphy et al., 2018), trend detection (Gregory et al., 1991; Jones et al., 1997; Jones and Conway, 1997; Jenkins et al., 2008; Kendon et al., 2017; 2018), evaluation of climate model simulations (Dessai and Hulme, 2008), as a proxy for mid‐latitude atmospheric circulation (Luterbacher et al., 2001), a predictor in long‐term European gridded precipitation data sets (Pauling et al., 2006; Casty et al., 2007), the assessment of droughts (Marsh et al., 2007) and extremes (Beran, 2002), tree‐ring reconstructions (Rinne et al., 2013) and as a benchmark for other regional series (Noone et al., 2016).
A key finding from analysis of EWP is a trend towards wetter winters (DJF) and drier summers (JJA) (Gregory et al., 1991; Jones et al., 1997; Jones and Conway, 1997; Jenkins et al., 2008; Kendon et al., 2017). This is consistent with regional climate model projections for coming decades (Maisey et al., 2018). However, both trends depend critically on the early series, prior to the pioneering work of George J. Symons and Charles Higman Griffith who, in the 1860s, led the standardization of rain gauge design, exposure and measurement practice in the UK (Walker, 2010; Burt, 2013). Despite widespread application of EWP over more than three decades, the early record and associated trends have not been re‐evaluated in light of modern evidence, while homogeneity issues have been recognized at constituent gauges (Wigley et al., 1984; Burt and Howden, 2011). Here, we statistically reconstruct EWP using independent, quality‐assured temperature, pressure and circulation indices to examine the early record.
2. DATA AND METHODS
Monthly EWP data were accessed from the UKMO (https://www.metoffice.gov.uk/hadobs/hadukp/) and the winter (DJF), spring (MAM), summer (JJA) and autumn (SON) series compiled. Winters are specified by the year in which January falls. We reconstruct EWP seasonal precipitation using multiple linear regression. Emphasis is placed on the winter (henceforth EWP w) and summer (henceforth EWP s) series given the previously identified trends in these seasons.
Predictors are based on available long‐term observed and reconstructed sea level pressure (SLP), temperature and wind direction series (listed in Table 1 and described below). Predictor selection and estimation of model coefficients were undertaken for the calibration period 1900–2002; the period of optimum overlap between EWP and predictors. Simulations were evaluated for the years 1870–1899, before focusing attention on our reconstruction period 1767–1869 (i.e., before the work of Symons and Higman Griffith).
Table 1.
Overview of predictors and associated data used for model building, together with their relation to EWP
| Predictor data sets and period used | Relation to EWP |
|---|---|
| CET 1767–2002 (Manley, 1974; Parker et al., 1992) | Warm winters tend to be wetter winters through enhanced advection. |
| WI 1767–2002 (Barriopedro et al., 2014); Wheeler et al., 2010) | Measure of the persistence of westerly winds beneath the exit zone of the North Atlantic extratropical jet stream. |
| PL 1767–2002 (Cornes et al., 2013) | Measure of westerly air flow over Northwest Europe. Used as an indicator of the state of the NAOI. |
| LSLP 1767–2002 (Cornes et al., 2012a) | MSLP for the city of London. High pressure is associated with lower precipitation totals. |
| Leading EOF of reconstructed gridded SLP (KEOF) 1767–2002 (Küttel et al., 2010) | Surrogate for the NAOI from independent SLP reconstructions |
| Average of correlated grids from reconstructed gridded SLP (KAVG) 1767–2002 (Küttel et al., 2010; Baker et al., 2018) | SLP for area representing 50o–60oN, 10oW–5°E high pressure associated with lower precipitation totals. |
Note: Full details of each predictor are provided in the Section 2.
2.1. Predictor variables
Long‐term predictor variables that are independent from EWP and describe important dynamics of regional precipitation were available for model building. While these have been independently quality assured, we acknowledge that each may be subject to unknown inhomogeneities. Our predictors were:
Central England Temperature (CET): (Manley, 1974; Parker et al., 1992). Previous research shows that CET winter and summer temperatures are strongly correlated with precipitation in the British and Irish Isles (Murphy et al., 2018). CET data were downloaded from the UKMO (https://www.metoffice.gov.uk/hadobs/hadcet/) and seasonal mean temperature extracted.
Westerly Index (WI): A monthly index of atmospheric circulation variability over the North Atlantic from 1685–2008 (Barriopedro et al., 2014), based on direct observations of wind direction from Royal Navy logbooks from 1685 to 1850 provided by ship movements in the English Channel. After 1850, the CLIWOC v1.5 (García‐Herrera et al., 2005) and the ICOADS v2.1 (Worley et al., 2005) data sets are used. The WI provides a measure of the persistence of westerly winds beneath the exit zone of the North Atlantic extratropical jet‐stream roughly covering the English Channel area (Wheeler et al., 2010). Before 1850, the WI contains only one record of wind direction (measured with a 32‐point compass) per day, with data available for 95% of days (Barriopedro et al., 2014). The monthly WI used here is defined as the percentage of days per month with prevailing wind from the west (i.e., blowing from between 225 and 315° from true north).
London Sea Level Pressure (LSLP): A 315‐year (1692–2007) daily series of mean SLP (MSLP) for the city of London (Cornes et al., 2012a). Digitized data were transcribed from multiple sources, quality controlled, corrected and homogenized to represent daily means of MSLP at standard modern‐day conditions (Cornes et al., 2012a). Monthly values of MSLP are not reported when missing values exceed 20%. Data were obtained from the Climatic Research Unit (CRU) at the University of East Anglia (https://crudata.uea.ac.uk/cru/data/parislondon/).
Paris London Index (PL): An indicator of the state of the North Atlantic Oscillation Index (NAOI) over the years 1692–2007, providing a consistent measure of westerly airflow over Northwest Europe (Cornes et al., 2013). The index was developed from MSLP data recovered and corrected for the respective cities (Cornes et al., 2012a; 2012b). Data were obtained from CRU (https://crudata.uea.ac.uk/cru/data/parislondon/).
Küttel EOF: Küttel et al. (2010) extended the HadSLP2 data set (1850–2004) (Allan and Ansell, 2006) to 1750 using a combination of homogenized instrumental pressure series and data from ship log books derived from the CLIWOC data set for years up to 1855 and wind information from the ICOADS database V2.4. Reconstructions are presented as a 5 × 5° resolved gridded seasonal SLP data set covering the eastern North Atlantic, Europe and the Mediterranean area (40°W–50°E; 20°–70°N) back to 1750. Data were downloaded from the NOAA National Centres for Environmental Information National Climatic Data Centre (ftp://ftp.ncdc.noaa.gov/pub/data/paleo/historical/kuettel2009slp.txt). We derived the first Empirical Orthogonal Function (EOF) of the gridded SLP (KEOF) as a measure of the NAOI.
Küttel AVG: We use the Küttel et al. (2010) gridded SLP reconstructions to derive winter and summer average SLP predictors for a grid box representing the UK. Following previous work, we define Küttel AVG as the standardized mean MSLP anomaly in a box centred over the UK (50°–60°N, 10°W–5°E) (Baker et al., 2018).
Küttel Grids: We also identify individual 5 × 5° grids that provide significant predictors of EWPw and EWPs. These grids are numbered using the naming convention of the original data set (Küttel et al., 2010). Grid point 1 is centred at 40°W/70°N, grid point 2 at: 35°W/70°N, through to grid point 209 centred at 50°E/20°N.
2.2. Model selection, fitting and testing for seasonal EWP
Multiple linear regression models were developed for each season with predictors selected during the calibration period 1900–2002 (the maximum overlap for available predictors as gridded SLP reconstructions end in 2002). Both the predictand (observed EWP) and potential predictors were checked for compliance with the assumptions of ordinary least squares regression. Winter and autumn CET were found to be non‐normally distributed, so were transformed using a Box‐Cox Transformation (estimated Lambda 1.4 and 1.2, respectively) (Osborne, 2010). Observed autumn EWP was also found to be non‐normal (p = .04), however, for ease of interpretation and plotting was not transformed. Models were selected for use provided they: (a) explain more than 70% of variance (R 2) in winter and summer EWP and more than 60% in spring and autumn EWP over the full calibration period; (b) predictors are a statistically significant (p < .05) addition to the model and (c) are unaffected by multicollinearity (indicated by the Variance Inflation Factor).
To explore the effect of uncertainty in calibration data on simulations, selected models were fitted using 1,000 bootstrap re‐samples of 50 years (with replacement) from the calibration data set. These re‐samples were then used to establish (a) a median simulation for each selected model; (b) an ensemble median simulation across all models and (c) 95% confidence intervals across all models. All resampled simulations were assessed to ensure the iid assumption of OLS residuals. Simulations were evaluated using independent data for the period 1870–1899 before examining reconstructions for the period 1767–1869. Decadal means were derived using a centred moving average.
2.3. Investigating winter model residuals
Manley's London sleet and snow (SS) series was used to investigate the potential role of snow under‐catch on EWPw model residuals. The full SS series runs from 1668–1974. These data were originally tabulated by Gordon Manley and Elizabeth Shaw drawing on numerous gauges in the greater London area (Manley, 1969). The data are assumed to represent an elevation up to 200 ft (Manley, 1969). While plotted and discussed in Manley's original 1969 paper, the data were never digitized. Following his death in 1980, Manley's notes were deposited by Mrs. Audrey Manley (his widow) in Cambridge University Library. These are housed in a dedicated archive (Reference: GB 12 MS.Add.8386) with his notes on snow contained in Box 16/27. These notes remain in the original envelopes in which they were deposited. The lead author visited this archive in December 2017 and scanned the data relating to the London SS series. These were later transcribed using double keying to avoid data entry errors.
Manley subjected the series to substantial quality control. The series is never based on fewer than three good quality stations back to 1811 and at least two stations between then and the 1680s (Manley, 1969). Correction was made for the adoption of the Gregorian calendar in September 1752. Observations of the occurrence of sleet and snow were categorized into four quality grades based on the assumed “alertness” of the observer: A – data from first‐class airfields and observatories; B – data from keen climatological observers; C – data from sites at which one daily visit was made to the instruments and D – data from stations overseen by observers who had other duties (Manley, 1969). Table S1 provides a list of the stations contributing to the London SS series, together with their altitude, observer surname and quality control grade assigned by Manley to the data. Comparisons of model residuals and the London SS series are undertaken using centred decadal means. Where correlations are presented, they are derived using Pearson's correlation.
2.4. Additional models developed
Regression models are also derived for selected constituent EWP series. In order to aid the interpretation of EWPs model residuals, reconstructions of summer precipitation at Kew and Oxford were derived. Both stations are influential constituents of EWP for the south east England region and among the longest available series in the UK. Precipitation totals for both stations were obtained from CRU (https://crudata.uea.ac.uk/cru/data/UK_IR_rainfall_data/) and summer (JJA) totals extracted. The same predictors and study design as above were used for reconstructing both series, with the exception that only the best fit model was employed for each station.
2.5. Testing for trends
Evidence of monotonic trends in observed and simulated EWP and Manley's London Sleet and Snow Series was assessed using the non‐parametric Mann–Kendall (MK) test (Mann, 1945; Kendall, 1975). While a monotonic trend is likely a poor model for UK precipitation, such a model has nonetheless been widely applied. Here, we use the MK test primarily as an analytical tool to examine differences between observations and reconstructions. The standardized MK statistic (MKZs) follows the standard normal distribution with a mean of zero and variance of one. A positive (negative) MKZs indicates an increasing (decreasing) trend. Statistical significance was evaluated with probability of type 1 error set at the 5% significance level. We apply a two‐tailed MK test; hence, the null hypothesis of no trend (increasing or decreasing) is rejected when |MKZs| > 1.96. All variables were checked for positive lag‐1 serial correlation at the 5% level using the Durbin Watson test. The MK test was applied to simulated and observed EWP for different time periods (with at least 30 years) to examine consistency of trends depending on start and end years. To examine robustness of trends ending in 2002, the MK test was also applied to the full observed EWP w and EWP s series ending in 2018. For Manley's London SS series the MK test was applied to the full series 1669–1974.
3. RESULTS
3.1. Winter
We identify 35 models for simulating EWP w (Table S2). Models are skilful and show equally good performance for calibration and evaluation periods (Table S2). During the period 1767–1869, EWP w is consistently lower than the median simulation, except for the period 1825–1840 (Figure 1). Notably, simulations show higher uncertainty for the period 1790–1825, with lower bound simulations falling close to observed EWP w. Closer inspection reveals exceptional zonal differences in mean SLP for these decades (Figure S1), which were remarkable in the full record of EWP (Figure S2). Thirty‐year (1791–1820) mean SLP anomalies show higher than average pressure in the eastern Atlantic and lower than average pressure over the UK and Europe. This is consistent with prevalence of strongly negative NAO conditions during this time, also evident in the WI, KEOF and PL indices. Quality assured observations of SLP at London (LSLP), Edinburgh and Paris confirm the tendency for lower than average SLP over the region during this period (Figure S3) and that gridded reconstructions underestimate SLP. Simulations lying close to observed EWP w during the early 1800s (Figure 1) originate from reconstructed SLP grids located west of the UK (higher than average pressure). Based on the above evidence these grids are regarded as unrepresentative of UK conditions at that time, so were removed from further analysis.
Figure 1.
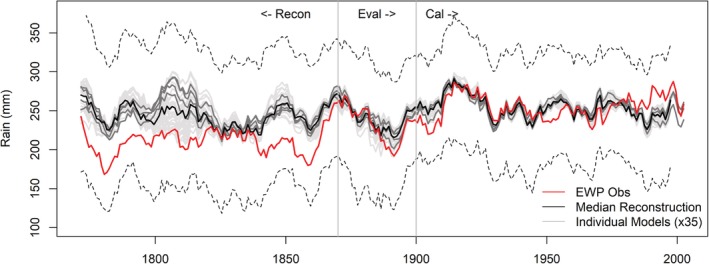
Decadal mean observed and modelled EWPw 1767–2002. Included are median simulations from each of the 35 individual models (grey lines) together with the ensemble median (black line). Dark grey lines represent models based on observed data only. Dashed lines indicate upper and lower 95% confidence intervals for reconstructions
Lower than expected observed EWP w precipitation totals during our reconstruction period are unlikely reflecting changing station density in EWP given the relatively stable number of stations in EWP throughout most of the 19th century (Wigley et al., 1984). Although colder winters tend to be drier, we find a bias in the pre‐1870 period, whereby precipitation totals during colder than average (1766–2002) winters are significantly lower than expected when compared with the post‐1870 record (t test −2.39; p < .05). From early observations at well documented stations it is unclear whether observers were actually measuring snowfall (Smith, 1979; Burt and Howden, 2011). Moreover, in an address to the Royal Meteorological Society in 1891, Symons noted that prior to the introduction of the Snowdon pattern rain gauge in 1864, gauges were subject to large under‐catch during snowfall due to the absence of a protective rim. He asserted that “most of the early English records are (for the winter months) too small [low], owing to insufficient attention to the measurement of snow” (Symons, 1891).
We employ the sleet and snow (henceforth SS) series compiled by Gordon Manley and Elizabeth Shaw (Manley, 1969) to investigate this bias. The series exhibits a significant decreasing trend in the annual frequency of SS days (MKZs −2.68; p < .05) (Figure 2a). During our reconstruction period (1767–1869) persistent periods of high SS frequency, in excess of the 1900–1949 mean, are apparent (Figure 2a). Also evident is that the period 1825–1840 (years for which EWP w and reconstructions agree) shows low SS frequency–lower even than the 1900–1949 mean (Figure 2a). Notably, the SS series explains between 25 and 66% of the variance in decadal EWP w model residuals (Figure 2b); (48–66% for models based on observed SLP). Unexplained variance is likely associated with a combination of non‐standard gauge heights (above the ground) in the early series and associated wind loss (Craddock, 1976), together with under‐representation of upland gauges in the early EWP series (Wigley et al., 1984).
Figure 2.
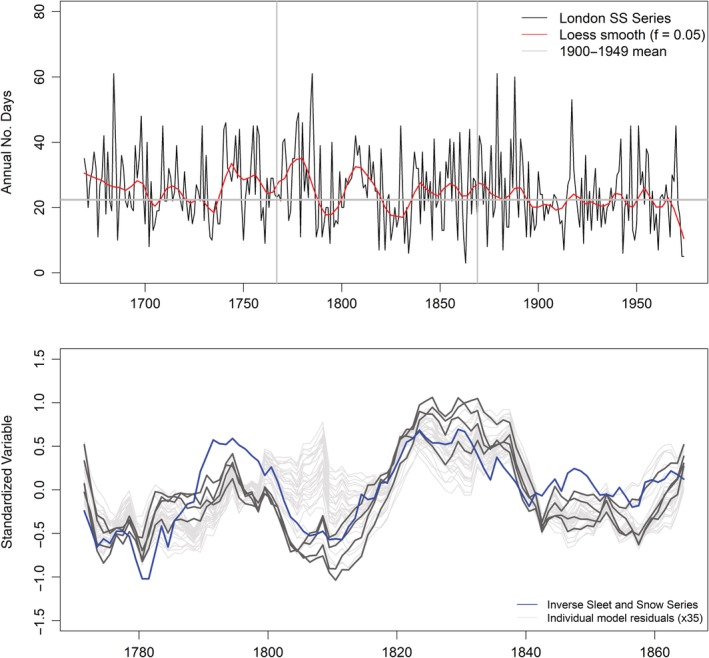
(a) Manley's Sleet and Snow Series for the greater London area 1669–1974. Also plotted is the loess smoothed (f = 0.05) series. Vertical grey lines indicate years employed to investigate winter model residuals. (b) Comparison of standardized decadal mean inverse sleet and snow series (blue) 1767–1869 with standardized decadal mean model residuals. Grey lines represent median residuals from each model, dark grey lines are models based on observations only. Black line shows the ensemble median residual
Investigation of monotonic trends in observed and simulated EWP w reveals large differences in the strength and significance of trends. Observed EWPw shows highly significant increasing trends for tests commencing before 1860 (Figure 3). Significant trends for the equivalent period are not evident in the median reconstruction (Figure 3). Inspection of trends across all models (Figure S4) reveals that for the full period of analysis (1767–2002), 94% of simulations show no significant increasing trend in EWP w. Of the simulations that show significant tends, the magnitude is substantially less than observed. For later periods (Figure S4b,c) trends in modelled and observed EWP w are more consistent, whereby both simulated and observed EWP w reveal non‐significant changes.
Figure 3.
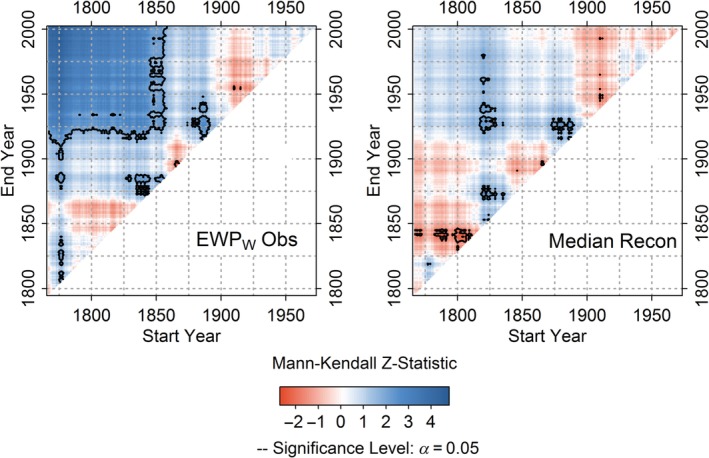
Mann Kendall Zs scores for observed EWPw and median model reconstruction for all combination of start and end years (minimum 30‐years) for the period 1767–2002. Black contour marks significant trends (p < .05)
3.2. Summer
We identify eight models for simulating EWP s (Table S3). Models show equally good skill for calibration and evaluation periods (Table S3). For the period prior to 1820, EWP s is consistently above the median simulation (Figure 4). Critically, there are fewer stations contributing to EWP prior to 1820 (Wigley et al., 1984). From 1789–1819 the number of stations per region falls to at most two, with occasionally some regions containing no stations and others only one. Prior to 1789, there is only one station per region used to derive EWP (Wigley et al., 1984). Thus, changes in network density may mis‐represent true summer precipitation, with the bias dependent upon whether retained stations preferentially sample wetter or drier regions.
Figure 4.
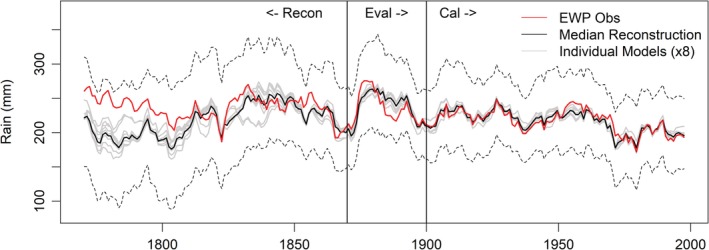
Decadal mean observed and modelled EWPs 1766–2002. Included are median simulations from each of the eight individual models (grey lines) together with the ensemble median (black line). Dashed black lines indicate the upper and lower 95% confidence intervals for reconstructions
Second, many of the early records for key stations (e.g., Oxford, Kew) are composites of several series, often with inconsistent (sometimes unknown) gauge designs and exposures across sites. For example, observations for Oxford prior to 1815 are fragmentary and derived from various London stations and weather diaries, and thus associated with greater uncertainties (Craddock and Craddock, 1977). Similarly, early records for Kew are based on stations from the London area (Wales‐Smith, 1971). Reconstruction of both series for summer shows similar overestimation to that revealed for EWP s reconstructions (Figure 5). The over‐catch evident in the early records of both series is robust to the choice of predictors. It should be noted that R 2 values for the derived Kew and Oxford models are lower than those for the EWP regional series (Table S4).
Figure 5.
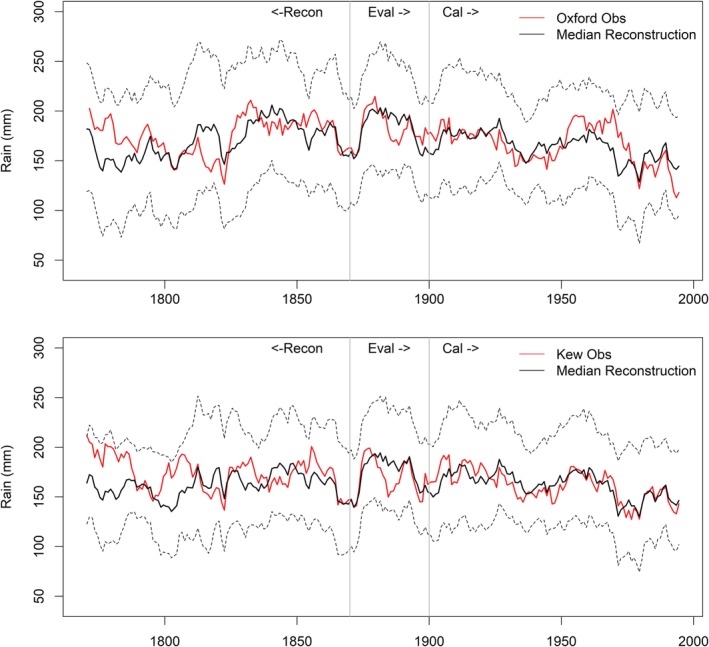
Decadal means for observed and modelled Oxford (top) and Kew (bottom) summer (JJA) precipitation respectively. The median reconstruction is shown by the black line, the observed totals in red. Dashed black lines indicate the upper and lower 95% confidence intervals for reconstructions
Observed EWP s exhibits a significant decreasing trend over the full record analysed (1766–2002) (MKZs: −2.81; p < .05) (Figure 6). This decline is not evident in the median reconstruction (Figure 6). Across all models most simulations (>99%) show weak, non‐significant trends for the full period of analysis (1766–2002), emphasizing the importance of the early series to the derived trend (Figure S5). Significant decreasing trends are evident from reconstructions for tests commencing during the 1800s (Figure 6 & Figure S5), consistent with archival evidence of flood rich summers at that time (Macdonald, 2012). However, significant decreasing trends are only derived from models that use reconstructed SLP. Simulations based on observed SLP (which have been rigorously quality assured) show no such evidence of significant decreasing trends and are more consistent with trends in observed EWP s (Figure S5).
Figure 6.
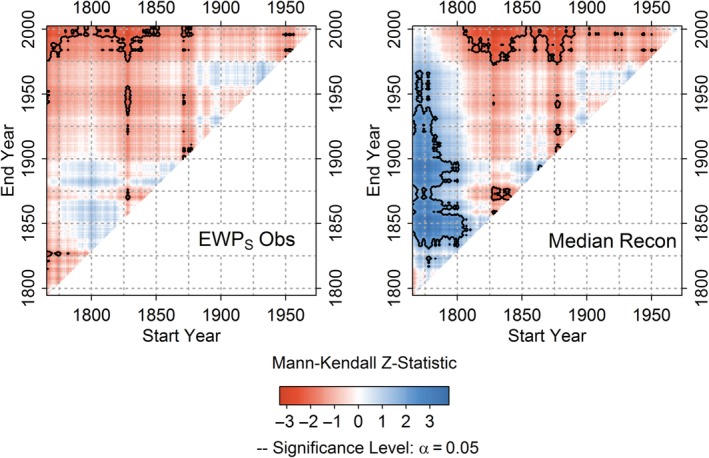
As in Figure 3 but for EWPs and the median model reconstruction
3.3. Spring and autumn
In total seven models were identified for simulating EWP sp and 17 models for EWP au. Regression model results are presented in Tables S5 and S6, respectively. For both seasons, there is good agreement between observations and reconstructions throughout the record (Figure 7). For autumn, however, there is some evidence that observed EWP au is too low during periods of high sleet and snow frequency at the start of the 19th Century, and in the 1770s. While the magnitude of underestimation is considerably less than for EWP w, the London SS series explains up to 20% of the variance in decadal EWP au model residuals for the pre‐1870 reconstruction period. For EWP sp we find no discernible relationship between model residuals and the SS series.
Figure 7.
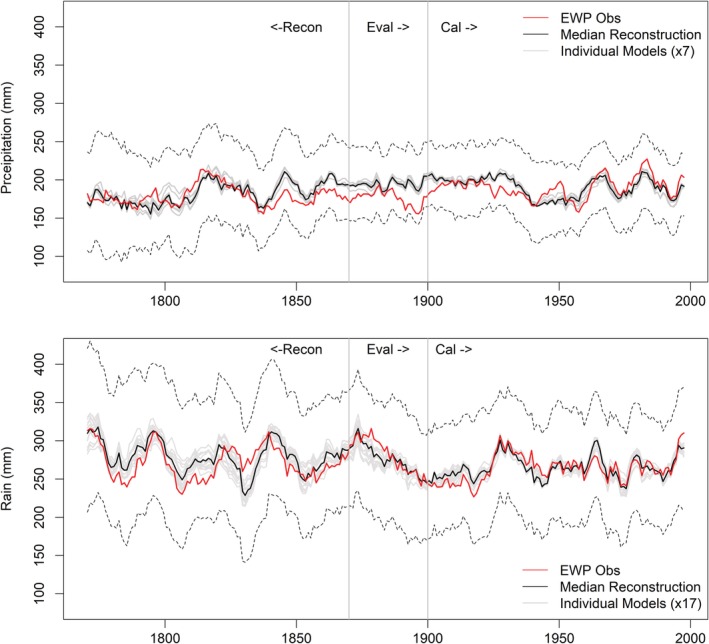
Decadal rolling means for observed and modelled EWP spring (MAM) top and autumn (SON) bottom for years 1766–2002. Included are median simulations from each identified model (grey lines) together with the ensemble median (black line). Dashed black lines indicate the upper and lower 95% confidence intervals for reconstructions
4. CONCLUSIONS
Our analysis reveals significant discrepancies between reconstructed and observed EWP w and EWP s in the pre‐1870 record. For EWP w, the timing of divergence aligns with the introduction of the Snowdon Pattern Rain Gauge (Smith, 1979). We show that the widely accepted trend to wetter winters in observed EWP w is likely an artefact of measurement practice and (probably) higher occurrence of snowfall in early winters. However, rising UK temperatures over the last two centuries (Kendon et al., 2018) have also influenced EWP w by altering the phase of winter precipitation, as evidenced by a significant decreasing trend in the frequency of sleet and snow days. In summer, divergence between observations and reconstructions coincides with a reduction in network density prior to 1820, together with a period of uncertain data in key constituent series at Oxford and Kew. The trend to drier summers in observed EWP s is not robust in our reconstructions with significance depending on start/end year and predictors used in model reconstructions.
There is much potential for further work. The summer findings warrant further research to better understand identified biases. Model reconstructions for spring and autumn are, perhaps surprisingly, relatively consistent with observations throughout the record. While there is some evidence for under‐catch of snow in the early autumn series, we find no such evidence for spring. We suggest that future research further interrogate the autumn and spring record.
Our findings challenge the widely reported trend to wetter winters and drier summers in England and Wales precipitation. Indeed, for winter the biases we identify in EWP are likely to have distorted many other long‐term European precipitation series (e.g., Murphy et al., 2018) and dependent analyses (e.g., Wilby et al., 2016), particularly through the under‐catch of snow. Our findings that pre‐1870 precipitation is likely too low in winter and that pre‐1820 precipitation is likely too high in summer raise issues about the application of early EWP data to historical drought analysis, climate model evaluation and for benchmarking other precipitation and proxy records for these periods. We recommend that such uses of observed EWP restrict application of the winter, autumn and annual series to post 1865 data, and summer to post 1820 data. For earlier periods, we advise use of our model reconstructions. Our work is a reminder of the importance of revisiting the quality of established long‐term records as new evidence and data sets become available.
Supporting information
Appendix S1. Supporting Information.
ACKNOWLEDGEMENTS
We thank Dennis Wheeler for WI data, Martin Charlton and Chris Brunsdon for advice on methods and two anonymous reviewers for their contribution. C.M. was funded by a Science Foundation Ireland Career Development Award (Grant No. SFI/17/CDA/4783).
Murphy C, Wilby RL, Matthews TKR, et al Multi‐century trends to wetter winters and drier summers in the England and Wales precipitation series explained by observational and sampling bias in early records. Int J Climatol. 2020;40:610–619. 10.1002/joc.6208
Funding information Science Foundation Ireland Career Development Award, Grant/Award Number: SFI/17/CDA/4783
REFERENCES
- Alexander, L.V. and Jones, P.D. (2000) Updated precipitation series for the UK and discussion of recent extremes. Atmospheric Science Letters, 1, 142–150. [Google Scholar]
- Allan, R. and Ansell, T. (2006) A new globally complete monthly historical gridded mean sea level pressure dataset (HadSLP2): 1850‐2004. Journal of Climate, 19, 5816–5842. [Google Scholar]
- Baker, L.H. , Shaffrey, L.C. and Scaife, A.A. (2018) Improved seasonal prediction of UK regional precipitation using atmospheric circulation. International Journal of Climatology, 38, e437–e453. [Google Scholar]
- Barriopedro, D. , Gallego, D. , Alvarez‐Castro, M.C. , García‐Herrera, R. , Wheeler, D. , Pena‐Ortiz, C. and Barbosa, S.M. (2014) Witnessing North Atlantic westerlies variability from ships' logbooks (1685‐2008). Climate Dynamics, 43, 939–955. [Google Scholar]
- Beran, M. (2002) On breaking weather records: part 1: the past. Weather, 57, 303–309. [Google Scholar]
- Brázdil, R. , Pfister, C. , Wanner, H. , Von Storch, H. and Luterbacher, J. (2005) Historical climatology in Europe–the state of the art. Climatic Change, 70, 63–430. [Google Scholar]
- Burt, S. (2013) An unsung hero in meteorology: Charles Higman Griffith (1830‐1896). Weather, 68, 135–138. [Google Scholar]
- Burt, T.P. and Howden, N.J.K. (2011) A homogenous daily rainfall record for the Radcliffe Observatory, Oxford, from the 1820s. Water Resources Research, 47, W09701. [Google Scholar]
- Casty, C. , Raible, C.C. , Stocker, T.F. , Wanner, H. and Luterbacher, J. (2007) A European pattern climatology 1766‐2000. Climate Dynamics, 29, 791–805. [Google Scholar]
- Cornes, R.C. , Jones, P.D. , Briffa, K.R. and Osborn, T.J. (2012a) A daily series of mean sea‐level pressure for London, 1692‐2007. International Journal of Climatology, 32, 641–656. [Google Scholar]
- Cornes, R.C. , Jones, P.D. , Briffa, K.R. and Osborn, T.J. (2012b) A daily series of mean sea‐level pressure for Paris, 1670‐2007. International Journal of Climatology, 32, 1135–1150. [Google Scholar]
- Cornes, R.C. , Jones, P.D. , Briffa, K.R. and Osborn, T.J. (2013) Estimates of the North Atlantic oscillation back to 1692 using a Paris‐London westerly index. International Journal of Climatology, 33, 228–248. [Google Scholar]
- Craddock, J.M. (1976) Annual rainfall in England since 1725. Quarterly Journal of the Royal Meteorological Society, 102, 823–840. [Google Scholar]
- Craddock, J.M. and Craddock, E. (1977) Rainfall at Oxford from 1967 to 1814 estimated from the records of Dr Thomas Hornsby and others. Meteorological Magazine, 106, 361–377. [Google Scholar]
- Croxton, P.J. , Huber, K. , Collinson, N. and Sparks, T.H. (2006) How well do the Central England temperature and the England and Wales precipitation series represent the climate of the UK? International Journal of Climatology, 26, 2287–2292. [Google Scholar]
- Dessai, S. and Hulme, M. (2008) How do UK climate scenarios compare with recent observations? Atmospheric Science Letters, 9, 189–195. [Google Scholar]
- García‐Herrera, R. , Können, G.P. , Wheeler, D.A. , Prieto, M.R. , Jones, P.D. and Koek, F.B. (2005) CLIWOC: a climatological database for the World's oceans 1750–1854. Climatic Change, 73, 1–12. [Google Scholar]
- Gregory, J.M. , Jones, P.D. and Wigley, T.M.L. (1991) Precipitation in Britain: an analysis of area‐average data updated to 1989. International Journal of Climatology, 11, 331–345. [Google Scholar]
- Jenkins, G.J. , Perry, M.C. and Prior, M.J. (2008) The Climate of the United Kingdom and Recent Trends. Exeter: Met Office Hadley Centre. [Google Scholar]
- Jones, P.D. and Conway, D. (1997) Precipitation in the British Isles: an analysis of area‐average data updated to 1995. International Journal of Climatology, 17, 427–438. [Google Scholar]
- Jones, P.D. , Conway, D. and Briffa, K.R. (1997) Precipitation Variability and Drought In: Hulme M. and Barrow E. (Eds.) Climate of British Isles: Past, Present and Future. London: Routledge. [Google Scholar]
- Kendall, M.G. (1975) Rank Correlation Methods, 4th edition. London: Charles Griffin. [Google Scholar]
- Kendon, M. , McCarthy, M. , Jevrejeva, S. and Legg, T. (2017) State of the UK Climate 2016. Exeter: Met Office Hadley Centre. [Google Scholar]
- Kendon, M. , McCarthy, M. , Jevrejeva, S. , Matthews, A. and Legg, T. (2018) State of the UK climate 2017. International Journal of Climatology, 38, 1–35. [Google Scholar]
- Küttel, M. , Xoplaki, E. , Gallego, D. , Luterbacher, J. , Garcia‐Herrera, R. , Allan, R. , Barriendos, M. , Jones, P.D. , Wheeler, D. and Wanner, H. (2010) The importance of ship log data: reconstructing North Atlantic, European and Mediterranean Sea level pressure fields back to 1750. Climate Dynamics, 34, 1115–1128. [Google Scholar]
- Luterbacher, J. , Xoplaki, E. , Dietrich, D. , Jones, P.D. , Davies, T.D. , Portis, D. , Gonzalez‐Rouco, J.F. , Von Storch, H. , Gyalistras, D. , Casty, C. and Wanner, H. (2001) Extending North Atlantic oscillation reconstructions back to 1500. Atmospheric Science Letters, 2, 114–124. [Google Scholar]
- Macdonald, N. (2012) Trends in flood seasonality of the river Ouse (northern England) from the archive and instrumental sources since AD1600. Climatic Change, 110, 901–923. [Google Scholar]
- Maisey, P. , Fung, F. , Harris, G. , Lowe, J. , McSweeney, C. , Mitchell, J.F.B. , Murphy, J. , Rostron, J. , Sexton, D. and Yamazaki, K. (2018) UKCP18 Factsheet: Precipitation. Exeter: Met Office Hadley Centre, pp. 1–8. [Google Scholar]
- Manley, G. (1969) Snowfall in Britain over the past 300 years. Weather, 24, 428–437. [Google Scholar]
- Manley, G. (1974) Central England temperatures: monthly means 1698 to 1952. Quarterly Journal of the Royal Meteorological Society, 79, 389–405. [Google Scholar]
- Mann, H.B. (1945) Nonparametric tests against trend. Econometrica, 13, 245–259. [Google Scholar]
- Marsh, T. , Cole, G. and Wilby, R. (2007) Major droughts in England and Wales, 1800‐2006. Weather, 62, 87–93. [Google Scholar]
- Murphy, C. , Broderick, C. , Burt, T.P. , Curley, M. , Duffy, C. , Hall, J. , Harrigan, S. , Matthews, T.K.R. , Macdonald, N. , McCarthy, G. , McCarthy, M.P. , Mullan, D. , Noone, S. , Osborn, T.J. , Ryan, C. , Sweeney, J. , Thorne, P.W. , Walsh, S. and Wilby, R.L. (2018) A 305‐year continuous monthly rainfall series for the Island of Ireland (1711‐2016). Climate of the Past, 14, 413–440. [Google Scholar]
- Noone, S. , Murphy, C. , Coll, J. , Matthews, T. , Mullan, D. , Wilby, R.L. and Walsh, S. (2016) Homogenization and analysis of an expanded long‐term monthly rainfall network for the Island of Ireland (1850‐2010). International Journal of Climatology, 36, 2837–2853. [Google Scholar]
- Osborne, J.W. (2010) Improving your data transformations: applying the box‐cox transformation. Practical Assessment, Research & Evaluation, 15, 1–9. [Google Scholar]
- Parker, D.E. , Legg, T.P. and Folland, C.K. (1992) A new daily Central England temperature series, 1772‐1991. International Journal of Climatology, 12, 317–342. [Google Scholar]
- Pauling, A. , Luterbacher, J. , Casty, C. and Wanner, H. (2006) Five hundred years of gridded high‐resolution precipitation reconstructions over Europe and the connection to large‐scale circulation. Climate Dynamics, 26, 387–405. [Google Scholar]
- Rinne, K.T. , Loader, N.J. , Switsur, V.R. and Waterhouse, J.S. (2013) 400‐year may‐august precipitation reconstruction for southern England using oxygen isotopes in tree rings. Quaternary Science Reviews, 60, 13–25. [Google Scholar]
- Simpson, I.R. and Jones, P.D. (2014) Analysis of UK precipitation extremes derived from Met office gridded data. International Journal of Climatology, 34, 2438–2449. [Google Scholar]
- Smith, C.G. (1979) The cold winters of 1767‐68, 1776 and 1814, as observed at Oxford. Weather, 34, 346–358. [Google Scholar]
- Symons, G.J. (1891) A contribution to the history of rain gauges. Quarterly Journal of the Royal Meteorological Society, 17, 127–142. [Google Scholar]
- Wales‐Smith, B.G. (1971) Monthly and annual totals of rainfall representative of Kew, Surrey, from 1697 to 1970. Meteorological Magazine, 100, 345–360. [Google Scholar]
- Walker, M. (2010) The man behind the British Rainfall Organisation. Weather, 65, 117–120. [Google Scholar]
- Wheeler, D. , Garcıa‐Herrera, R. , Wilkinson, C.W. and Ward, C. (2010) Atmospheric circulation and storminess derived from Royal Navy logbooks: 1685 to 1750. Climatic Change, 101, 257–280. [Google Scholar]
- Wigley, T.M.L. and Jones, P.D. (1987) England and Wales precipitation: a discussion of recent changes in ariability and an update to 1985. International Journal of Climatology, 7, 231–246. [Google Scholar]
- Wigley, T.M.L. , Lough, J.M. and Jones, P.D. (1984) Spatial patterns of precipitation in England and Wales and a revised, homogeneous England and Wales precipitation series. International Journal of Climatology, 4, 1–25. [Google Scholar]
- Wilby, R.L. , Noone, S. , Murphy, C. , Matthews, T. , Harrigan, S. and Broderick, C. (2016) An evaluation of persistent meteorological drought using a homogeneous Island of Ireland precipitation network. International Journal of Climatology, 36, 2854–2865. [Google Scholar]
- Worley, S.J. , Woodruff, S.D. , Reynolds, R.W. , Lubker, S.J. and Lott, N. (2005) ICOADS release 2.1 data and products. International Journal of Climatology, 25, 823–842. [Google Scholar]
Associated Data
This section collects any data citations, data availability statements, or supplementary materials included in this article.
Supplementary Materials
Appendix S1. Supporting Information.


