

Abstract
Models of the neural basis of arithmetic argue that left inferior frontal cortex is involved in cognitive control of verbal representations of math facts in left lateral temporal cortex, whereas bilateral intra-parietal cortex is involved in numerical calculation. Lower levels of math competence for multiplications is associated with greater effortful retrieval because of less robust verbal representations and the engagement of numerical operations as a back-up strategy. Previous studies on multiplication have focused on brain activation in isolated nodes of the network, so we do not know how functional connectivity between these nodes is related to competence. Moreover, previous studies have not employed longitudinal designs, so we do not know how changes in multiplication performance over time is related to changes in its neural basis. The objective of this study was to investigate how changes in multiplication task performance is associated with changes in functional connectivity of temporal cortex with frontal and parietal cortices. Longitudinal data was collected from 45 children, with an average 2.2-year interval between the two sessions, when they were about 11 years old at time 1 (T1) and 13 years old at time 2 (T2). A Psychophysiological Interaction (PPI) analysis was carried out by defining the seed in the temporal cortex (i.e. posterior superior and middle temporal gyri) and examining changes in connectivity with frontal cortex (i.e. left inferior frontal gyrus) as well as parietal cortex (i.e. left and right inferior and superior parietal lobules). We found that children who did not improve in a multiplication task showed greater levels of functional connectivity of left temporal cortex with left inferior frontal gyrus (IFG) and left intraparietal sulcus (IPS) at T2, as compared to their peers who improved. The cluster showing greater levels of connectivity in the left IFG at T2 for the Non-improvers overlapped a cluster independently identified by a verbal localizer task and the cluster showing greater levels of connectivity in the left IPS Non-improvers overlapped a cluster independently identified by a numerosity localizer task. These results suggest that lack of improvement in multiplications are associated with greater cognitive control of verbal representations and greater engagement of numerical operations.
Keywords: Functional connectivity, Improvement, Longitudinal, Multiplication, fMRI, PPI
1. Introduction
Mathematical proficiency is required for a workforce well trained in science, technology and engineering disciplines. Recent studies have shown that math ability at age 7 predicted socioeconomic status (SES) at age 42, beyond the effects of SES at birth (Ritchie and Bates, 2013) and that students showing increases in their math scores during high school had higher earnings 7 years after high school as compared to those who did not improve as much (Rose, 2006). Although previous behavioral studies have shown that elementary school children significantly improve arithmetic proficiency (e.g. De Brauwer and Fias, 2009), little is known about the changes in the brain that support that improvement. One of the milestones in elementary school math is to learn and become fluent in retrieving multiplication tables. Although multiplications are initially introduced as repeated additions, very soon teachers start to encourage their students to learn arithmetic facts by rote, by repeatedly reciting multiplication tables (Dehaene, 1992). After consistent practice, children attain a level of mastery that enables them to retrieve the solution directly from long-term memory. Gaining this automaticity is important because it allows children to free up their working memory, so they can invest those cognitive resources in the acquisition of new and more advanced math concepts (Geary, 1994). This shift towards retrieval is a hallmark of children’s cognitive development (e.g. Geary et al., 1991) and a building block of more advanced mathematical competence. According to the triple-code model of number processing in the adult brain, multiplication task solving engages verbal representations associated with left perisylvian language areas, including the superior and middle temporal gyri (STG and MTG, respectively), the angular gyrus (AG), as well as the left inferior frontal gyrus (IFG) (Dehaene et al., 2003; Klein et al., 2016). The left temporo-parietal areas are considered to house the verbal representations of math facts and it is generally believed that those facts are represented as phonological codes (Dehaene et al., 2003).
Several functional magnetic resonance imaging (fMRI) studies have found greater left MTG/STG activations for multiplication problems (Arsalidou and Taylor, 2011), when compared to control conditions (Jost et al., 2009), additions (e.g. Zhou et al., 2007) and subtractions (Andres et al., 2011; Prado et al., 2011). Studies have also shown greater activation for multiplication problems in left MTG/STG for trained vs. untrained problems (Bloechle et al., 2016) and for adults with higher math competence (Grabner et al., 2007). In contrast to the MTG/STG, the left IFG is associated with cognitive control (Badre and Wagner, 2007). Previous studies have interpreted its activation in math cognition as showing the cognitive control invested in the retrieval and selection of multiplication solutions from long-term memory (Prado et al., 2011). Greater left IFG activation has been reported for hard multiplication problems as compared to easy ones (Prado et al., 2011) and for multiplication problems as compared to control conditions (Kawashima et al., 2004). Other studies have shown that frontal areas are activated when children solve two-digit multiplications as compared to single-digit ones, suggesting more effortful processing in the former (Soltanlou et al., 2017).
Fact retrieval is not the only strategy used for solving simple multiplications. Evidence from self-report studies has shown that other backup strategies, including repeated addition, number series generation and derived facts are used when retrieval fails (LeFevre et al., 1996a, 1996b; Lemaire et al., 1991). Arsalidou and Taylor (2011)’s meta-analysis showed that parietal areas such as the bilateral inferior parietal lobules (IPL) and superior parietal lobules (SPL) also show activation for multiplications (e.g. Soltanlou et al., 2017). The intraparietal sulcus (IPS), in between the IPL and SPL, is considered to store the semantic representation of numerical magnitude (Dehaene et al., 2003). The involvement of these parietal regions may reflect the use of backup strategies, taking additional steps after the solution of an easier multiplication fact has been retrieved from memory (i.e. given 8 + 9 → retrieve 9 × 9 = 81 and then subtract 9 (81−9 = 72), a strategy known as derived facts), when direct retrieval of the solution fails. However, relying on these numerical operations to solve arithmetic problems has been associated with lower levels of math competence, with evidence reporting that children with low arithmetic fluency have greater activation of the right IPS as compared to their higher math fluency peers when solving an arithmetic task (De Smedt et al., 2011). Other researchers have investigated whether there is a change from reliance on numerical operations to verbal representations by training adults to solve complex multiplication problems. Because complex multiplication problems (e.g. 25 × 9) were learned, participants initially use numerical operations, but with training they are more likely to retrieve the solution directly from memory. Altogether, findings from studies with adults suggest that a more robust storage of arithmetic facts in long-term memory is associated with greater activation of temporal areas (i.e. left MTG) and with less activation of cognitive control (i.e. IFG) and numerical operations brain areas (i.e. IPS) (Bloechle et al., 2016; Delazer et al., 2005; Ischebeck et al., 2006; Zamarian et al., 2009a).
Findings from adult studies reflect the end product of maturation and experience, which is not necessarily generalizable to children (Ansari, 2010). Prado et al. (2014) were the first to use a cross-sectional approach to study multiplications and found increases of activity in the left MTG and decreases of activity in the left IFG from 2nd to 7th grade, especially for easy problems (Prado et al., 2014). They interpreted these findings as showing that the strength of the association between multiplication problems and their solutions (i.e. left MTG) increases with years of math instruction and probably as a consequence, the cognitive control needed to retrieve that solution from long-term memory is reduced (i.e. left IFG). These findings were in line with another cross-sectional study showing age-related increases in verbal-related temporo-parietal brain areas and decreases in prefrontal cortex areas when participants solved an addition and subtraction verification task (Rivera et al., 2005).
Given that cross-sectional studies include children from different ages, large individual variability is a concern, so these studies might fail to detect or falsely suggest changes over time (Casey et al., 2005), therefore, the use of longitudinal studies for examining math skill development is recommended (Menon, 2015; Karmiloff-smith, 2010). Using a longitudinal design and functional near-infrared spectroscopy (fNIRS), Artemenko and colleagues reported increased activation in AG and MTG in adolescents from 6th to 7th grade (Artemenko et al., 2018), suggesting higher quality arithmetic representations. Another recently published study used simultaneous fNIRS and electroencephalography (EEG) to investigate the brain changes associated with multiplication training. They found that children solved trained multiplications faster and with fewer errors after two weeks of training and that this behavioral improvement was accompanied by a reduced activation in right middle frontal gyrus, suggesting that the processing of those problems became less demanding and effortful after training (Soltanlou et al., 2018).
Another limitation of the majority of fMRI studies in math cognition is that they study isolated brain areas. Recent studies have suggested that the understanding of how the human brain produces cognition ultimately depends on knowledge of large-scale brain organization, highlighting the importance of studying connectivity between brain regions (Bressler and Menon, 2010). Although several studies have used connectivity analysis to study mathematical processing (for a review see Moeller et al., 2015), only one has focused on multiplication (see Krueger et al, 2011). To the best of our knowledge, no previous study has demonstrated that longitudinal changes in brain connectivity are associated with improvement in multiplication performance.
In the current study, children solved a single-digit multiplication verification task inside the scanner when they were approximately 11 years old and once again an average of 2.2 years later. Longitudinal behavioral studies have shown that even in 4th grade (i.e. 9–10 years old) most children take a relatively long time to answer to multiplication problems, suggesting that they are using numerical operations rather than verbal retrieval (Jordan et al., 2009) and that both mechanisms remain available over development into adulthood (LeFevre et al., 1996a, 1996b). Because of this evidence, we expected that by studying 11-year-old children we would be able to catch an interesting stage of math development where kids use a mixture of mechanisms that is reflected in between subject variability in response times and therefore the underlying neural correlates.
Although some studies have found multiplication-related effects in the AG (e.g. Grabner et al., 2007), other studies have not (e.g. Soltanlou et al., 2017), questioning whether this area is involved in the storage of multiplication facts. Moreover, the differences in AG reported by previous studies have mainly been due to deactivation instead of activation. Given that this area is a key node of the default mode network (Andrews-Hanna et al., 2014) it has been argued that different levels of AG deactivation might simply reflect domain-general alterations resulting from differences in task difficulty (Wu et al., 2009). While some training studies have found reduced deactivation in the AG when comparing trained with untrained multiplications in the post-training session (e.g. Zamarian et al., 2009b), more recent studies comparing trained problems before and after training have found no involvement of AG neither in adults (Bloechle et al., 2016) nor in children (Soltanlou et al., 2018). In contrast, the posterior left MTG/STG is activated for multiplications across fMRI studies in a meta-analysis (Arsalidou and Taylor, 2011), for small multiplication problems as compared to baseline (Jost et al., 2009), for multiplications as compared to subtractions (Andres et al., 2011), for multiplications as compared to additions (Zhou et al., 2007). This region has also shown grade-related increases in activation (Prado et al., 2014) and greater activation for adults with higher levels of math competence in multiplication (Grabner et al., 2007).
In the current study, we used psycho-physiological interaction (PPI) analysis (Friston et al., 1997) to examine whether behavioral improvement in solving multiplications inside the scanner was correlated with changes in functional connectivity of a seed region in the posterior left MTG/STG with anatomically defined frontal (i.e. left IFG) and parietal (i.e. left and right IPL/SPL) cortices. More specifically, we aimed to answer these questions: 1) Is the change over time in connectivity of left MTG/STG with left IFG associated with improvement in multiplication task performance? Based on previous evidence (Prado et al., 2014), we expected that longitudinal improvement would be associated with decreases in functional connectivity between temporal and frontal areas, suggesting efficient retrieval of the solution from long-term memory. 2) Is the change over time in connectivity of left MTG/STG with bilateral IPL/SPL associated with improvement in multiplication task performance? We expected that lack of improvement would be associated with reliance on inefficient numerical operations as a backup strategy, showing increases in functional connectivity of temporal with parietal cortices.
2. Materials and methods
2.1. Participants
2.1.1. Whole sample
Sixty-five children were recruited from schools in the Chicago metropolitan area to participate in the study.1 All participants were native English speakers, were right-handed, were free of past and present neurological or psychiatric disorders and had no history of attention deficits or oral language deficits, according to parental report. Participants had no history of intellectual deficits, all of them scoring above 80 standard score (SS) on intelligence as measured with the Wechsler Abbreviated Scale of Intelligence – WASI (Weschler, 1999). Reading deficits were ruled out by including in the study those participants who scored above 80 SS on the average of the Word Attack and Word Identification subtests of the Woodcock-Johnson III Test of Achievement (WJ-III; Woodcock et al., 2001). In order to have relatively wide variability of math skill in our sample, all participants scoring above 70 standard scores (SS) in the Math Fluency subtest of the WJ-III (Woodcock et al., 2001) were included in the study.
Data from five participants were excluded because of excessive movement in the scanner, that is, more than 10% of the total volumes replaced (i.e. 11 vol) or more than five consecutive volumes replaced in a single run. ArtRepair was used to identify volumes with significant artifacts (see fMRi data analysis section for more details). Ten additional participants were excluded due to low behavioral performance in solving the multiplication task inside the scanner. Low behavioral performance was defined as accuracy being below 50% in easy or hard problems either at Time 1 or at Time 2. Given that the verbal and numerosity tasks were just used for localization purposes, we applied a more lenient threshold, with performance being considered low if accuracy was below 40% on the average of all the experimental conditions.
Five additional participants had to be excluded for the following reasons: 1) Being left-handed (n = 1). 2) Problem with the stimulus presentation program (Eprime error) at Time 1 (n = 2). 3) Not responding to the control condition (i.e. blue box) in the multiplication task (n = 1). 4) Showing a clear “Yes” response bias when solving the hard multiplication problems, namely, showing an accuracy level of 92% when the problem required pressing the “yes” button (i.e. hard problems with correct proposed solution) and only 8% of accuracy when the problem required pressing the “no” button (i.e. hard problems with incorrect proposed solution; n = 1).
The final sample for the multiplication analysis consisted of 45 participants. Participants were scanned twice, sessions being an average of 2.2 years from one another. As shown in Table 1, children were approximately 11 years old at T1 and approximately 13 years old at T2.2
Table 1.
Sample information. Means and standard deviations for age, time between sessions, and scores on standardized tests as well as number of females for the whole sample and for the two groups created based on the measure of longitudinal improvement in multiplication task performance (i.e. trimmed means of RTs).
| Whole sample | Improvers | Non-improvers | |
|---|---|---|---|
| Number of females | 26 | 14 | 12 |
| Age at T1 (a) | 11.3 (0.4) | 11.4 (1.5) | 11.3 (1.4) |
| Age at T2 (a) | 13.5 (1.5) | 13.5 (1.6) | 13.6 (1.5) |
| Time between sessions(a) | 2.2 (0.21 | 2.1 (0.2) | 2.2 (0.3) |
| Reading ability at T1 | 107.0 (10.5) | 106.4 (11.5) | 107.6 (9.6) |
| Math Fluency at T1 | 97.0 (16.4) | 99.7 (18.0) | 96.2 (14.7) |
| Math Fluency at T2 | 94.6 (16.8) | 97.3 (19.4) | 92.0 (13.6) |
| CMAT multiplication T1 | 10.9 (3.9) | 11.5 (4.0) | 10.2 (3.8) |
| CMAT multiplication T2 | 9.1 (3.8) | 10.0 (4.0) | 8.2 (3.9) |
| Verbal IQ at T1 | 112.2 (15.6) | 113.4 (16.7) | 110.9 (14.7) |
| Visuo-spatial IQ at T1 | 108.8 (16.0) | 110.9 (15.4) | 106.6 (16.6) |
| Full IQ at T1 | 111.6 (16.0) | 113.3 (16.4) | 109.8 (15.7) |
| Verbal WM at T1 (b) | 103.4 (14.1) | 103.8 (14.7) | 103.1 (13.8) |
| Visuo-spatial WM at T1 (b) | 104.9 (13.8) | 106.8 (14.5) | 103.1 (13.3) |
Note.
in years;
Based on n = 42 because of three participants having missing WM data. CMAT: Comprehensive Mathematical Abilities Test (CMAT; Hresko et al., 2003); WM: Working memory; Improvers: Group of 23 children showing greater improvement in RTs over time when solving hard multiplication problems; Non-improvers: Group of 22 children showing no change in RTs over time when solving hard multiplication problems.
2.1.2. Improvement groups
Previous evidence has suggested that the use of numerical operation strategies is more frequent for solving hard problems (LeFevre et al., 1996a, 1996b), whereas easy ones are mostly solved by retrieval of the solution from long-term memory. For this reason, change in response times to correctly solved hard single-digit multiplication problems was chosen as the measure of improvement. In addition, we expected the RTs to give us more reliable information about strategy use in children, with faster RTs indicating retrieval and longer RTs indicating reliance on numerical operations (Robert S Siegler, 1988). Several behavioral (e.g. De Brauwer and Fias, 2009) and fMRI studies have used RTs to study differences in math competence (e.g. Grabner et al., 2007) or longitudinal changes in performance (e.g. Qin et al., 2014).
In order to plot the changes in functional connectivity found to be associated with multiplication improvement, two groups were created based on the median-split of the change over time (T2-T1) in RTs for hard multiplication problems. The use of the median-split is due to the fact that we found a continuum in the distribution of the change in response times, and not two clearly separated groups. Those children who became faster over time in solving hard multiplication problems were classified as improvers and those who did not show changes over time as Non-improvers. More detailed information about changes in performance for each group is shown in the Behavioral Results section (See Table 2).
Table 2.
Performance on the task solved inside the scanner. Mean response time (RT) and accuracy (%) at Time 1 (T1), Time 2 (T2) and change over time (T2-T1) for the whole sample and for the improvers versus Non-improvers created to study longitudinal changes in multiplication task performance over time (standard deviation in parentheses).
| Whole sample | Improvers | Non-Improvers | ||
|---|---|---|---|---|
| % | T1 | 72.4 (14.7) | 75.2 (14.9) | 69.5 (14.2) |
| T2 | 77.0 (14.0) | 78.2 (15.0) | 75.7 (13.1) | |
| T2-T1 | .4.54 (12.8) | 2.9 (14.4) | 6.2 (11.0) | |
| RT | T1 | 1263 (382) | 1351 (388) | 1170 (362) |
| T2 | 1098 (400) | 944 (343) | 1259 (399) | |
| T2-T1 | −165 (318) | −407 (163) | 88 (229) |
Note. %: Mean correct responses; RT: trimmed means for correctly solved trials; improvers: Group of 23 children showing improvement in RTs over time; Non-improvers: Group of 22 children showing no change in RTs over time.
The two groups did not differ in sex distribution (x2 = 0.18, p = .67), age at T1 (t(43) = 0.12, p = .90), age at T2 (t(43) = 0.11, p = .91), time between sessions (t(43) = 1.31, p = .19), reading ability (t(43) = 0.36, p = .72), math fluency at T1 (t(43) = 0.69, p = .49) or T2 (t(43) = 1.06, p = .29), CMAT multiplication ability at T1 (t(43) = 1.07, p = .29) or T2 (t(43) = 1.45, p = .15),3 verbal IQ (t(43) = 0.53, p = .60), visuo-spatial IQ (t(43) = 0.88, p = .38), full IQ (t(43) = 0.74, p = .47), verbal WM (t(404) = 0.17, p = .87), or visuospatial WM (t(40) = 0.88, p = .38). More detailed information about the tests used to measure those abilities is given on Section 2.2. Table 1 shows more detailed information about the whole sample and the two groups.
Written consent was obtained from the children and their parents or guardians. All experimental procedures were approved by the Institutional Review Board at Northwestern University and participants were compensated $20 per hour for their time.
2.2. Standardized measures
2.2.1. Variable of interest
Longitudinal improvement in multiplication was measured by calculating changes in RTs over time for correctly solved trials when solving hard multiplication problems inside the scanner (i.e. both true and false; see page 11 for an explanation of the conditions). Given that we wanted to make sure that we control for the possible effect of outliers in RTs, we calculated trimmed means of RTs for correctly solved trials for each participant at each time point and then calculated the change in those measures over time (T2 – T1). Trimmed means where calculated for every participant at each time point after excluding trials with RTs above or below 3 SD from the individuals’ mean. As for T1, this trimming resulted in excluding 1 trial in 17 participants and 2 trials in 3 participants. As for T2, the trimming resulted in excluding 1 trial in 26 participants, 2 trials in 5 participants, and 3 trials in 1 participant.
2.2.2. Additional measures of math ability
In order to explore whether our findings were generalizable beyond the specific demands of the experimental task solved inside the scanner, we assessed multiplication ability by administering the multiplication subtest of the Comprehensive Mathematical Abilities Test (CMAT; Hresko et al., 2003). This is an untimed test including a wide range of multiplication problems, from very simple ones, presenting multiplication problems in non-symbolic format, up to more difficult ones including the multiplication of 4- × 3-digit numbers (e.g. 5764 × 678) and the multiplication of fractions. Participants completed the CMAT both at T1 and at T2, in a paper-and-pencil format.
2.2.3. Control measures
Reading skill was measured as the average of standardized scores on the Word Attack and the Word Identification subtest from the Woodcock-Johnson III Test of Achievement (WJ-III; Woodcock et al., 2001) at T1. The Word Attack requires reading phonically regular nonsense words, while the Word Identification test requires reading isolated letters and real words.
Verbal WM was measured by the Listening Recall subtests of the Automated Working Memory Assessment (AWMA; Alloway et al., 2007). This subtest involves simultaneous storage and processing of verbal information. It requires children to decide whether a sentence is true or false and also to remember the final word of the sentence. Thus, children are asked to store the final word of the sentence, as they process new sentences and decide whether they were true or false. The number of sentences per item increases as children proceed through the test. The item is scored as correct if children recall the correct word or words in the correct order.
Both performance and verbal IQ were measured with the Wechsler Abbreviated Scale of Intelligence – WASI (Weschler, 1999). Performance IQ was measured with Block Design and Matrix Reasoning subtests of the WASI. The Block Design subtest requires the participants to use red-and-white blocks to re-create the model design shown by the examiner, within a specified time limit. In the Matrix Reasoning subtest, the examinee views an incomplete matrix or series and selects the response option that completes the matrix or series. Verbal IQ was measured with the Vocabulary and Similarities subtests of the WASI. In the Vocabulary subtest, the participant has to define words, while in the Similarities subtest the participants are presented two words that represent common objects or concepts and they have to describe how they are similar.
2.3. Tasks
Participants performed three tasks inside the scanner: two localizer tasks and the experimental task. The localizers consisted of a verbal task and a numerosity task (Fig. 1A). The experimental task consisted of a single-digit multiplications task (Fig. 1B), which included both easy and hard problems. For all the tasks, the control condition consisted of a blue square that was presented for the same time as the stimuli in the experimental conditions and participants were asked to press the response button with their index finger when it turned red (Fig. 1C).
Fig. 1.
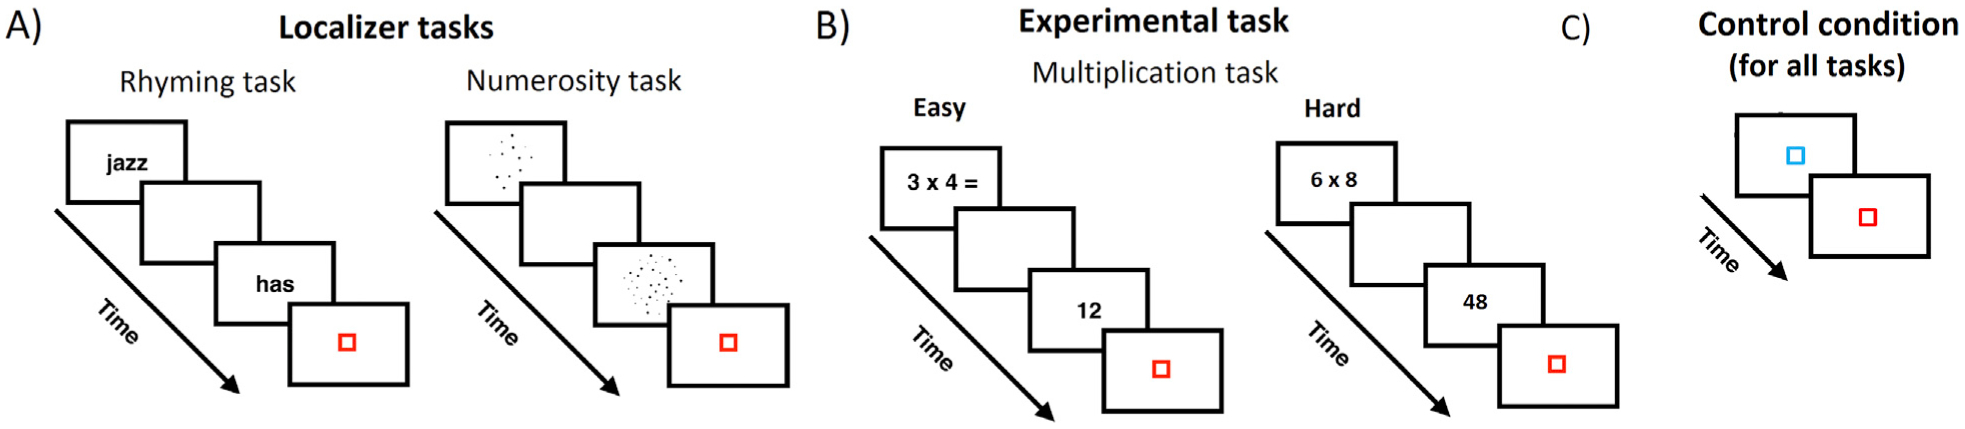
Experimental tasks solved inside the scanner. (A) Localizer tasks. In the verbal task, participants responded whether pairs of words rhymed or not. In the numerosity task, participants decided which of the two sets had more dots. (B) Experimental task. Single-digit multiplication task in which participants had to respond whether the proposed solution was correct or incorrect. (C) Control condition common to all tasks, consisting of a blue square that turned red.
2.3.1. Multiplication
Participants were presented with two runs of a single-digit multiplication verification task. Each run comprised 12 easy problems (i.e. both operands being smaller or equal to 5) and 12 hard problems (i.e. both operands being larger than 5). The proposed solution could be correct (i.e. true) or incorrect (i.e. false). False solutions were the result of multiplying the first operand plus or minus 1 and the second operand (e.g. 5 × 3 = 12 or 18, which are the solutions for 4 × 3 and 6 × 3, respectively). Problems involving 0 or 1 and ties (e.g., 3 × 3) were not included in the main experiment but were used in the practice session.
Each run consisted of 36 problems: 12 easy problems with correct solutions, 12 hard problems with correct solutions, 6 easy problems with false solutions and 6 hard problems with false solutions5 (total of 72 problems for the two runs). Participants’ task was to decide, by means of button press, whether the proposed solution was correct or incorrect. Twenty-four trials of the control condition were used in this task (Fig. 1C). The duration of each run was approximately 4 min. Twelve true problems and twelve false problems were included in the practice session. Different sets of stimuli were used in the practice and in the scanning sessions.
2.3.2. Verbal localizer task
Two monosyllabic English words were sequentially presented in written format and participants’ task was to decide whether the words rhymed or not. To ensure that judgments were not based solely on orthographic similarities between words, orthography and phonology were manipulated independently. That is, the two words could have similar orthography and similar phonology (e.g., dime–lime), similar orthography but different phonology (e.g., pint–mint), different orthography but similar phonology (e.g., jazz–has) or different orthography and different phonology (e.g., press–list) (12 trials per condition). We also included a perceptual control condition in which two symbol strings were presented on the screen instead of words and participants’ task was to determine whether the symbol strings matched or not (they matched in half of the trials). Twelve trials of each condition were presented in the practice session. Different sets of stimuli were used in the practice and in the scanning sessions. Participants were administered with one run of this task, with a duration of approximately 7 min. Twenty-four trials of the control condition were used in this task (Fig. 1C).
2.3.3. Numerosity localizer task
Two dot arrays were sequentially presented and participants’ task was to decide which of them had the larger number of dots. The task comprised 24 easy (comparing 12 vs. 36 dots; ratio 0.33), 24 medium (comparing 18 vs. 36 dots; ratio 0.50) and 24 hard (comparing 24 vs. 36 dots; ratio 0.66) trials. The first dot array was composed of the larger number of dots in half of the trials, while it was composed of the smaller number of dots in the other half. To ensure that participants’ judgments were based on differences in numerosity rather than cumulative surface area, the distribution of dot sizes was biased towards smaller dots in large arrays and bigger dots in small arrays. However, equating the cumulative surface area between small and large arrays by biasing the distribution of single dot sizes would have made it possible for the subjects to use single dot sizes as a cue for their judgments. Therefore, we found a trade-off between equating as much as possible (1) the cumulative surface areas and (2) the distributions of single dot sizes in each pair. Twelve trials of each condition were presented in the practice session. Different stimuli were used in the practice and in the scanning sessions. Twenty-four trials of the control condition were used in this task (Fig. 1C).
2.4. Experimental protocol
Subjects participated in a practice session after informed consent was obtained and standardized tests were administered. During this session, they practiced all trials and learned to minimize head movement in a mock fMRI scanner. The actual scanning session took place within a week of the practice session. In the fMRI scanner, participants performed two runs of the multiplication task, two runs of the numerosity task and one run of the verbal task. Stimuli were projected onto a screen that was viewed by the participants through a mirror attached to the head-coil. The order of the tasks was counterbalanced across participants. The timing and order of trial presentation within each run was optimized for estimation efficiency using optseq2 (http://surfer.nmr.mgh.harvard. edu/optseq/). Behavioral responses were recorded using an MR-compatible keypad and participants responded with their right hand. In the multiplication task, participants responded with their index finger if the proposed solution was correct and with the middle finger if the proposed solution was incorrect. As for the verbal task, participants responded with their index finger if the words rhymed and with the middle finger if the words did not rhyme. Finally, for the numerosity task the participants responded with their index finger if the first array of dots was composed of more dots and with the middle finger if the second array of dots was composed of more dots.
2.5. Stimulus timing
Stimulus timing was identical in all tasks. A trial started with the presentation of a first stimulus (i.e. multiplication problem, first word, or first set of dots depending on the task) for 800 ms, followed by a blank screen for 200 ms. A second stimulus (i.e. multiplication proposed solution, second word, or second set of dots depending on the task) was then presented for 800 ms, followed by a red fixation square for 200 ms. Variable periods of fixation (ranging from 2600 ms to 3400 ms; 400 ms jitter) were added after each trial in order to help with deconvolution, during which the red square was presented. Furthermore, each run ended with 22 s of passive visual fixation.
2.6. fMRI data acquisition
Images were collected using a Siemens 3T TIM Trio MRI scanner (Siemens Healthcare, Erlangen, Germany) at CAMRI, Northwestern University’s Center for Advanced MRI. The fMRI blood oxygenation level dependent (BOLD) signal was measured with a susceptibility weighted single-shot echo planar imaging (EPI) sequence. The following parameters were used: TE = 20ms, flip angle = 80s, matrix size = 128 × 120, field of view = 220 × 206.25 mm, slice thickness = 3 mm (0.48 mm gap), number of slices = 32, TR = 2000 ms. Before functional image acquisition, a high resolution T1 weighted 3D structural image was acquired for each subject, with the following parameters: TR = 2300 ms, TE = 3.36 ms, matrix size = 256 × 256, field of view = 240 mm, slice thickness = 1 mm, number of slices = 160.
2.7. fMRI data analysis
2.7.1. Preprocessing
Data analysis was performed using SPM8 (www.fil.ion.ucl.ac.uk/spm). The first six images of each run were discarded to allow for T1 equilibration effects. The remaining functional images were corrected for slice acquisition delays, realigned to the first image of the first run to correct for head movements, and spatially smoothed with a Gaussian filter equal to twice the voxel size (4 × 4 × 8 mm3 full width at half maximum). Prior normalizing images with SPM8, we used ArtRepair (Mazaika, Hoeft, Glover and Reiss, 2009; http://cibsr.standford.edu/tools/ArtRepair/ArtRepair.htm) to suppress residual fluctuations due to large head motion and to identify volumes with significant artifact and outliers relative to the global mean signal (4% from the global mean). Volumes showing rapid scan-to-scan movements of greater than 1.5 mm were excluded via interpolation of the 2 nearest non-repaired volumes. All participants had less than 10% of the total number of volumes replaced in a single run and less than 5 vol replaced in a row. Interpolated volumes were then partially deweighted when first-level models were calculated on the repaired images (Mazaika et al., 2007). Functional volumes were co-registered with the segmented anatomical image and normalized to the standard T1 Montreal Neurological Institute (MNI) template volume (normalized voxel size, 2 × 2 × 4 mm3).
2.7.2. fMRI processing
Event-related statistical analysis was performed according to the General Linear Model. Activation was modeled as epochs with onsets time-locked to the presentation of the first stimulus in each trial (i.e. multiplication problem, first word of the verbal task and first set of dots). In order to equate for power in the analysis, all children’s responses (i.e. correct and incorrect) were included in the model. All epochs were convolved with a canonical hemodynamic response function. The time series data were high-pass filtered (1/128 Hz), and serial correlations were corrected using an autoregressive AR model.
2.7.3. Psychophysiological Interaction analysis
Functional connectivity analysis was carried out using Psychophysiological Interaction (PPI) analysis as implemented in SPM 8. Functional connectivity is the ‘temporal correlation between spatially remote neurophysiological events’ (Friston, 1994). PPI explains variation in brain activity by the interplay of two factors: the input of a selected seed region (the physiological variable) and a cognitive process as defined by a contrast (the psychological variable) (Gitelman et al., 2003). Consequently, PPI analysis identifies voxels whose activity varies with a specified seed region as a function of an experimental context without assuming a direction of influence (Friston et al., 1997). To perform the PPI analysis, the deconvolved time series for the seed region was extracted from the normalized data for each participant. The physiological variable, the psychological variable, and their interaction were calculated in the GLM model as regressors for each participant. A PPI term was created as a measure of the strength of the connectivity between the two regions.
The seed was individually defined as the 50 voxels showing maximal activation for the contrast hard multiplication problems as compared to the control condition at T1 within the posterior left MTG/STG gyri (i.e. posterior to Y = −25, aal template). The choice of this anatomical mask was also based on previous findings from our lab showing brain activation in this area for the multiplication task both for adults (Prado et al., 2011, 2013) and for children (Berteletti et al., 2014a, 2014b; Demir et al., 2015; Prado et al., 2014). Fig. 2 shows the anatomical posterior MTG/STG where the maximum activation was extracted from for every single participant (A) and the overlap found for seed distribution across participants (B).
Fig. 2.
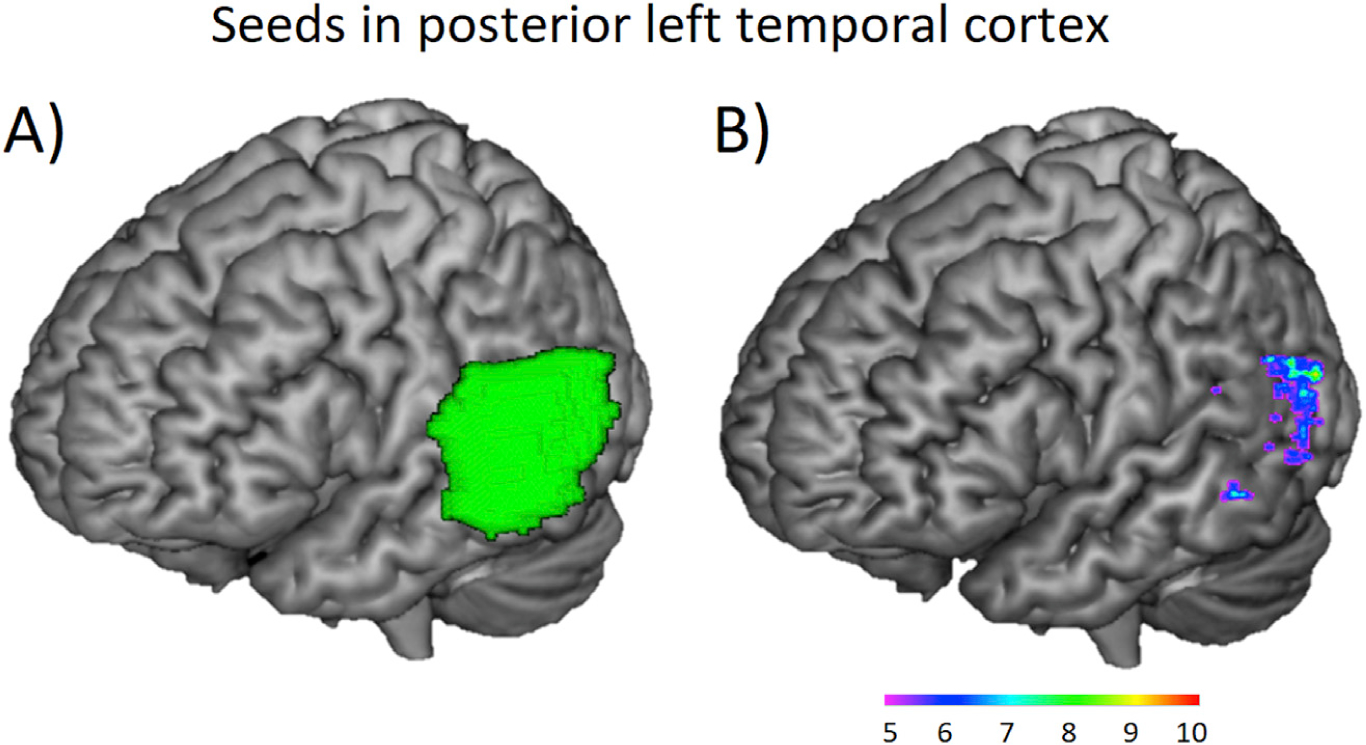
Seed in the left posterior MTG/STG. (A) Anatomical area where the maximum activation (k = 50) was extracted from for every single participant for multiplication task contrast of the hard versus control conditions. (B) Areas showing the greatest overlap in seed distribution among participants. The scale shows the number of participants showing overlap in a given voxel.
Because of a specific a priori hypothesis of brain areas involved in language-related processing, we used an atlas-based anatomical mask (aal template) of the left IFG as our verbal ROI. Similarly, because of a specific a priori hypothesis of brain areas involved in quantity manipulation, the left and right IPL/SPL were used as anatomical masks. The choice of these anatomical masks was based on previous findings from our lab (e.g. Prado et al., 2011, 2013, 2014; Berteletti et al., 2014a; Berteletti et al., 2014b; Berteletti et al., 2014).
3dClustSim, available as part of the AFNI fMRI analysis package, was used to calculate cluster size threshold for significance for these two anatomically defined masks. 3dClustSim calculates cluster size threshold for false positive (noise-only) clusters at specified uncorrected alpha levels. Briefly, 3dClustSim carries out a user specified number of Monte Carlo simulations of random noise activations at a particular voxel-wise alpha level within a masked brain volume. Following the suggestions made by Eklund et al. (2016)’s regarding the inflated statistical significance achieved using some packages (Eklund et al., 2016), we used 3dClustSim’s recent version (fixed by AFNI in May 2015). We used 3dFWHMx to calculate the smoothness of the data for every single participant, using a spatial autocorrelation function (ACF), and then averaged those smoothness values across all participants. This average smoothness value was then entered into 3dClustSim to calculate the cluster size needed for significance for a given ROI. For all fMRI results reported in this article, a cluster was considered significant if it was greater than the cluster size threshold calculated with 3dClustSim, at cluster-wise threshold 0.05 and voxel-wise threshold 0.005. Based on this calculation, a cluster size of 46, 45 and 39 voxels was needed for significance for the left IFG, right IPL/SPL and left IPL/SPL ROIs, respectively (ACF values = 0.46, 4.33, 10.98).
Although we used anatomically defined areas, we explored the overlap of the clusters showing significant changes in connectivity with the clusters identified by two localizer tasks. Given that one of the most influential neurocognitive models of number processing, the triple-code model (Dehaene, 1992), postulated that arithmetic fact retrieval depends on phonological codes, and several studies suggesting the strong connection between phonological abilities and arithmetic (e.g. De Smedt and Boets, 2010), we used a rhyming judgement task (verbal localizer) to identify brain areas within the left IFG. Given previous meta-analyses showing the role of bilateral IPL/SPL in quantity representation (Dehaene et al., 2003; Klein et al., 2016) and the involvement of these areas in calculation (Arsalidou and Taylor, 2011), we used a dot comparison task to identify brain areas involved in numerical operations within the left and right IPL/SPL. By showing the overlap of multiplication changes with these verbal and numerical localizers, we are better able to attribute developmental differences to these underlying mechanisms (Poldrack, 2006).
As for the verbal task, we identified, for each participant, voxels that showed greater activity associated with the harder word pairs, as compared to the control condition, averaged across times. The harder word pairs were those pairs having similar orthography but different phonology (e.g., pint–mint) and those with different orthography but similar phonology (e.g., jazz–has). Greater left IFG activity has been shown for this harder word pairs, which was interpreted as a greater reliance on the verbal processing network by these conditions (Prado et al., 2011). In a second-level analysis, these individual contrasts were submitted to one-sample t-tests across all participants. The brain activation elicited by this contrast was constrained within the anatomically defined mask of the left IFG defined above.
As for the numerosity task, we identified the regions that showed greater activity for the hard comparison task (i.e. comparing 24 with 36 dots) as compared to the control condition, averaged across times. We chose the hard condition for the contrast because brain activation in bilateral IPL/SPL is ratio-dependent, showing increased BOLD activity to hard trials (when quantities are closer to one another) relative to easy ones (when quantities are far away from each other) (Pinel et al., 2001a). In a second-level analysis, these individual contrasts were submitted to one-sample t-tests across all participants. The brain activation elicited by this contrast was constrained within the anatomically defined mask of the left and right IPL/SPL defined above.
2.7.4. Second level analysis
We ran a second level analysis to look at changes in functional connectivity between the seed and the three anatomical areas of interest (left IFG, left IPL/SPL and right IPL/SPL) associated with longitudinal behavioral improvement. This model included the change over time in the trimmed means of RTs of the multiplication task as the covariate of interest.
2.7.5. Whole-brain analyses
To investigate non-predicted effects in regions outside the ROIs, we also report results of the whole-brain analysis (excluding ROIs). Statistical significance for the whole brain was also defined using 3dClustSim. A cluster size of 180 voxels was needed for whole brain significance (ACF values = 0.46, 4.33, 10.98).
3. Results
3.1. Behavioral results
3.1.1. Localizer tasks
First, we examined changes over time of participants’ performance on the two localizer tasks for the whole sample. We ran a repeated measures ANOVA with Task (verbal and numerosity) and Time (T1, T2) as the between-subjects factor. Bonferroni post hoc tests were used when an effect was found significant.
As for accuracy, there was a main effect of Task (F(1,44) = 27.86, p < .001, partial n2 = 0.39) and Time (F (1,44) = 26.73, p < .001, partial n2 = 0.38), but no Task × Time interaction (F (1,44) = 0.54, p = .47, partial n2 = 0.01). Task differences were due to the numerosity task being solved with higher accuracy (mean = 91.0, SEM = 0.9) than the verbal task (mean = 83.0, SEM = 1.6). Time differences were due to an increase in accuracy from T1 (mean = 84.1, SEM = 1.4) to T2 (mean = 89.9, SEM = 1.1).
Similar findings were found when studying means RTs. A main effect of Task (F (1,39) = 44.58, p < .001, partial n2 = 0.53) and Time (F (1,39) = 16.90, p < .001, partial n2 = 0.30) were significant, whereas the Task × Time interaction (F (1,39) = 0.59, p = .45, partial n2 = 0.01) was not. Task differences in RTs were due to the numerosity task being solved faster (mean = 916, SEM = 45) than the verbal task (mean = 1157, SEM = 32). Time differences were due to RTs becoming faster over time (T1: mean = 1115, SEM = 39; T2: mean = 958, SEM = 40).
3.1.2. Arithmetic tasks
First, we examined how accurately participants (whole sample) solved multiplication problems over time by running a repeated measures ANOVA with Time (T1, T2) as the within-subject factor. This analysis showed a significant main effect of Time (F (1,44) = 5.65, p = .02, partial n2 = 0.11), due to increases in accuracy from T1 to T2. We ran the same analysis for RTs, which showed a significant main effect of Time (F (1,44) = 12, p = .001, partial n2 = 0.21), due to response time decreasing over time.
Then, we analyzed changes in accuracy and RTs for the Improvers and Non-improvers by running a repeated measures ANOVA with Time (T1, T2) as the within-subject factor and Group (Improvers; Non-improvers) as the between-subject factor. As for accuracy, Time was the only main effect that reached significance (F (1,43) = 5.70, p = .02, partial n2 = 0.12). The main effect of Group (F (1,43) = 1.15, p = .29, partial n2 = 0.03) and Time × Group interaction (F (1,43) = 0.72, p = .40, partial n2 = 0.02) was not significant. As for RTs, a significant Time × Group interaction was found (F (1,43) = 0.70, p < .001, partial n2 = 0.62). This interaction showed that groups did not differ at T1 (t (43) = 1.61, p = .12), but they did at T2 (t (43) = 2.84, p = .007). The Improvers became faster over time (t (22) = 11.91, p = .001) and the Non-improvers showed a tendency of becoming slower in solving the task (t (22) = 1.81, p = .08). Fig. 3 shows the change over time in trimmed means of RTs separately for Improvers and Non-improvers.
Fig. 3.
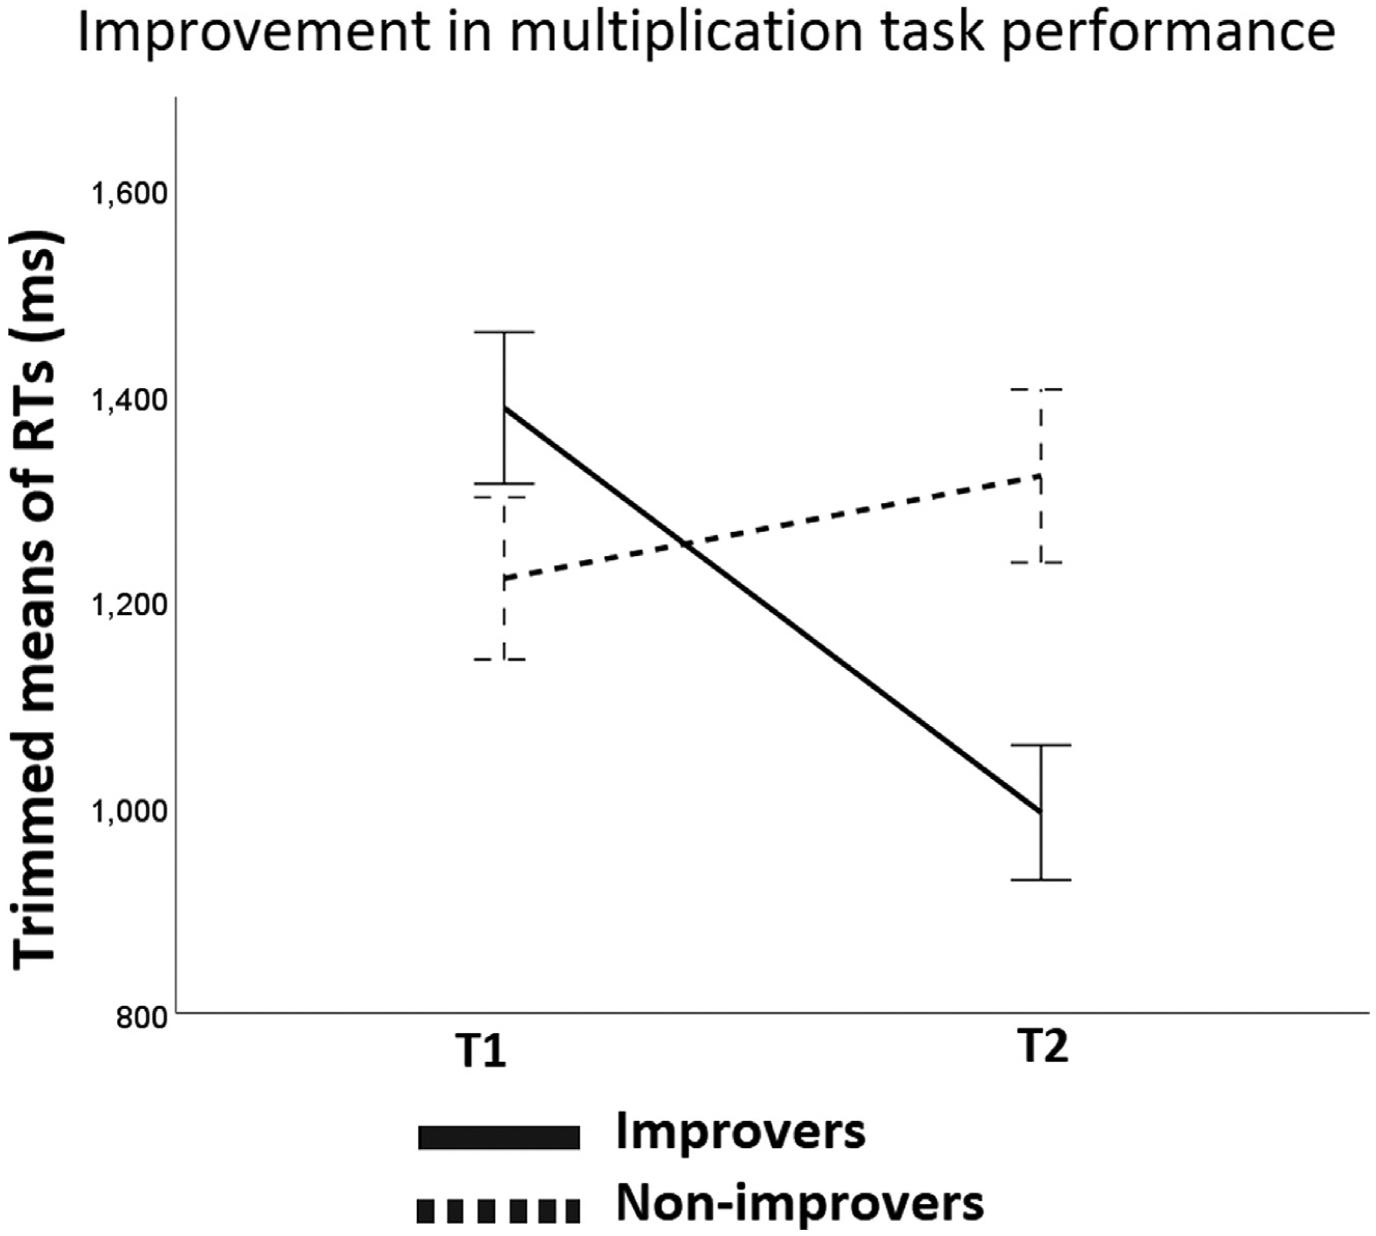
Longitudinal improvement measure. Change over time in trimmed means of RTs for the Improvers (n = 23) and Non-improvers groups of children (n = 22).
3.2. fMRI results
3.2.1. Localizer tasks
As described in the Methods, localizer tasks were used to identify brain areas in the frontal and parietal cortices involved in verbal and numerosity processing, respectively, in order to later explore the overlap of these areas with the clusters showing significant changes in connectivity over time. Fig. 4 shows the verbal brain area identified with the rhyming judgement localizer, consisting of one cluster in the left IFG (Fig. 4A; cluster in yellow) and the numerosity brain area identified with the dot comparison task, consisting of a cluster in the right IPL/SPL (Fig. 4B; cluster in white) and left IPL/SPL (Fig. 4B; cluster in cyan). Table 3 shows more detailed information about the clusters comprising these brain areas identified by the localizer tasks. The peak coordinates of the cluster in the left IFG were close to coordinates identified in previous studies using the same verbal localizer task (Prado et al., 2011, 2014). Similarly, the peak coordinates of the right IPL/SPL were close to coordinates identified in previous studies using the same numerisoty localizer task (Prado et al., 2011, 2014; Berteletti et al., 2014a, 2014b; Demir et al., 2014) and to the coordinates reported in Dehaene’s meta-analysis studying brain activation across different studies measuring the abstract representation of quantity (Dehaene et al., 2003). As for the cluster in the left IPL/SPL, the peak coordinates were close to the coordinates reported in left IPS in studies measuring non-symbolic comparison in adults (Pinel et al., 2001b), in adults vs. children (Ansari and Dhital, 2006), as well as in the above mentioned Dehaene’s meta-analysis (Dehaene et al., 2003).
Fig. 4.
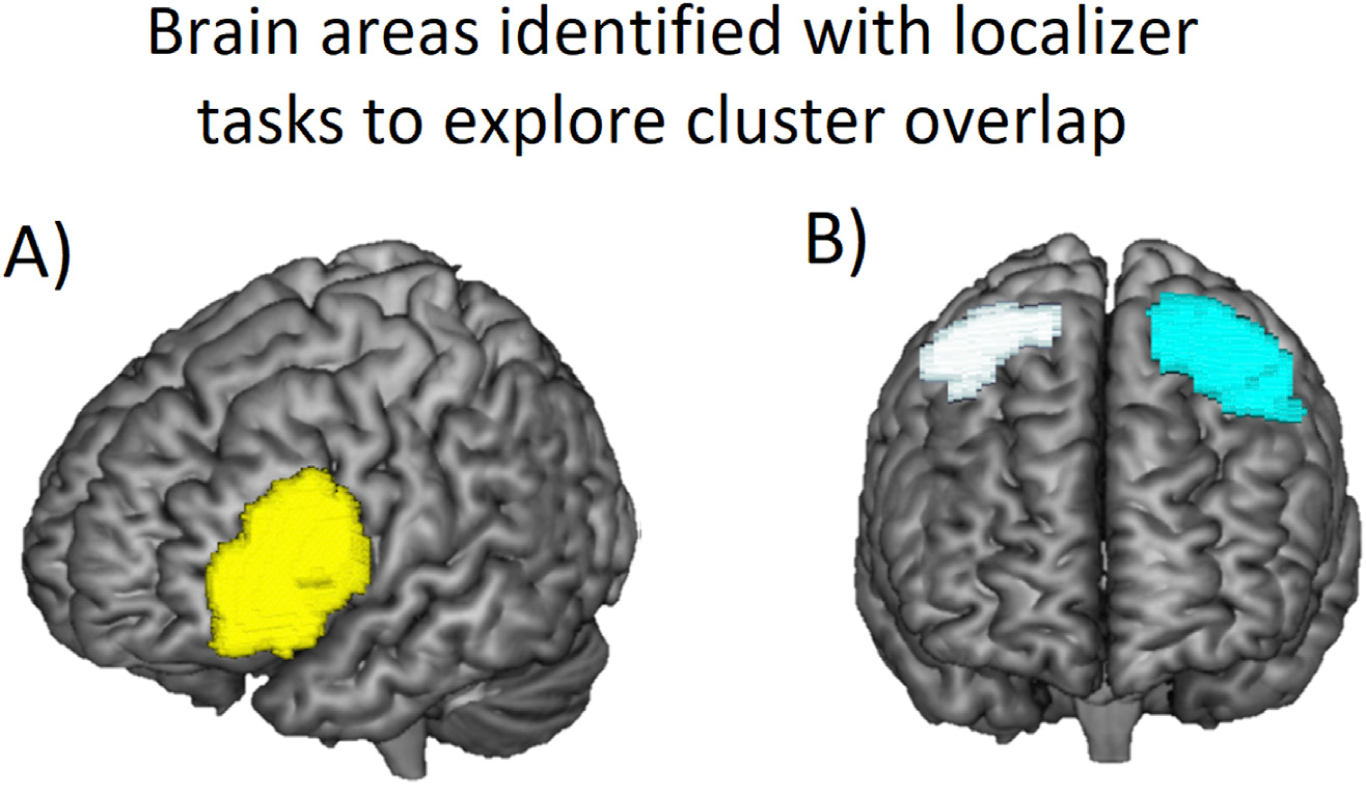
Brain areas identified with localizer tasks to explore cluster overlap. (A) Verbal brain area identified by comparing a rhyming judgment of pair of words to the control condition within the anatomical left IFG (i.e. cluster in yellow). (B) Numerical operations brain area identified by comparing brain activity elicited by comparing the numerosity task (24 vs 36 dots) to the control condition within the right IPL/SPL (i.e. cluster in white) and the left IPL/SPL (i.e. cluster in cyan).
Table 3.
Brain areas identified to explore cluster overlap. Cluster size (k), MNI coordinates of the peaks, Z values and approximate Brodmann areas (~BA) for the brain areas identified with localizer tasks to explore cluster overlap.
| Brain area | ~ BA | k | MNI coordinates | Z value | ||
|---|---|---|---|---|---|---|
| X | Y | Z | ||||
| Rhyming vs. control within left IFG (cluster in yellow) | 44, | 1544 | −50 | 15 | 26 | 7.76 |
| 45, | −44 | 27 | 18 | 7.24 | ||
| 47 | −42 | 5 | 26 | 6.77 | ||
| Numerosity vs. control within the left IPL/SPL (cluster in cyan) | 7, 40 | 871 | −44 | −29 | 46 | 5.84 |
| −42 | −39 | 46 | 5.70 | |||
| −34 | −31 | 38 | 5.48 | |||
| Numerosity vs. control of within the right IPL/SPL (cluster in white) | 7, 40 | 389 | 46 | −37 | 54 | 6.13 |
| 32 | −49 | 46 | 5.92 | |||
| 22 | −63 | 50 | 5.23 | |||
3.2.2. PPI results
The regression analysis revealed that the seed in the posterior left temporal cortex showed significant changes from T1 to T2 in functional connectivity with a cluster in the left IFG as a function of improvement (Fig. 5A, red). More specific information about this cluster is given in Table 4. Then, we aimed to see if this cluster overlapped with the cluster identified by the verbal localizer task. Fig. 5A shows that the cluster in the left IFG (red) overlapped with the cluster identified by the verbal localizer task (yellow). We extracted connectivity values from the cluster showing significant changes in functional connectivity in the left IFG (red) and plotted means of functional connectivity separately for Improvers and Non-improvers at each time point. Fig. 5B shows the interaction between Group (Improvers, Non-improvers) and Time (T1, T2). In order to further explore this effect, we compared the difference between times separately for the Improvers and Non-improvers, by running a paired sample T test for each group. No cluster reached significance. We then compared the two groups at each time point by running a Two-sample T test. Fig. 5A shows the cluster with significant differences between groups at T2 (violet). More detailed information about this cluster is shown in Table 4. As illustrated in Fig. 5C, the Non-improvers showed greater temporo-frontal connectivity than the improvers at T2.
Fig. 5.
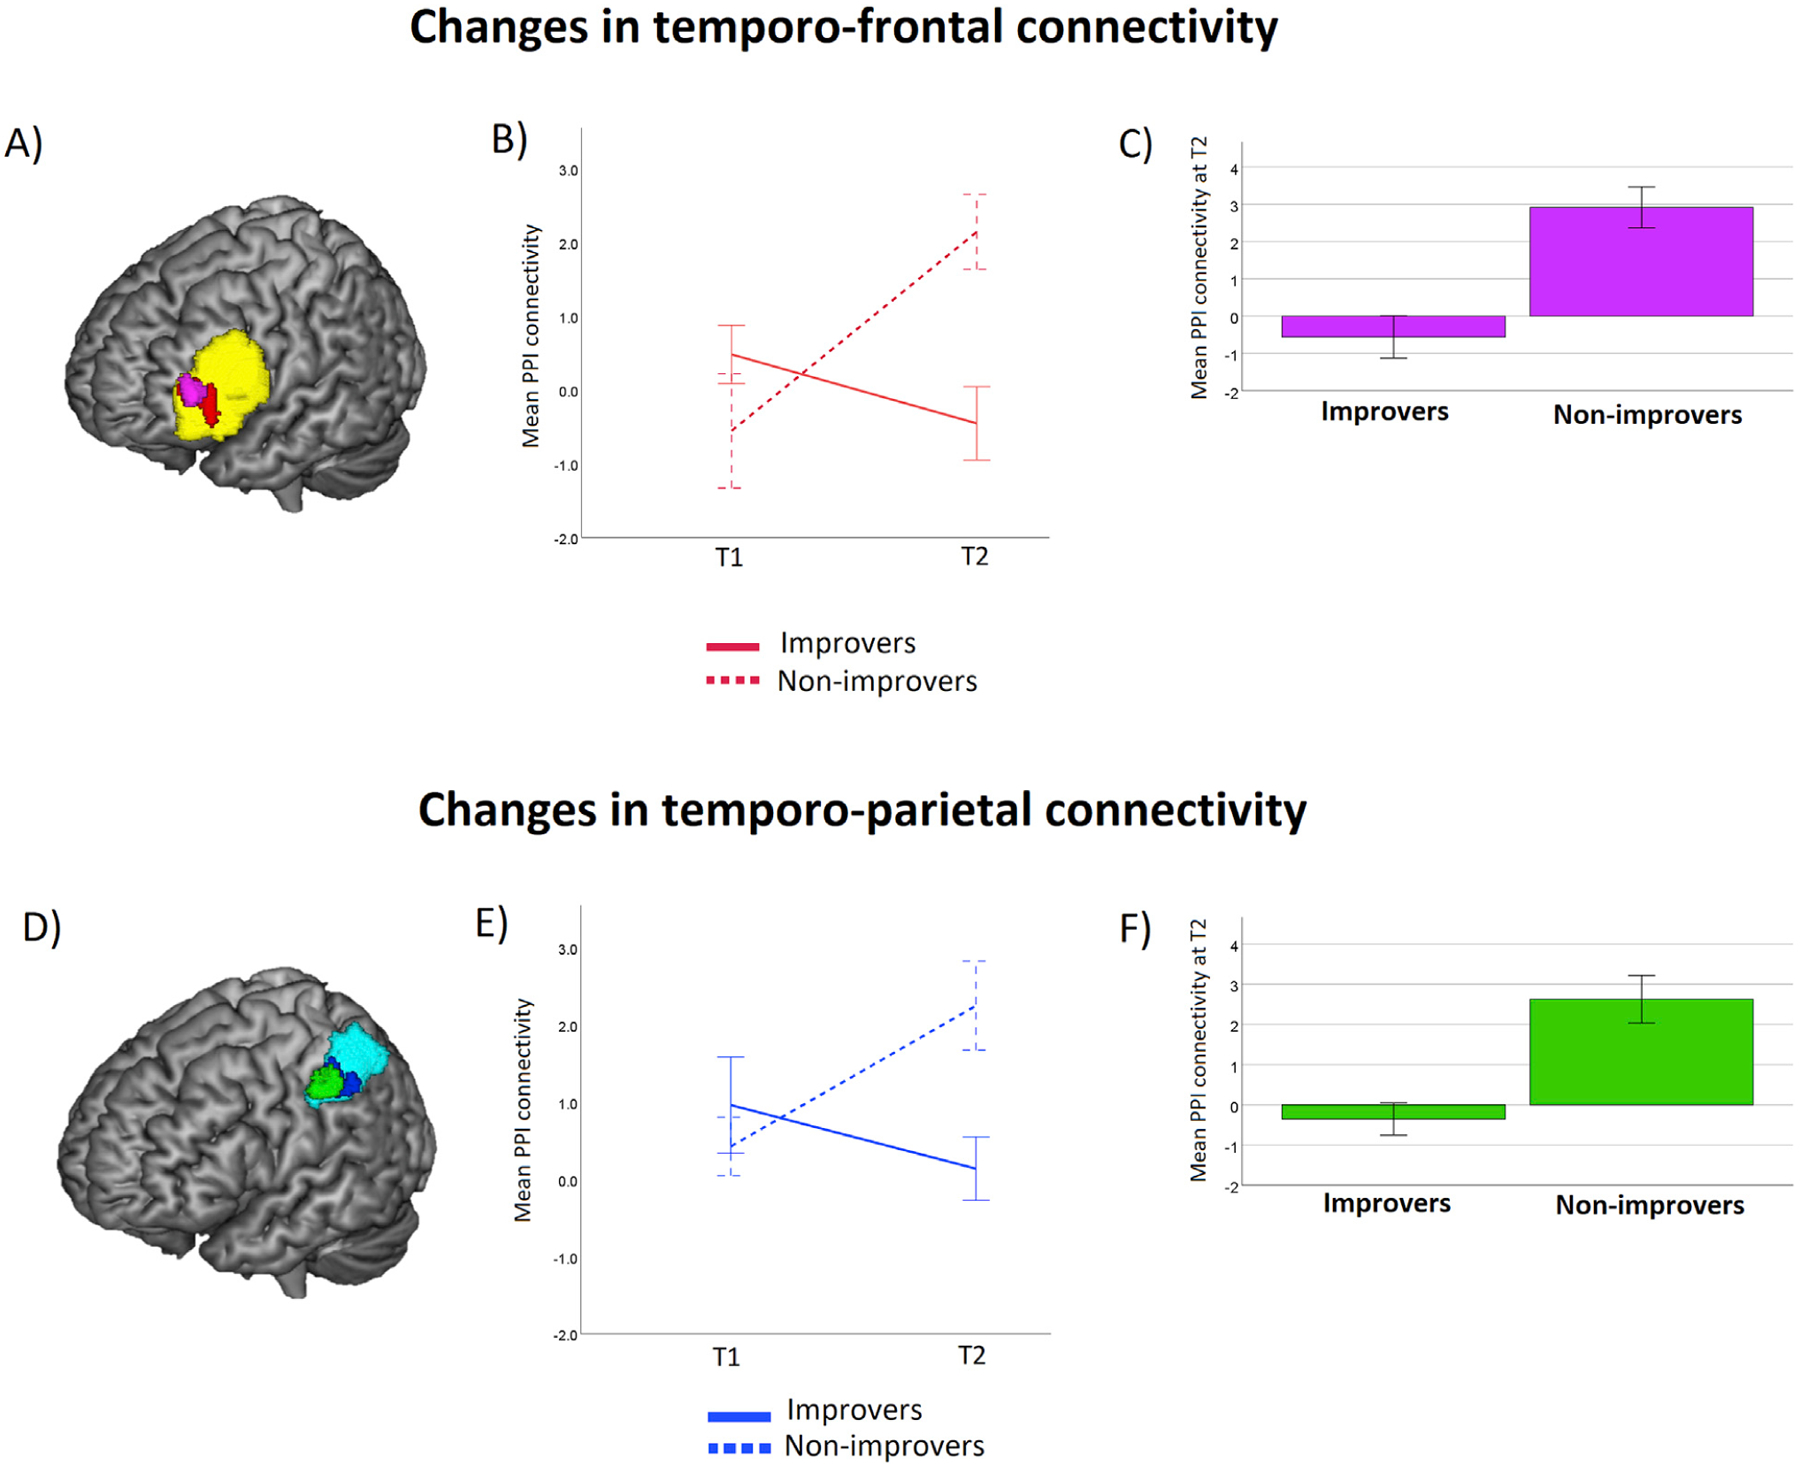
PPI results for the temporo-frontal and temporo-parietal connectivity. (A) Cluster in the left IFG showing a significant change in functional connectivity with the posterior left MTG/STG seed depending on improvement in trimmed means of RTs (red), overlapping the cluster in left IFG showing brain activation for the verbal task, as identified by the rhyming localizer (yellow). Cluster in the left IFG for the follow-up analyses, showing greater functional connectivity at T2 for Non-improvers compared to Improvers (violet). (B) Line graph shows changes in mean functional connectivity for the Improvers and the Non-improvers over time, extracted from the cluster in red in panel A. (C) Bar graph shows functional connectivity levels at T2 for each group, extracted from the cluster in violet in panel A. (D) Cluster in the left IPS showing a significant change in connectivity with the posterior left MTG/STG seed depending on improvement in trimmed means of RTs (blue), overlapping the cluster in the left IPL/SPL showing brain activation for the numerosity task as identified by the dot comparison localizer (cyan). Cluster in the left IPS for the follow-up analyses, showing greater functional connectivity at T2 for Non-improvers compared to Improvers (green). (E) Line graph shows changes in mean functional connectivity for the Improvers and the Non-improvers over time, extracted from the cluster in blue in panel A. (F) Bar graph shows functional connectivity levels at T2 for each group, extracted from the cluster in green in panel A.
Table 4.
PPI clusters information. Cluster size (k), MNI coordinates of the peaks, Z values and approximate Brodmann areas (~BA) for the clusters showing significant changes in functional connectivity with posterior left temporal cortex depending on improvement in multiplication task performance (i.e. trimmed means of RTs) and for the clusters showing significant group differences at T2 (follow-up effects).
| ROI | ~ BA | k | MNI coordinates | Z value | ||
|---|---|---|---|---|---|---|
| X | Y | Z | ||||
| Changes in functional connectivity | ||||||
| Left IFG | 45 (Triangularis) | 59 | −42 | 39 | 10 | 3.29 |
| −46 | 29 | −2 | 3.17 | |||
| Left IPL/SPL | 40 (IPS) | 57 | −30 | −47 | 38 | 3.78 |
| −40 | −33 | 38 | 3.31 | |||
| −46 | −45 | 42 | 3.25 | |||
| Follow-up effects | ||||||
| Left IFG | 45 (Triang) | 45 | −38 | 37 | 6 | 3.44 |
| Left IPL/SPL | 40 (IPS) | 40 | −38 | −41 | 38 | 3.36 |
| −32 | −35 | 38 | 3.22 | |||
The regression analysis also revealed that the seed in the posterior left temporal cortex showed significant changes from T1 to T2 in functional connectivity with a cluster in the left IPS as a function of improvement (Fig. 5D, blue). More specific information about this cluster is given in Table 4. Then, we explored the overlap between the above-mentioned cluster and that involved in numerical operations, as identified by the numerosity task. As shown in Fig. 5D, the cluster in left IPS showing significant changes in connectivity with temporal cortex overlapped with the cluster in the left IPL/SPL localized by the numerosity task (cyan). We extracted values from the cluster showing significant changes in functional connectivity in the left IPS (in blue) and plotted means of functional connectivity separately for Improvers and Non-improvers at each time point. Fig. 5E shows the interaction between Group (Improvers, Non-improvers) and Time (T1, T2). In order to further explore this group effect, we compared the difference between times separately for the Improvers and Non-improvers groups, by running a paired sample T-test for each group. No cluster reached significance. We then compared the two groups at each time point by running a Two-sample T-test. Fig. 5D shows the cluster with significant differences between groups at T2 (green). More detailed information about this cluster is shown in Table 4. As illustrated in Fig. 5F, the Non-improvers showed greater temporo-parietal connectivity at T2 as compared to the Improvers group.
We also explored whether the seed in posterior left temporal cortex showed significant functional connectivity with any other brain area outside our ROIs by running a whole brain analysis. The analysis showed significant brain activation in the right putamen (k = 276; peak coordinates: x = 30, y = 1, z = 6; Z = 4.65; x = 24, y = 7, z = 10; Z = 3.94; x = 28, y = 3, z = −10; Z = 3.85).
3.2.3. Correlation with standardized measures of math achievement
In order to examine the relation of connectivity with math achievement, we extracted the PPI values at each time point from the two clusters showing significant changes in functional connectivity. We correlated this with the standardized scores measures of CMAT multiplication ability at each time point. The correlation for the CMAT was not significant for the left IFG cluster (all p values above .40). There was no significant correlation of functional connectivity between posterior left MTG/STG and left IPS with CMAT scores at T1 (r = 0.05, p = .76), but there was a trend at T2 (r =−0.30, p = .051). The greater the functional connectivity between temporal and parietal regions was at T2, the lower the CMAT multiplication ability.
4. Discussion
This study examined the neural correlates of changes over time in math competence in order to understand the underlying mechanisms by which the brain supports successful arithmetic development. Consistent with the behavioral research, fMRI studies have shown that solving multiplications activates the left lateral temporal cortex suggesting reliance on verbal representations of arithmetic facts from long-term memory, but they also activate brain areas associated with numerical operations in parietal cortex suggesting the use of calculation procedures. Continuous reliance on numerical operations, however, is associated with low levels of math competence (De Smedt et al., 2011). In the present study, we carried out a psycho-physiological interaction (PPI) analysis (Friston et al., 1997) in order to examine whether changes in functional connectivity depend on behavioral improvement over time when children solved multiplications. Changes in functional connectivity between the posterior left MTG/STG, involved in the storage of arithmetic facts as verbal representations, and two other key brain areas were examined. The left IFG is considered to be involved in the cognitive control involved in the retrieval and selection of math facts, whereas the left and right IPL/SPL are believed to be involved in numerical operations associated with calculation. We determined whether developmental changes in temporo-frontal and temporo-parietal functional connectivity were associated with improvement in RTs when children solved hard multiplication problems inside the scanner.
Based on previous evidence showing grade-related (Prado et al., 2014) and age-related (Rivera et al., 2005) reductions in left IFG over time, suggesting less effortful retrieval and selection of arithmetic facts from long-term memory, our first prediction was that longitudinal improvement in multiplication task performance would be associated with decreases in functional connectivity between temporal and frontal areas. Our results revealed a cluster in the left IFG showing that significant changes in functional connectivity over time with the posterior left temporal cortex depended on behavioral improvement. Our main finding was that Non-improvers, who showed a tendency of performance deterioration over time, showed greater levels of temporo-frontal functional connectivity at T2, as compared to improvers, suggesting that solving the task was more effortful for the Non-improvers. In contrast, our study found that improvers, who became faster over time showed low levels of connectivity between those areas at T2, suggesting that they were automatically retrieving the solution from long-term memory. This latter finding goes in line with a recently published study showing reduced frontal activation associated with improvement in accuracy and response times after two weeks of multiplication training (Soltanlou et al., 2018).
Based on previous literature on low achievement in solving multiplication tasks, we expected that Non-improvers would find it difficult to directly retrieve the multiplication facts from long-term memory and would have to use numerical operations as back-up strategies. Our results revealed that Non-improvers showed greater connectivity between posterior left temporal cortex and left IPS at T2 as compared to improvers. This finding suggests that these children are using derived facts to solve the task. For example, for a problem such as “7×8 =”, our children may have retrieved the solution to an easier problem such as “7×7 =” and then performed an additional operation such as “49 + 7 =” to get the correct solution, 56. Consistent with our interpretation, the use of this strategy is most frequently reported for solving multiplications with operands of 6 or larger (LeFevre et al., 1996a, 1996b), the same as the hard problems used in the current study. Using derived facts is an inefficient strategy that requires cognitive control in order to coordinate the multiple steps needed to arrive at the correct solution. This increase on cognitive control is compatible with our results showing that Non-improvers’ showed greater temporo-frontal connectivity at T2 as compared to improvers.
The temporo-parietal connectivity finding was specific to the left hemisphere. Several neuropsychological studies have shown that lesions to the left parietal cortex are associated with severe deficits in calculation (e.g. Gerstman, 1957) and more recent fMRI studies have confirmed the role of the left IPS in calculation (Arsalidou and Taylor, 2011). Simon and colleagues found that an area in the left IPS showed significant activation exclusively for calculation as compared to several other tasks (Simon et al., 2002). The left IPS has shown age-related increases in activation when children solve addition and subtraction tasks, suggesting that this area is increasingly specialized for calculation (Rivera et al., 2005). Developmental studies have also shown that gray matter volume in the left IPS at the end of 1st grade is associated with math competence a year later at the end of 2nd grade (Price et al., 2016) and gray matter volume in the same area in 10-year-old schoolchildren was positively correlated with individual differences in arithmetic scores (Li et al., 2013). Overall, the fact that we found increased functional connectivity of the posterior left temporal cortex with the left IPS for the Non-improvers at T2, together with the fact that the left IPS is closely associated with calculation, fits our interpretation that this group is relying on derived facts to solve the task at T2.
Brain imaging data suggests that Non-improvers were likely already retrieving the solution from long-term memory at T1. The low temporo-frontal connectivity for the Non-improvers suggests that retrieval may have been relatively efficient and the low temporo-parietal connectivity suggests that they were not relying on numerical operations, such as derived facts, to solve the task. This pattern of brain connectivity changed at T2, suggesting that Non-improvers changed the strategies they relied on to solve the task. The increases in connectivity over time for Non-improvers suggest that there was not a ceiling effect in RTs. If that ceiling effect had occurred, we would have expected no changes in temporo-frontal and temporo-parietal connectivity over time, suggesting that this group relied on efficient retrieval and not numeric operations. Contrary to this, our findings suggest performance deterioration over time that was associated with clear changes in functional connectivity, which is compatible with a change in the use of strategies over time, i.e. more effortful retrieval and greater use of numerical strategies.
The key question is why would the Non-improvers use more numerical operations at T2 than at T1? One possible explanation is that, due to lack of adequate practice, the memory trace of those multiplication facts may have decayed in long-term memory for the Non-improvers, so they were no longer able to directly retrieve the solution at T2 and had to complement that strategy with numerical operations by using derived facts. Unless regularly used, memories suffer from decay, which is a gradual loss of memory traces that explains non-pathological memory loss (Hardt et al., 2013). But, why would the Non-improvers’ memory traces decay more than the Improvers? Some studies have shown that the capacity to learn new material, and to later remember it, is negatively affected by the similarity of the items to be learnt. According to interference-based forgetting memory models (Nairne, 1990; Oberauer and Lange, 2008), the more features shared by the material to be learnt, the more the storage of the items will be disturbed by this interference and the weaker its trace will be. Oberauer and Lange (2008) showed this effect by asking participants to remember lists of 4 words (e.g. beer, fond, vote, silk) followed by 4 letters (e.g. N, D, P, F) and found that the word that had more overlap with the letters was worse recalled (i.e. fond).
De Visscher and Noel (2013) suggested that, given that learning multiplication facts involve the memorization of different combinations of the same 10 digits, those problems that shared more digits with the rest would generate greater interference, leading to weaker traces in long-term memory and more difficulty in retrieval (De Visscher and Noel, 2013).6 De Visscher and Noël (2014b) showed that individual differences in sensitivity to interference affected multiplication task performance concurrently for fourth-graders and predicted multiplication task performance one year later (De Visscher and Noel, 2014b). Because of this sensitivity to interference, some children will build weaker and/or smaller arithmetic fact networks for multiplication. Given that most of the multiplication problems that we analyzed in our study are the ones reported among the most interfering ones by De Visscher and Noël (2014b)’s study, it might be the case that Non-improvers in our study were more sensitive to this interference, which may have made their memory trace weaker over time. Weaker traces may explain their greater use of numerical operations 2 years later.
The arithmetic fact network is an associative network where problems are linked to different solutions with different strengths of activation (Campbell, 1995). According to Siegler’s Distribution of Association model (Siegler, 1988), the more a problem has been correctly solved in the past, the stronger the association between the problem and its correct solution. However, problems will also be solved incorrectly, leading to that problem showing some strength in its association with incorrect solutions. Barrouillet et al. (1997) found that, when solving a multiplication task, adolescents tended to make errors by giving the solution of another problem that belonged to the table of one of the two multipliers (Barrouillet et al., 1997). Altogether these results suggest that a simultaneous activation of arithmetic facts occurs when an operation is presented, that this can be seen in children as young as fourth graders (Lemaire et al., 1991) and that inhibitory mechanisms are needed to solve the operation correctly (Campbell and Thompson, 2012). We believe this inhibitory mechanism may have played a more important role at T2 because selecting the correct solution from competitors should be harder when the memory traces decay. Inhibitory control would have been especially needed if the Non-improvers were also more sensitive to interference. We argue that both the hypersensitivity to interference and the inhibition explanations suggest that, through decay, retrieval of the solutions from memory are more effortful at T2, which explains the increased temporo-frontal connectivity found for the Non-improvers at that time point.
Another important question is whether these findings are limited to how children solve a timed multiplications task in an unusual situation, such as inside an fMRI scanner, or whether our study is relevant to children’s multiplication ability in a more ecologically valid context, where children solve multiplication problems with paper and pencil and without time restrictions. Our study showed that greater temporo-parietal connectivity at T2 was not only associated with slower response times inside the scanner, but also with worse performance on a standardized and untimed measure of multiplication ability at T2. Our findings support previous evidence showing that relying on numerical operations to solve multiplication problems was associated with lower levels of competence (De Smedt et al., 2011) and showing that children with math learning disabilities fail to abandon numerical operations (Berteletti et al., 2014a, 2014b).
Overall, our findings are consistent with Siegler’s overlapping waves model of strategy use (Siegler, 1996), according to which old strategies are not replaced by new ones, but all possible strategies are available to solve a math problem at a given time. Our study shows that, probably because of the decay of memory traces of harder multiplication problems in long-term memory, some children go back to relying on less efficient numerical operation strategies to solve single-digit multiplication problems. Given that mathematics is cumulative and gaining automaticity in retrieving arithmetic facts is considered a building block for more advanced math development, this reversion in solving multiplications shown by the Non-improvers can predispose them to smaller gains when more advanced math content, such as multi-digit multiplications or divisions, fractions or algebra, are introduced in math classes. Future studies should further investigate the decay of arithmetic facts in long-term memory, its role in longitudinal math improvement and explore practices that could potentially avoid its negative effects on performance.
Acknowledgments
We thank John Binzak and Rachna Mutreja for their help with data collection. We would like to thank all participating children and their parents. This research was supported by HD059177 from the National Institute of Child Health and Human Development to JRB.
Footnotes
Conflicts of interest
None.
Time point 1 of this dataset is the basis of other publications by our research group, including Prado et al., 2014; Berteletti and Booth, 2015; Berteletti et al., 2014; Demir et al., 2014, 2015, 2016).
Based on the US education system, 11-year-old children were receiving formal math instruction that includes working on multi-digit multiplication problems, while 13-year old children were receiving math instruction that includes the multiplication of fractions.
Improvers and Non-improvers may not differ with regards to their scores on multiplication ability (CMAT) because of the different nature of the two tests. The two subgroups were formed based on response times in the task solved inside the scanner, which was time-limited and involved relatively simple problems. In contrast, the CMAT test is a time-unlimited test that includes a wide range of problems of varying difficulty. Children can solve these problems by relying on backup procedures that may be time-consuming but can nonetheless lead to the correct solution.
Based on n = 42. Three participants have missing data for the verbal and the visuo-spatial WM tests.
We included a greater proportion of problems with true than false solutions because we anticipated that false problems may be associated with error detection and conflict monitoring mechanisms. However, given that we did not find any differences between true and false problems in the subsequent neuroimaging analyses, all problems were included in our main analyses.
According to De Visscher and Noël (2013), problems with the items “2” and “2” show less interference in learning and later retrieval because there are only two single-digit multiplication problems where these items co-occur: 2×2 = 4 and 2×6 = 12. However, the problems combining “2” and “8” will create more interference and will be harder to encode and remember because there are seven multiplication problems where these two items co-occur: 2×4 = 8; 2×8 = 16; 2×9 = 18; 8×3 = 24, 7×4 = 28, 4×8 = 32; 8×9 = 72).
References
- Alloway TP, Gathercole SE, Pickering SJ, 2007. Automated Working Memory Assessment. University of Durham, Durham. [Google Scholar]
- Andres M, Pelgrims B, Michaux N, Olivier E, Pesenti M, 2011. Role of distinct parietal areas in arithmetic: an fMRI-guided TMS study. Neuroimage 54 (4), 3048–3056. 10.1016/j.neuroimage.2010.11.009. [DOI] [PubMed] [Google Scholar]
- Andrews-Hanna JR, Smallwood J, Spreng RN, 2014. The default network and selfgenerated thought: component processes, dynamic control, and clinical relevance TT. Annals of the New York Academy of Sciences TA 1316 (1), 29–52. [DOI] [PMC free article] [PubMed] [Google Scholar]
- Ansari D, 2010. Neurocognitive approaches to developmental disorders of numerical and mathematical cognition : the perils of neglecting the role of development. Learn. Indiv Differ 20 (2), 123–129. 10.1016/j.lindif.2009.06.001. [DOI] [Google Scholar]
- Ansari D, Dhital B, 2006. Age-related changes in the activation of the intraparietal sulcus during nonsymbolic magnitude Processing : an event-related functional magnetic resonance imaging study. J. Cognit. Neurosci 18 (11), 1820–1828. [DOI] [PubMed] [Google Scholar]
- Arsalidou M, Taylor MJ, 2011. Is 2+2=4? Meta-analyses of brain areas needed for numbers and calculations. Neuroimage 54 (3), 2382–2393. 10.1016/j.neuroimage.2010.10.009. [DOI] [PubMed] [Google Scholar]
- Artemenko C, Soltanlou M, Ehlis AC, Nuerk HC, Dresler T, 2018. The neural correlates of mental arithmetic in adolescents: a longitudinal fNIRS study. Behav. Brain Funct 14 (1), 1–13. 10.1186/s12993-018-0137-8. [DOI] [PMC free article] [PubMed] [Google Scholar]
- Barrouillet P, Fayol M, Lathuliere E, 1997. Selecting between competitors in multiplication tasks: an explanation of the errors produced by adolescents with learning difficulties. Int. J. Behav. Dev 21 (2), 253–275. [Google Scholar]
- Berteletti I, Booth J, 2015. Finger Representation and Finger-Based Strategies in the Acquisition of Number Meaning and Arithmetic.
- Berteletti I, Man G, Booth JR, 2014. How number line estimation skills relate to neural activations in single digit subtraction problems. Neuroimage 107C, 198–206. 10.1016/j.neuroimage.2014.12.011. [DOI] [PMC free article] [PubMed] [Google Scholar]
- Berteletti I, Prado J, Booth J, 2014a. Children with mathematical learning disability fail in recruiting verbal and numerical brain regions when solving simple multiplication problems. Cortex 57, 143–155. [DOI] [PMC free article] [PubMed] [Google Scholar]
- Berteletti I, Prado J, Booth JR, 2014b. Childrenwith mathematical learning disability fail in recruiting verbal and numerical brain regions when solving simple multiplication problems. Cortex 57, 143–155. 10.1016/j.cortex.2014.04.001. [DOI] [PMC free article] [PubMed] [Google Scholar]
- Bloechle J, Huber S, Bahnmueller J, Rennig J, Willmes K, Cavdaroglu S, et al. , 2016. Fact learning in complex arithmetic—the role of the angular gyrus revisited. Hum. Brain Mapp 37 (9), 3061–3079. 10.1002/hbm.23226. [DOI] [PMC free article] [PubMed] [Google Scholar]
- De Brauwer J, Fias W, 2009. A Longitudinal Study of Children’s Performance on Simple Multiplication and Division Problems 45 (5), 1480–1496. 10.1037/a0015465. [DOI] [PubMed] [Google Scholar]
- Bressler SL, Menon V, 2010. Large-scale brain networks in cognition: emerging methods and principles. Trends Cognit. Sci 14 (6), 277–290. 10.1016/j.tics.2010.04.004. [DOI] [PubMed] [Google Scholar]
- Campbell JID, 1995. Mechanisms of simple addition and multiplication: a modified network-interference theory and simulation. Math. Cognit 1 (2), 121–164. [Google Scholar]
- Campbell JID, Thompson VA, 2012. Retrieval-induced forgetting of arithmetic facts retrieval-induced forgetting of arithmetic facts. J. Exp. Psychol. Learn. Mem. Cognit 38 (1), 118–129. 10.1037/a0025056. [DOI] [PubMed] [Google Scholar]
- Casey BJ, Tottenham N, Liston C, Durston S, 2005. Imaging the developing brain: what have we learned about cognitive development? Trends Cognit. Sci 9 (3). 10.1016/j.tics.2005.01.011. [DOI] [PubMed] [Google Scholar]
- De Smedt B, Boets B, 2010. Phonological processing and arithmetic fact retrieval: evidence from developmental dyslexia. Neuropsychologia 48 (14), 3973–3981. 10.1016/j.neuropsychologia.2010.10.018. [DOI] [PubMed] [Google Scholar]
- De Visscher A, Noel MP, 2013. A case study of arithmetic facts dyscalculia caused by a hypersensitivity-to-interference in memory. Cortex 49, 50–70. [DOI] [PubMed] [Google Scholar]
- Dehaene S, 1992. Varieties of numerical abilities. Cognition 44, 1–42. [DOI] [PubMed] [Google Scholar]
- Dehaene S, Piazza M, Pinel P, Cohen L, 2003. Three parietal circuits for number processing. Cogn. Neuropsychol 20, 487–506. 10.1080/02643290244000239. [DOI] [PubMed] [Google Scholar]
- Demir-lira ÖE, Prado J, Booth JR, 2016. Neural correlates of math gains vary depending on parental socioeconomic status (SES). Front. Psychol 7, 1–12. June 10.3389/fpsyg.2016.00892. [DOI] [PMC free article] [PubMed] [Google Scholar]
- Demir ÖE, Prado J, Booth JR, 2014. The differential role of verbal and spatial working memory in the neural basis of arithmetic. Dev. Neuropsychol 39 (6), 440–458. 10.1038/jid.2014.371. [DOI] [PMC free article] [PubMed] [Google Scholar]
- Demir ÖE, Prado J, Booth JR, 2015. Parental socioeconomic status and the neural basis of arithmetic: differential relations to verbal and visuo-spatial representations. Dev. Sci 5, 1–16. 10.1111/desc.12268. [DOI] [PMC free article] [PubMed] [Google Scholar]
- Eklund A, Nichols TE, Knutsson H, 2016. Cluster failure: why fMRI inferences for spatial extent have inflated false-positive rates. Proc. Natl. Acad. Sci. Unit. States Am 113 (33). 10.1073/pnas.1612033113. [DOI] [PMC free article] [PubMed] [Google Scholar]
- Friston KJ, Buechel C, Fink GR, Morris J, Rolls E, Dolan RJ, 1997. Psychophysiological and modulatory interactions in neuroimaging. Neuroimage 6 (3), 218–229. 10.1006/nimg.1997.0291. [DOI] [PubMed] [Google Scholar]
- Geary DC, 1994. Children’s Mathematical Development: Research and Practical Applications. American P), Washington, DC. [Google Scholar]
- Geary DC, Brown SC, Samaranayake V. a., 1991. Cognitive addition: a short longitudinal study of strategy choice and speed-of-processing differences in normal and mathematically disabled children. Dev. Psychol 27 (5), 787–797. 10.1037/0012-1649.27.5.787. [DOI] [Google Scholar]
- Gerstman J, 1957. Some notes on Gerstmann syndrome. Neurology 7, 866–869. [DOI] [PubMed] [Google Scholar]
- Grabner RH, Ansari D, Reishofer G, Stern E, Ebner F, Neuper C, 2007. Individual differences in mathematical competence predict parietal brain activation during mental calculation. Neuroimage 38, 346–356. 10.1016/j.neuroimage.2007.07.041. [DOI] [PubMed] [Google Scholar]
- Hardt O, Nader K, Nadel L, 2013. Decay happens: the role of active forgetting in memory. Trends Cognit. Sci 17 (3), 111–120. 10.1016/j.tics.2013.01.001. [DOI] [PubMed] [Google Scholar]
- Hresko WP, Schlieve PL, Herron SR, Swain C, Sherbenou RJ, 2003. Comprehensive Mathematical Abilities Test. PRO-ED, Austin. [Google Scholar]
- Jordan NC, Hanich LB, Kaplan D, 2009. Arrithmetic fact mastery in young children: a longitudinal investigation. J. Exp. Child Psychol 85 (2), 103–119. 10.1016/S0022-0965(03)00032-8. [DOI] [PMC free article] [PubMed] [Google Scholar]
- Jost Kerstin, Khader Patrick, Burke Michael, Bien Siegfried, Reosler F, 2009. Dissociating the solution processes of small, large, and zero multiplications by means of fMRI. Neuroimage 46, 308–318. 10.1016/j.neuroimage.2009.01.044. [DOI] [PubMed] [Google Scholar]
- Karmiloff-smith A, 2010. Neuroimaging of the developing brain: taking “developing” seriously. Hum. Brain Mapp 31, 934–941. 10.1002/hbm.21074. [DOI] [PMC free article] [PubMed] [Google Scholar]
- Kawashima R, Taira M, Okita K, Inoue K, Tajima N, 2004. A Functional MRI Study of Simple Arithmetic — a Comparison between Children and Adults, vol. 18, pp. 225–231. 10.1016/j.cogbrainres.2003.10.009. [DOI] [PubMed] [Google Scholar]
- Klein E, Suchan J, Moeller K, Karnath HO, Knops A, Wood G, et al. , 2016. Considering structural connectivity in the triple code model of numerical cognition: differential connectivity for magnitude processing and arithmetic facts. Brain Struct. Funct 221 (2), 979–995. 10.1007/s00429-014-0951-1. [DOI] [PubMed] [Google Scholar]
- Krueger F, Landgraf S, Van Der Meer E, Deshpande G, Hu X, 2011. Effective connectivity of the multiplication network: a functional MRI and multivariate Granger Causality Mapping study. Hum. Brain Mapp 32 (2011), 1419–1431. 10.1002/hbm.21119. [DOI] [PMC free article] [PubMed] [Google Scholar]
- LeFevre J-A, Bisanz J, Daley KE, Buffone L, Greenham SL, Sadesky GS, 1996a. Multiple routes to solution of single-digit multiplication problems. J. Exp. Psychol. Gen 125 (3), 284–306. [Google Scholar]
- LeFevre J, Sadesky GS, Bisanz J, 1996b. Selection of procedures in mental Addition: reassessing the problem. Size Effect in Adults 22 (1), 216–230. [Google Scholar]
- Lemaire P, Fayol M, Abdi H, 1991. Associative confusion effect in cognitive arithmetic: evidence for partially autonomous processes. Cah. Psychol. Cognit 11, 587–604. [Google Scholar]
- Li Y, Hu Y, Wang Y, Weng J, Chen F, 2013. Individual structural differences in left inferior parietal area are associated with schoolchildrens’ arithmetic scores. Front. Hum. Neurosci 7, 1–9. December 10.3389/fnhum.2013.00844. [DOI] [PMC free article] [PubMed] [Google Scholar]
- Mazaika PK, Whitfield-Gabrieli S, Reiss AL, 2007. Artifact repair of fMRI data from high motion clinical subjects. Neuroimage 36 (Suppl. 1), S142. [Google Scholar]
- Menon V, 2015. A neurodevelopmental perspective on the role of memory systems in children’s math learning In: Daniel KMK, Berch B, Geary David Cyril (Eds.), Development of Mathematical Cognition-Neural Substrates and Genetic Influences. Elsevier Press, pp. 79–107. [Google Scholar]
- Moeller K, Willmes K, Klein E, 2015. A review on functional and structural brain connectivity in numerical cognition. Front. Hum. Neurosci 9, 1–14. May 10.3389/fnhum.2015.00227. [DOI] [PMC free article] [PubMed] [Google Scholar]
- Nairne JS, 1990. A feature model of immediate memory. Mem. Cognit 178 (3), 251–269. [DOI] [PubMed] [Google Scholar]
- Oberauer K, Lange EB, 2008. Interference in verbal working memory: Distinguishing similarity-based confusion, feature overwriting, and feature migration. J. Mem. Lang 58 (3), 730–745. 10.1016/j.jml.2007.09.006. [DOI] [Google Scholar]
- Pinel P, Dehaene S, Rivière D, LeBihan D, 2001a. Modulation of parietal activation by semantic distance in a number comparison task. Neuroimage 14 (5), 1013–1026. 10.1006/nimg.2001.0913. [DOI] [PubMed] [Google Scholar]
- Pinel P, Dehaene S, Rivière D, LeBihan D, 2001b. Modulation of parietal activation by semantic distance in a number comparison task. Neuroimage 14 (5), 1013–1026. 10.1006/nimg.2001.0913. [DOI] [PubMed] [Google Scholar]
- Poldrack RA, 2006. Can cognitive processes be inferred from neuroimaging data? Trends Cognit. Sci 10 (2), 6–10. 10.1016/j.tics.2005.12.004. [DOI] [PubMed] [Google Scholar]
- Prado Jerome, Mutreja R, Zhang H, Mehta R, Desroches AS, Minas Jennifer E., Booth JR, 2011. Distinct representations of subtraction and multiplication in the neural systems for numerosity and language. Hum. Brain Mapp 32, 1932–1947. 10.1002/hbm.21159. [DOI] [PMC free article] [PubMed] [Google Scholar]
- Prado J, Mutreja R, Booth JR, 2014. Developmental dissociation in the neural responses to simple multiplication and subtraction problems. Dev. Sci 17 (4), 537–552. 10.1111/desc.12140. [DOI] [PMC free article] [PubMed] [Google Scholar]
- Price GR, Wilkey ED, Yeo DJ, Cutting LE, 2016. The relation between 1st grade grey matter volume and 2nd grade math competence. Neuroimage 124, 232–237. 10.1016/j.neuroimage.2015.08.046. [DOI] [PMC free article] [PubMed] [Google Scholar]
- Ritchie SJ, Bates TC, 2013. Enduring links from childhood mathematics and reading achievement to adult socioeconomic status. 10.1177/0956797612466268. [DOI] [PubMed] [Google Scholar]
- Rivera SM, Reiss AL, Eckert MA, Menon V, 2005. Developmental changes in mental Arithmetic : evidence for increased functional specialization in the left inferior parietal cortex. Cerebr. Cortex 15, 1779–1790. 10.1093/cercor/bhi055. [DOI] [PubMed] [Google Scholar]
- Rose H, 2006. Do gains in test scores explain labor market outcomes ? Econ. Educ. Rev 25, 430–446. 10.1016/j.econedurev.2005.07.005. [DOI] [Google Scholar]
- Siegler RS, 1988. Strategy choice procedures and the development of multiplication skill. J. Exp. Psychol. Gen 117 (3), 258–275. [DOI] [PubMed] [Google Scholar]
- Siegler RS, 1996. Emerging Minds: the Process of Change in Children’s Thinking. Oxford Uni), New York. [Google Scholar]
- Simon O, Mangin JF, Cohen L, Le Bihan D, Dehaene S, 2002. Topographical layout of hand, eye, calculation, and language-related areas in the human parietal lobe. Neuron 33 (3), 475–487. 10.1016/S0896-6273(02)00575-5. [DOI] [PubMed] [Google Scholar]
- De Smedt B, Holloway ID, Ansari D, 2011. NeuroImage Effects of problem size and arithmetic operation on brain activation during calculation in children with varying levels of arithmetical fluency. Neuroimage 57 (3), 771–781. 10.1016/j.neuroimage.2010.12.037. [DOI] [PubMed] [Google Scholar]
- Soltanlou M, Artemenko C, Dresler T, Haeussinger FB, Fallgatter AJ, Ehlis AC, Nuerk HC, 2017. Increased arithmetic complexity is associated with domain-general but not domain-specific magnitude processing in children: a simultaneous fNIRS-EEG study. Cognit. Affect Behav. Neurosci 17 (4), 724–736. 10.3758/s13415-017-0508-x. [DOI] [PubMed] [Google Scholar]
- Soltanlou M, Artemenko C, Ehlis AC, Huber S, Fallgatter AJ, Dresler T, Nuerk HC, 2018. Reduction but no shift in brain activation after arithmetic learning in children: a simultaneous fNIRS-EEG study. Sci. Rep 8 (1), 1–15. 10.1038/s41598-018-20007-x. [DOI] [PMC free article] [PubMed] [Google Scholar]
- Weschler D, 1999. Weschler Abbreviated Scale of Intelligence. The Psyc), New York, NY. [Google Scholar]
- Woodcock RW, McGrew KS, Mather N, 2001. Woodcock-Johnson III Tests of Achievement. Riverside Publishing, Itasca. [Google Scholar]
- Wu SS, Chang TT, Majid A, Caspers S, Eickhoff SB, 2009. Functional heterogeneity of inferior parietal cortex during mathematical cognition assessed with cytoarchitectonic probability maps, (december). 10.1093/cercor/bhp063. [DOI] [PMC free article] [PubMed] [Google Scholar]
- Zamarian L, Ischebeck A, Delazer M, 2009a. Neuroscience and Biobehavioral Reviews Neuroscience of learning arithmetic — evidence from brain imaging studies. Neurosci. Biobehav. Rev 33, 909–925. 10.1016/j.neubiorev.2009.03.005. [DOI] [PubMed] [Google Scholar]
- Zamarian L, Ischebeck A, Delazer M, 2009b. Neuroscience of learning arithmetic — evidence from brain imaging studies. Neurosci. Biobehav. Rev 33, 909–925. 10.1016/j.neubiorev.2009.03.005. [DOI] [PubMed] [Google Scholar]
- Zhou Xinlin, Chen Chuansheng, Zang Yufeng, Dong Qi, Chen C, Qiao Sibing,Gong Q, 2007. Dissociated brain organization for single-digit addition and multiplication. Neuroimage 35, 871–880. 10.1016/j.neuroimage.2006.12.017. [DOI] [PubMed] [Google Scholar]