

Abstract
Food toxicity assessment was made for frequently consumed canned foods in Nigeria in order to estimate potential human health risks associated with their consumption. Levels of heavy metals (Pb, Cd, As, Fe, Mn and Zn), Nitrate and Nitrite, pH and salt were assessed in randomly purchased samples from groceries stores to represent what is readily available on the market. Nitrates and nitrites were assessed using a Perkin-Elmer spectrophotometer while heavy metal levels were determined using Atomic absorption spectrophotometer. Human health risk was estimated using standard indices; estimated daily intake (EDI), target hazard quotient (THQ), hazard index (HI) and dietary exposure (DE). Results showed varying concentrations of nitrates, nitrites, heavy metals, in all the canned food categories but the level of salt and pH seemed constant. Nitrate, Fe and Cd in all the canned food categories exceeded recommended limit set by EU. Health risk estimations showed EDI values for Cd in all the canned food categories above the tolerable daily intake, while DE for Fe in canned sweet corn, Fe, Zn and Pb in canned beans/peas had values above recommended limits. THQ values for all the canned foods were above 1 in the canned beans/peas while HI was above 1 in the canned fish category. The study revealed the potential for Cd toxicity and risk of non-carcinogenic health effects from canned beans/peas consumption. Constant monitoring of canned foods is therefore imperative considering the growing demand for canned products due to changing lifestyle.
Keywords: Food toxicity, Metals, Nitrate, Nitrite, Canned food, Health risk
Introduction
Canned foods are considered as safe foods due to certain attributes accrued to them; that is, they are easy to prepare at home, have long shelf life and are quite economical. However, varying concentrations of contamination has been reported in these canned foods [1, 2]. The possible contaminants which could be chemical hazards in foods include food additives, environmental contaminants such as mercury, dioxins and residues of heavy metals, pesticides and veterinary drugs. These chemicals may pose long-term adverse effects on public health [3]. Consequently, information about levels of food additives such as nitrates and nitrites compounds in canned foods as it relates to dietary intake is imperative to avert health risks associated with consumption. Nigeria also falls among the league of Nations who patronize canned foods but there is limited information on the levels of contamination likely present in these canned foods marketed in Nigeria, making the scope of this study a pilot one. More worrisome is the lack of information on health risks associated with consumption. The objectives of the study was therefore to assess the levels of food additives (Nitrite and Nitrate, Na and Cl) heavy metals (Pb, Cd, As, Fe, Mn and Zn), and pH in canned foods frequently consumed in Nigeria, to estimate human health risks associated with consumption.
Materials and methods
Sample collection
A total of 100 samples of canned foods made of different brands and manufacturers were purchased from local supermarkets in Benin City, Nigeria. The canned foods were preserved on the shelf at room temperature (~ 24 °C) for about 7 days prior to the experiment. They were grouped into four categories: fish, meat, beans/peas and sweet corn. Five brands were obtained for each canned category with five replicate per product type. Each can was assigned a sample code and the details on the packaging were recorded as; Brand Name, Date of manufacture, Best before Date, Trade Name, National Agency for Food and Drug Administration and Control (NAFDAC) Reg. No., Country of Origin.
Sample preparation and analysis
All reagents sued for analysis were purchased from Sigma Aldrich (Germany). The cans were opened and transferred into the labelled sterile sample containers prior to digestion, the samples were homogenized. The principle is that the quarter taken for analysis should be a representative of the whole [4].
Heavy metal and Na analysis began by wet digestion of food was performed with nitric acid—perchloric acid—sulphuric acid (HNO3–HClO4–H2SO4). One-fifth of the sample material (0.2 g) was weighed into the beaker and 10 ml of nitric acid was added, followed by 5 ml of perchloric acid and 10 ml of sulphuric acid. A small glass funnel was inserted to act as a reflux condenser and the mixture was heated for 15–30 min at 150 °C until a dense white fume is noticed and a colourless solution was obtained. It was removed from the block and cooled to about 100 °C. The solution was filtered into a 100 ml volumetric flask and diluted to the mark with water. The blank was prepared with same procedure but without samples and the Heavy Metals content was read off using Atomic Absorption Spectrophotometer (AAS) (UNICAM 696, England, UK) [5].
Nitrates and Nitrites were analysed using a Perkin-Elmer spectrophotometer (LAMBDA 25, CT, USA). Ten millimetre of the filtrate was pipetted into a 50 ml flask; 2 ml of Brucine was added followed immediately by 10 ml of conc. H2SO4. The beaker was stirred gently to allow for thorough mixing and it was allowed to stand for 10 min. The standard was treated similarly and the samples were read spectrophotometrically.
Determination of pH
This is done using HANNA pH Meter (HI 9813-6, Woonsocket, RI, USA). The meter is switched on and allowed to stabilise for 10 min. Then calibrate the pH meter by immersing the Probe in the Buffers solutions 4, 7 and 10. Rinse the probe and immerse in the sample solution and the pH is read.
Determination of chloride
Ten millimetre of the filtrate was pipetted into a 250 ml conical flask, 1 ml or 3 drops of K2CrO4 was added and titrated with standard 0.05 M HCl until a slight red precipitate occurs. The blank, 9 ml of the K2CrO4 indicator and 10 ml of 20 ppm Cl− were treated similarly.
Determination of nitrate
Ten millimetre of the filtrate was pipetted into a 50 ml flask; 2 ml of Brucine was added followed immediately by 10 ml of conc. H2SO4. The beaker was stirred gently to allow for thorough mixing and it was allowed to stand for 10 min. The standard was treated similarly and the samples were read spectrophotometrically at 470 nm.
Determination of nitrite
Ten millimetre of the filtrate was pipetted into a 50 ml flask, 2 ml of 2 M HCl was added and diluted with water to 30 ml. 2 ml of sulphanilic acid was then added and stirred and allowed to stand for 5 min. The standards were treated in a similar manner as the samples. Colour development occurred after a few minutes, and the absorbance were read spectrophotometrically at 520 nm after 20 min.
Health risk assessment
Average estimated daily intake (EDI)
EDI was calculated using the following equation, which is recommended by the US EPA [6].
where EDI is the average daily intake or dose through ingestion (mg kg−1 bw day−1); C is the heavy metal concentration in the exposure medium (mg l−1 or mg kg−1); IR is the ingestion rate (l day−1, or kg day−1); EF is the exposure frequency (365 days/year); ED is the exposure duration (54 years, equivalent to the average lifespan); BW is the body weight (kg) and AT is the time period over which the dose is averaged (365 days/year × number of exposure years, assumed to be 54 years in this study).
Target hazard quotient
The human health risk posed by contaminant exposure are usually characterized by the target hazard quotient (THQ) [6], the ratio of the average estimated daily intake (EDI) resulting from exposure compared to the reference dose (RfD) for an individual pathway and chemical. Oral reference dose obtained from the Integrated Risk Information System [7] is an estimation of maximum permissible risk to a human population through daily exposure when taking into consideration a sensitive group during a lifetime. The applied RfD for Cd, Pb, Cu and Zn was 1.0, 4.0, 40, 300 mg kg−1 day−1, respectively. The THQ based on non-cancer toxic risk was determined by;
If the value of THQ is less than 1, the risk of non-carcinogenic toxic effects is assumed to be low. When it exceeds 1, there may be concerns for potential health risks associated with overexposure.
To assess the overall potential risk of adverse health effects posed by more than one metal, the THQs can be summed across contaminants to generate a hazard index (HI) to estimate the risk of a mixture of contaminants. The HI refers to the sum of more than one THQ for multiple substances and/or multiple exposure pathways.
In the present study, the HI was used as a screening value to identify whether there is significant risk caused by heavy metals through average dietary consumption of canned foods.
Dietary exposure
A dietary exposure assessment was calculated by multiplying consumption data with data on the concentration of chemicals in food [8]. It is expressed as;
where FCC = food chemical concentration, FCR = Food consumption rate [7].
Statistical analysis
All data were subjected to one-way analysis of variance (ANOVA) using XL Stat program for windows. The level of significance was chosen at p < 0.05 and the results are presented as mean ± standard error. Graphs were plotted using GraphPad Prism7.04.
Results
The mean and standard error (mean ± SE) for canned fish showed variation across the different canned food sampled as showed in Table 1. The pH values ranged from 5.48 ± 0.12 to 5.66 ± 0.05. Na ranged from 3.88 ± 2.1 to 445.08 ± 41.54 mg kg−1, nitrite and nitrate ranged from 21.1 ± 3.69 to 31.04 ± 2.95 mg kg−1 and 54.22 ± 9.52 to 79.8 ± 7.58 mg kg−1 respectively. These values were not found to be significant at p > 0.05. Fe, Zn and Pb were found to be significant (p < 0.05) and the values ranged from 161.78 ± 16.44 to 245.7 ± 3.09 mg kg−1, 15.72 ± 3.49 to 60.2 ± 12.61 mg kg−1 and 0.09 ± 0.04 to 0.17 ± 0.08 mg kg−1 respectively. Mn and Cd were found to be non-significant. Arsenic was not detected all through the canned groups.
Table 1.
Summary of data from the analysis of canned fish
| Canned fish | ||||||||||||||||||
|---|---|---|---|---|---|---|---|---|---|---|---|---|---|---|---|---|---|---|
| Parameters mg/kg | Product type A | Product type B | Product type C | Product type D | Product type E | p value | Standard | References | ||||||||||
| Mean ± SE | Min | Max | Mean ± SE | Min | Max | Mean ± SE | Min | Max | Mean ± SE | Min | Max | Mean ± SE | Min | Max | ||||
| pH | 5.66 ± 0.05 | 5.5 | 5.8 | 5.64 ± 0.09 | 5.3 | 5.8 | 5.48 ± 0.12 | 5.2 | 5.8 | 5.5 ± 0.05 | 5.4 | 5.6 | 5.58 ± 0.12 | 5.3 | 5.9 | > 0.05 | 5.70–6.60 | [9] |
| Na | 416.4 ± 8.08 | 393.4 | 442 | 399.98 ± 14.18 | 358.4 | 439.2 | 388.3 ± 2.1 | 358.8 | 448.9 | 428.3 ± 41.58 | 324.9 | 568.8 | 445.08 ± 41.54 | 348.2 | 598.5 | > 0.05 | ||
| NO2 | 29.98 ± 2.98 | 21.1 | 37 | 31.04 ± 2.95 | 21.6 | 38.6 | 30.22 ± 2.1 | 25 | 35.2 | 21.1 ± 3.69 | 9.7 | 30.9 | 30.82 ± 3.76 | 18.9 | 39.1 | > 0.05 | 50 mg/kg | [10] |
| NO3 | 77.2 ± 7.59 | 54.8 | 95.2 | 79.8 ± 7.58 | 55.6 | 99.2 | 77.74 ± 5.39 | 64.3 | 90.5 | 54.22 ± 9.52 | 24.8 | 79.6 | 79.04 ± 9.67 | 48.7 | 100.6 | > 0.05 | 50 mg/kg | [10] |
| Fe | 228.2 ± 17.93 | 172.2 | 282.5 | 161.78 ± 16.44 | 124.7 | 216.7 | 245.7 ± 3.09 | 235.6 | 252.5 | 170.4 ± 27.34 | 112.9 | 262.3 | 216.1 ± 9.42 | 184.3 | 233.1 | < 0.01 | ||
| Mn | 1.97 ± 0.80 | 0 | 4.7 | 1.44 ± 0.34 | 0.7 | 2.41 | 2.03 ± 0.54 | 0.89 | 4.05 | 2.02 ± 0.53 | 0.73 | 3.79 | 2.66 ± 0.38 | 1.76 | 3.82 | > 0.05 | ||
| Zn | 48.14 ± 9.45 | 21 | 73.1 | 60.2 ± 12.61 | 35.6 | 100.8 | 39.8 ± 11.29 | 13.4 | 76.4 | 15.72 ± 3.49 | 10.2 | 29.4 | 34.36 ± 7.92 | 10.6 | 56.4 | < 0.05 | ||
| Cd | 0.18 ± 0.05 | 0.05 | 0.35 | 0.084 ± 0.02 | 0.04 | 0.15 | 0.06 ± 0.06 | 0 | 0.3 | 0.13 ± 0.08 | 0 | 0.4 | 0.13 ± 0.08 | 0 | 0.34 | > 0.05 | 0.1 μg/g | [11] |
| Pb | 0.17 ± 0.08 | 0.05 | 0.45 | 0.09 ± 0.04 | 0 | 0.2 | 0 | 0 | 0 | 0 | 0 | 0 | 0 | 0 | 0 | < 0.05 | 0.30 mg/kg | [11] |
| As | ND | ND | ND | ND | ND | ND | ND | ND | ND | ND | ND | ND | ND | ND | ND | – | ||
| Cl | 93.7 ± 1.83 | 88.5 | 99.5 | 89.98 ± 3.19 | 80.6 | 98.8 | 87.38 ± 3.51 | 80.7 | 101 | 96.36 ± 9.34 | 73.1 | 127.9 | 100.16 ± 9.36 | 78.3 | 134.7 | > 0.05 | ||
Na, Fe, Mn, Zn standards are available as Recommended Maximum daily intake. p < 0.05, significant, p < 0.001, Highly significant, p > 0.05, no significance
ND below detected limit
Canned meat had pH values ranging from 5.24 ± 0.11 to 5.7 ± 0.13. Na ranged from 432.4 ± 41.32 to 478.48 ± 43.25 mg kg−1, NO2 and NO3 ranged from 27.04 ± 3.94 to 33.26 ± 1.71 mg kg−1 and 69.58 ± 10.14 to 86.1 ± 4.49 mg kg−1 respectively. These parameters were not significantly different at p > 0.05 across the product types. Similar significance occurred for Zn, Pb and Cl with values ranging from 36.12 ± 11.51 to 68.94 ± 17.09 mg kg−1, 0 to 0.16 ± 0.04 mg kg−1 and 97.4 ± 8.63 to 107.66 ± 9.73 mg kg−1. However, the values of Fe, Mn, and Cd showed significant level of difference when assessed across the canned beef products samples which ranged from 205.28 ± 8.13 to 303.08 ± 11.57 mg kg−1, 2.46 ± 0.43 to 4.64 ± 0.47 mg kg−1 and 0 to 0.22 ± 0.07 mg kg−1 respectively. This is shown in Table 2.
Table 2.
Summary of data from the analysis of canned meat
| Canned meat | ||||||||||||||||||
|---|---|---|---|---|---|---|---|---|---|---|---|---|---|---|---|---|---|---|
| Parameters mg/kg | Product type A | Product type B | Product type C | Product type D | Product type E | p value | Standard | References | ||||||||||
| Mean ± SE | Min | Max | Mean ± SE | Min | Max | Mean ± SE | Min | Max | Mean ± SE | Min | Max | Mean ± SE | Min | Max | ||||
| Ph | 5.24 ± 0.11 | 4.9 | 5.5 | 5.26 ± 0.07 | 5.1 | 5.5 | 5.68 ± 0.06 | 5.5 | 5.8 | 5.7 ± 0.13 | 5.3 | 5.9 | 5.58 ± 0.13 | 5.1 | 5.8 | > 0.05 | 6.6 | |
| Na | 432.4 ± 41.32 | 312.6 | 565 | 478.48 ± 43.25 | 401.2 | 593.3 | 432.9 ± 38.37 | 357.2 | 573.1 | 469.06 ± 14.88 | 430.3 | 514.8 | 473.24 ± 14.05 | 431.8 | 520 | > 0.05 | ||
| NO2 | 28.44 ± 3.45 | 20.2 | 38.4 | 27.52 ± 3.03 | 20.3 | 38.2 | 33.26 ± 1.71 | 28.9 | 38 | 32.54 ± 2.78 | 26.6 | 42.2 | 27.04 ± 3.94 | 14.2 | 36.5 | > 0.05 | 50 mg/kg | [10] |
| NO3 | 73.1 ± 8.88 | 51.9 | 98.7 | 70.82 ± 7.8 | 52.2 | 98.3 | 86.1 ± 4.49 | 74.2 | 97.7 | 83.68 ± 7.13 | 68.4 | 108.5 | 69.58 ± 10.14 | 36.5 | 93.9 | > 0.05 | 50 mg/kg | [10] |
| Fe | 270.28 ± 22.99 | 204.1 | 320.9 | 259.24 ± 10.23 | 229.3 | 284.8 | 303.08 ± 11.57 | 278.8 | 332.4 | 205.28 ± 8.13 | 177.9 | 223.4 | 220.72 ± 15.32 | 187.5 | 275.8 | < 0.001 | ||
| Mn | 2.46 ± 0.43 | 1.81 | 4.09 | 3.27 ± .36 | 2.27 | 4.38 | 2.73 ± 0.48 | 1.48 | 4.24 | 4.02 ± 0.41 | 2.74 | 5.27 | 4.64 ± 0.47 | 3.85 | 6.43 | < 0.01 | ||
| Zn | 36.4 ± 6.18 | 22.6 | 53.8 | 36.12 ± 11.51 | 11.2 | 67.6 | 46.46 ± 8.29 | 16.8 | 63.4 | 68.94 ± 17.09 | 30.1 | 117.8 | 53.24 ± 14.12 | 19.2 | 95.2 | > 0.05 | ||
| Cd | 0.19 ± 0.08 | 0 | 0.4 | 0.03 ± 0.03 | 0 | 0.15 | 0.08 ± 0.08 | 0 | 0.4 | 0 | 0 | 0 | 0.22 ± 0.07 | 0.05 | 0.4 | < 0.05 | 0.05 μg/g | [12] |
| Pb | 0 | 0 | 0 | 0 | 0 | 0 | 0 | 0 | 0 | 0.08 ± 0.08 | 0 | 0.4 | 0.16 ± 0.04 | 0.06 | 0.3 | < 0.05 | 0.10 mg/kg | [12] |
| As | ND | ND | ND | ND | ND | ND | ND | ND | ND | ND | ND | ND | ND | ND | ND | – | ||
| Cl | 97.26 ± 9.3 | 70.3 | 127.1 | 107.66 ± 9.73 | 90.3 | 133.5 | 97.4 ± 8.63 | 80.4 | 128.9 | 105.54 ± 3.35 | 96.8 | 115.8 | 106.48 ± 3.16 | 97.2 | 117 | > 0.05 | ||
Na, Fe, Mn, Zn standards are available as Recommended Maximum daily intake. p < 0.05, significant, p < 0.001, Highly significant, p > 0.05, no significance
ND below detected limit
The results from canned beans/peas as shown in Table 3 revealed that pH values ranged from 5.02 ± 0.02 to 5.72 ± 0.05. This range in pH values were found to be highly significant (p < 0.001). Na ranged from 332.6 ± 45.08 to 458.72 ± 22.14 mg kg−1 with no significant difference (p > 0.05). Same trend of significance was observed for Mn (3.43 ± 0.31 to 4.84 ± 0.4 mg kg−1), Zn (50.74 ± 4.79 to 87.26 ± 22.31 mg kg−1) and Pb (0 to 0.15 ± 0.04 mg kg−1). NO3 was highly significant (p < 0.001) in the canned beef products (69.46 ± 4.08 to 93.92 mg kg−1) but NO2 was significant (p < 0.01) with ranged values of 27.02 ± 1.89 to 36.54 ± 1.45 mg kg−1. The ANOVA analyses for Fe and Cd in the canned products was found to be significant (p < 0.05) with ranged values of 130.68 ± 1.74 to 191.02 ± 22.25 mg kg−1 and 0 to 0.29 ± 0.05 mg kg−1.
Table 3.
Summary of data from the analysis of canned beans/peas
| Canned beans/peas | ||||||||||||||||||
|---|---|---|---|---|---|---|---|---|---|---|---|---|---|---|---|---|---|---|
| Parameters mg/kg | Product type A | Product type B | Product type C | Product type D | Product type E | p value | STANDARD | References | ||||||||||
| Mean ± SE | Min | Max | Mean ± SE | Min | Max | Mean ± SE | Min | Max | Mean ± SE | Min | Max | Mean ± SE | Min | Max | ||||
| pH | 5.25 ± 0.09 | 4.9 | 5.4 | 5.72 ± 0.04 | 5.6 | 5.8 | 5.58 ± 0.06 | 5.5 | 5.8 | 5.68 ± 0.05 | 5.5 | 5.8 | 5.02 ± 0.02 | 5 | 5.1 | < 0.001 | 5.70–6.00 | [9] |
| Na | 406.84 ± 46.93 | 298.6 | 549.1 | 332.6 ± 45.08 | 153.8 | 386.3 | 404.82 ± 27.84 | 317 | 480.5 | 413.98 ± 30.18 | 324.8 | 493.1 | 458.72 ± 22.14 | 378 | 509.2 | > 0.05 | ||
| NO2 | 34.68 ± 1.67 | 28.9 | 39.1 | 34.28 ± 1.89 | 29.3 | 38.2 | 36.54 ± 1.45 | 30.8 | 38.5 | 35.32 ± 1.09 | 32.9 | 39.4 | 27.02 ± 1.59 | 21.9 | 31.5 | < 0.01 | 50 mg/kg | [10] |
| NO3 | 89.14 ± 4.26 | 74.4 | 100.4 | 91.48 ± 4.09 | 75.4 | 98.3 | 93.92 ± 3.73 | 79.2 | 98.9 | 90.82 ± 2.8 | 84.6 | 101.3 | 69.46 ± 4.08 | 56.3 | 80.9 | < 0.001 | 50 mg/kg | [10] |
| Fe | 137.74 ± 4.83 | 120.6 | 147.5 | 187.1 ± 20.96 | 138.1 | 261.9 | 175.1 ± 6.92 | 157.7 | 196.4 | 130.68 ± 1.74 | 126.6 | 135.3 | 191.02 ± 22.25 | 137.8 | 244.9 | < 0.05 | ||
| Mn | 3.9 ± 0.37 | 2.54 | 4.74 | 3.86 ± 0.51 | 2.49 | 5.21 | 4.62 ± 0.19 | 4.16 | 5.29 | 3.43 ± 0.31 | 2.18 | 3.85 | 4.84 ± 0.4 | 3.36 | 5.72 | > 0.05 | ||
| Zn | 50.74 ± 4.79 | 33.6 | 63.1 | 87.26 ± 22.31 | 38.3 | 171.2 | 57.2 ± 11.05 | 29.4 | 78.2 | 70.42 ± 12.54 | 37.6 | 102.2 | 57.52 ± 10.09 | 34.6 | 82.4 | > 0.05 | ||
| Cd | 0.2 ± 0.07 | 0.05 | 0.4 | 0.18 ± 0.08 | 0 | 0.35 | 0 | 0 | 0 | 0.13 ± 0.06 | 0 | 0.3 | 0.29 ± 0.05 | 0.15 | 0.4 | < 0.05 | 0.05 μg/g | [12] |
| Pb | 0.01 ± 0.01 | 0 | 0.07 | 0 | 0 | 0 | 0 | 0 | 0 | 0.1 ± 0.05 | 0 | 0.24 | 0.15 ± 0.04 | 0.05 | 0.25 | < 0.01 | 0.20 mg/kg | [12] |
| As | ND | ND | ND | ND | ND | ND | ND | ND | ND | ND | ND | ND | ND | ND | ND | – | ||
| Cl | 91.54 ± 10.57 | 67.2 | 123.6 | 74.84 ± 10.14 | 34.6 | 86.9 | 91.08 ± 6.26 | 71.3 | 108.1 | 93.1 ± 6.81 | 72.9 | 110.9 | 103.22 ± 4.97 | 85.1 | 114.6 | > 0.05 | ||
Na, Fe, Mn, Zn standards are available as Recommended Maximum daily intake. p < 0.05, significant, p < 0.001, Highly significant, p > 0.05, no significance
ND Below detected limit
Canned sweet corn recorded most of the highest values when assessed as shown in Table 4. The pH ranged from 5.84 ± 0.03 to 6.16 ± 0.07 and was highly significant across the products sampled (p < 0.001). Na, Fe and Cl values ranged from 378.56 ± 15 to 497.58 ± 42.35, 140.28 ± 31.89 to 194.06 ± 5.71 and 85.16 ± 3.38 to 111.96 ± 9.53 respectively but showed no significant difference (p > 0.05). Cd (0 to 0.05 ± 0.04) was found to be highly significant (p < 0.001) across the products sampled. Other parameters sampled showed significant difference (p < 0.05) across the products with NO2 ranging from 27.34 ± 1.79 to 35.2 ± 2.27, NO3 (70.34 ± 4.6 to 90.78 ± 5.73), Mn (3.89 ± 0.53 to 6.3 ± 0.35), Zn (51.76 ± 10.54 to 91.88 ± 3.95), and Pb ranged from 0 to 0.14 ± 0.03.
Table 4.
Summary of data from the analysis of canned sweet corn
| Canned sweet corn | ||||||||||||||||||
|---|---|---|---|---|---|---|---|---|---|---|---|---|---|---|---|---|---|---|
| Parameters mg/kg | Product type A | Product type B | Product type C | Product type D | Product type E | p value | Standard | References | ||||||||||
| mean ± SE | Min | Max | mean ± SE | Min | Max | mean ± SE | Min | Max | mean ± SE | Min | Max | mean ± SE | Min | Max | ||||
| pH | 6.1 ± 0.03 | 6 | 6.2 | 6.16 ± 0.07 | 5.9 | 6.3 | 5.92 ± 0.02 | 5.9 | 6 | 6.04 ± 0.04 | 5.9 | 6.1 | 5.84 ± 0.03 | 5.8 | 5.9 | < 0.001 | 5.90–6.50 | [9] |
| Na | 378.56 ± 15 | 329.5 | 407.6 | 412.16 ± 16.01 | 371.8 | 464 | 497.58 ± 42.35 | 431.4 | 664 | 431.68 ± 39.9 | 328 | 567.4 | 448.04 ± 16.49 | 397.1 | 487.3 | > 0.05 | ||
| NO2 | 34.3 ± 1.61 | 28.7 | 37.6 | 30.6 ± 2.09 | 23 | 35.4 | 27.34 ± 1.79 | 22.1 | 31.6 | 32.84 ± 1.16 | 28.7 | 35.5 | 35.2 ± 2.27 | 28.8 | 41.6 | < 0.05 | 50 mg/kg | [10] |
| NO3 | 88.16 ± 4.11 | 73.9 | 96.6 | 78.74 ± 5.36 | 59.2 | 91 | 70.34 ± 4.6 | 56.9 | 81.3 | 84.44 ± 2.96 | 73.9 | 91.4 | 90.78 ± 5.73 | 74.1 | 107 | < 0.05 | 50 mg/kg | [10] |
| Fe | 163 ± 4.56 | 148.5 | 174.5 | 169.2 ± 16.1 | 130.1 | 213.6 | 140.28 ± 31.89 | 17.9 | 201.2 | 166.74 ± 6.31 | 149.3 | 181.9 | 194.06 ± 5.71 | 183.2 | 215.8 | > 0.05 | 15µ/g | [13] |
| Mn | 4.89 ± 0.44 | 3.56 | 5.88 | 3.89 ± 0.53 | 2.63 | 5.76 | 6.3 ± 0.35 | 5.6 | 7.25 | 5.95 ± 0.36 | 5.23 | 7.05 | 5.65 ± 0.32 | 4.94 | 6.73 | < 0.01 | ||
| Zn | 53.52 ± 6.96 | 31.2 | 74.8 | 51.76 ± 10.54 | 24.6 | 89.4 | 69.72 ± 12.66 | 36.2 | 112.6 | 91.88 ± 3.95 | 81.4 | 102.6 | 63.4 ± 2.74 | 56.6 | 69.8 | < 0.05 | ||
| Cd | 0.23 ± 0.04 | 0.1 | 0.35 | 0 | 0 | 0 | 0 | 0 | 0 | 0.05 ± 0.03 | 0 | 0.15 | 0.04 ± 0.03 | 0 | 0.15 | < 0.001 | 0.05 μg/g | [12] |
| Pb | 0.14 ± 0.03 | 0.06 | 0.24 | 0 | 0 | 0 | 0 | 0 | 0 | 0.05 ± 0.04 | 0 | 0.2 | 0.06 ± 0.05 | 0 | 0.25 | < 0.05 | 0.20 mg/kg | [12] |
| As | ND | ND | ND | ND | ND | ND | ND | ND | ND | ND | ND | ND | ND | ND | ND | – | ||
| Cl | 85.16 ± 3.38 | 74.1 | 91.7 | 92.74 ± 3.6 | 83.7 | 104.4 | 111.96 ± 9.53 | 97.1 | 149.4 | 97.14 ± 8.98 | 73.8 | 127.7 | 100.82 ± 3.7 | 89.4 | 109.6 | > 0.05 | ||
Na, Fe, Mn, Zn standards are available as Recommended Maximum daily intake. p < 0.05, significant, p < 0.001, Highly significant, p > 0.05, no significance
ND below detected limit
Correlation coefficient matrices
In this study, the correlation coefficient matrix was used to show the linear strength and direction of the variables analysed which is shown in Tables 5, 6, 7 and 8 below. The result for canned fish revealed that pH strongly correlated with Zn (r = 0.7132) and Pb (r = 0.8519). Na correlated strongly with Mn (r = 0.7101) and Cl (r = 1). NO2 correlated strongly with NO3 (r = 0.9999) and Zn (r = 0.8205). NO3 correlated strongly with Zn (r = 0.8242), Mn with Cl (r = 0.7115), Zn with Pb (r = 0.6497), Cd with Pb (r = 5469) and Cl (r = 0.6391).
Table 5.
Correlation coefficient matrix for canned fish
| pH | Na | NO2 | NO3 | Fe | Mn | Zn | Cd | Pb | Cl | |
|---|---|---|---|---|---|---|---|---|---|---|
| pH | 1.0000 | |||||||||
| Na | 0.1152 | 1.0000 | ||||||||
| NO2 | 0.5092 | − 0.2922 | 1.0000 | |||||||
| NO3 | 0.5111 | − 0.2996 | 0.9999 | 1.0000 | ||||||
| Fe | − 0.1736 | − 0.1604 | 0.4460 | 0.4482 | 1.0000 | |||||
| Mn | − 0.2861 | 0.7101 | − 0.0073 | − 0.0142 | 0.4935 | 1.0000 | ||||
| Zn | 0.7132 | − 0.5237 | 0.8205 | 0.8242 | 0.0351 | − 0.5504 | 1.0000 | |||
| Cd | 0.5136 | 0.6388 | − 0.1963 | − 0.1952 | 0.0385 | 0.2919 | − 0.1728 | 1.0000 | ||
| Pb | 0.8519 | − 0.1853 | 0.3438 | 0.3508 | 0.0181 | − 0.4691 | 0.6497 | 0.5469 | 1.0000 | |
| Cl | 0.1154 | 1.0000 | − 0.2906 | − 0.2980 | − 0.1580 | 0.7115 | − 0.5232 | 0.6391 | − 0.1850 | 1 |
Table 6.
Correlation coefficient matrix for canned meat
| pH | Na | NO2 | NO3 | Fe | Mn | Zn | Cd | Pb | Cl | |
|---|---|---|---|---|---|---|---|---|---|---|
| pH | 1.0000 | |||||||||
| Na | 0.0304 | 1.0000 | ||||||||
| NO2 | 0.7013 | − 0.4176 | 1.0000 | |||||||
| NO3 | 0.7026 | − 0.4251 | 0.9997 | 1.0000 | ||||||
| Fe | − 0.2585 | − 0.7297 | 0.2042 | 0.2229 | 1.0000 | |||||
| Mn | 0.4647 | 0.7815 | − 0.2331 | − 0.2396 | − 0.8464 | 1.0000 | ||||
| Zn | 0.8293 | 0.3272 | 0.5052 | 0.4925 | − 0.7097 | 0.6679 | 1.0000 | |||
| Cd | − 0.2332 | − 0.2835 | − 0.5608 | − 0.5545 | 0.0683 | 0.0690 | − 0.3118 | 1.0000 | ||
| Pb | 0.4708 | 0.5391 | − 0.2618 | − 0.2668 | − 0.7668 | 0.9346 | 0.6213 | 0.3768 | 1.0000 | |
| Cl | 0.0319 | 1.0000 | − 0.4163 | − 0.4238 | − 0.7293 | 0.7817 | 0.3279 | − 0.2844 | 0.5392 | 1.0000 |
Table 7.
Correlation coefficient matrix for cannedbeans/peas
| pH | Na | NO2 | NO3 | Fe | Mn | Zn | Cd | Pb | Cl | |
|---|---|---|---|---|---|---|---|---|---|---|
| pH | 1.0000 | |||||||||
| Na | − 0.7464 | 1.0000 | ||||||||
| NO2 | 0.7843 | − 0.5671 | 1.0000 | |||||||
| NO3 | 0.8386 | − 0.6836 | 0.9886 | 1.0000 | ||||||
| Fe | − 0.1852 | − 0.1116 | − 0.5066 | − 0.4251 | 1.0000 | |||||
| Mn | − 0.6074 | 0.4820 | − 0.5551 | − 0.5800 | 0.7250 | 1.0000 | ||||
| Zn | 0.6988 | − 0.7573 | 0.1615 | 0.2894 | 0.2565 | − 0.4620 | 1.0000 | |||
| Cd | − 0.6673 | 0.2783 | − 0.8244 | − 0.7858 | 0.1786 | 0.0817 | − 0.0020 | 1.0000 | ||
| Pb | − 0.5194 | 0.7510 | − 0.7664 | − 0.8082 | 0.0476 | 0.2123 | − 0.1559 | 0.5742 | 1.0000 | |
| Cl | − 0.7476 | 1.0000 | − 0.5682 | − 0.6846 | − 0.1101 | 0.4835 | − 0.7578 | 0.2791 | 0.7506 | 1.0000 |
Table 8.
Correlation coefficient matrix for sweet corn
| pH | Na | NO2 | NO3 | Fe | Mn | Zn | Cd | Pb | Cl | |
|---|---|---|---|---|---|---|---|---|---|---|
| pH | 1.0000 | |||||||||
| Na | − 0.7116 | 1.0000 | ||||||||
| NO2 | − 0.0623 | − 0.6279 | 1.0000 | |||||||
| NO3 | − 0.0725 | − 0.6198 | 0.9999 | 1.0000 | ||||||
| Fe | − 0.2225 | − 0.3387 | 0.8215 | 0.8281 | 1.0000 | |||||
| Mn | − 0.7530 | 0.7105 | − 0.1625 | − 0.1600 | − 0.2556 | 1.0000 | ||||
| Zn | − 0.2804 | 0.3997 | − 0.0621 | − 0.0637 | − 0.1272 | 0.7199 | 1.0000 | |||
| Cd | 0.2951 | − 0.7218 | 0.5642 | 0.5555 | 0.0355 | − 0.1615 | − 0.2744 | 1.0000 | ||
| Pb | 0.1131 | − 0.6838 | 0.7469 | 0.7403 | 0.2583 | − 0.0584 | − 0.1675 | 0.9610 | 1.0000 | |
| Cl | − 0.7116 | 1.0000 | − 0.6276 | − 0.6195 | − 0.3382 | 0.7105 | 0.4001 | − 0.7223 | − 0.6841 | 1.0000 |
In canned meat, pH correlated strongly with NO2 (r = 0.7013), NO3 (r = 0.7026) and Zn (r = 0.8293), Na correlated strongly with Fe (r = − 0.7297), Mn (r = 0.7815) and Cl (r = 1), NO2 correlates strongly with NO3 (r = 0.9999) while Fe correlates strongly with Mn (r = − 0.8464), Zn (r = − 0.7097), Pb (r = -0.7668), and Cl (r = − 0.7293). Similar trend was found with Mn which correlated strongly with Zn, Pb and Cl (r = 0.6679, 0.9346 and 0.7817) respectively and Zn strongly correlated with Pb (r = 0.6213).
In canned beans/peas, the pH correlated strongly with all parameters except Fe, while Na correlated strongly with NO2 (r = − 0.5671), NO3 (r = − 0.6836), Zn (r = 0.7573), Pb (r = 0.7510) and Cl (r = 1). NO2 showed a strong correlation with NO3 (r = 0.9886), Fe (r = − 0.5066), Mn (r = − 0.5551), Cd (r = − 0.8224), Pb (r = − 0.7664) and Cl (r = − 0.5682). NO3 strongly correlated with Mn, Cd, Pb and Cl (r = − 0.5800, − 0.7858, − 0.8082, − 0.6846) respectively. Fe correlated strongly with Mn (r = 0.7250), Zn correlated strongly with Cl (r = − 0.7578), Cd with Pb (r = 0.5742) and Pb with Cl (r = 0.7506).
In Canned Sweet corn, pH correlated strongly with Na, Mn, and Cl (r = − 0.7116, − 0.7530, − 0.7116) respectively while Na correlated strongly with NO2 (r = − 0.6279), NO3 (r = − 0.6198), Mn (r = 0.7105), Cd (r = 0.7218), Pb (r = 0.6838) and Cl (r = 1). NO3 showed a positive correlation with Fe (r = 0.8281), Cd (r = 0.5555) Pb (r = 0.7403), but negatively with Cl (r = − 0.6195). Mn showed a positively strong correlation with Zn (r = 0.7199) and Cl (r = 0.7105). Cd correlated strongly with Pb (r = 0.9610) and Cl (r = − 0.7223) and Pb correlated negatively with Cl (r = − 0.6841).
Health risk indices
In this study, health risk was assessed using Estimated Daily Intake (EDI), Target Hazard Quotient (THQ), Hazard Index (HI) and Dietary Exposure (DE) indices. Tables 9, 10, 11 and 12 below shows the EDI, DE, THQ and HI of all canned groups sampled across various products types.
Table 9.
Health risk indices in canned fish
| Parameters | RfD | EDI (mg kg−1 bw day−1) | DE (mg kg−1 day−1) | THQ | HI |
|---|---|---|---|---|---|
| Product type A | |||||
| Fe | 0.7 | 0.140 | 9.813 | 0.200 | 0.661 |
| Mn | 0.14 | 0.001 | 0.085 | 0.009 | |
| Zn | 0.3 | 0.030 | 2.070 | 0.099 | |
| Cd | 0.001 | 0.000 | 0.008 | 0.111 | |
| Pb | 0.0036 | 0.000 | 0.007 | 0.029 | |
| NO3 | 1.6 | 0.047 | 3.320 | 0.030 | |
| NO2 | 0.1 | 0.018 | 1.289 | 0.184 | |
| Na | 17.905 | ||||
| Product type B | |||||
| Fe | 0.7 | 0.099 | 6.957 | 0.142 | 0.560 |
| Mn | 0.14 | 0.001 | 0.062 | 0.006 | |
| Zn | 0.3 | 0.037 | 2.589 | 0.123 | |
| Cd | 0.001 | 0.000 | 0.004 | 0.052 | |
| Pb | 0.0036 | 0.000 | 0.004 | 0.015 | |
| NO3 | 1.6 | 0.049 | 3.431 | 0.031 | |
| NO2 | 0.1 | 0.019 | 1.335 | 0.191 | |
| Na | 17.199 | ||||
| Product type C | |||||
| Fe | 0.7 | 0.151 | 10.564 | 0.216 | 0.558 |
| Mn | 0.14 | 0.001 | 0.087 | 0.009 | |
| Zn | 0.3 | 0.024 | 1.711 | 0.081 | |
| Cd | 0.001 | 0.000 | 0.003 | 0.037 | |
| Pb | 0.0036 | 0.000 | 0.000 | 0.000 | |
| NO3 | 1.6 | 0.048 | 3.343 | 0.030 | |
| NO2 | 0.1 | 0.019 | 1.299 | 0.186 | |
| Na | 16.699 | ||||
| Product type D | |||||
| Fe | 0.7 | 0.105 | 7.325 | 0.149 | 0.421 |
| Mn | 0.14 | 0.001 | 0.087 | 0.009 | |
| Zn | 0.3 | 0.010 | 0.676 | 0.032 | |
| Cd | 0.001 | 0.000 | 0.006 | 0.080 | |
| Pb | 0.0036 | 0.000 | 0.000 | 0.000 | |
| NO3 | 1.6 | 0.033 | 2.331 | 0.021 | |
| NO2 | 0.1 | 0.013 | 0.907 | 0.130 | |
| Na | 18.418 | ||||
| Product type E | |||||
| Fe | 0.7 | 0.133 | 9.292 | 0.190 | 0.571 |
| Mn | 0.14 | 0.002 | 0.114 | 0.012 | |
| Zn | 0.3 | 0.021 | 1.477 | 0.070 | |
| Cd | 0.001 | 0.000 | 0.006 | 0.080 | |
| Pb | 0.0036 | 0.000 | 0.000 | 0.000 | |
| NO3 | 1.6 | 0.049 | 3.399 | 0.030 | |
| NO2 | 0.1 | 0.019 | 1.325 | 0.189 | |
| Na | 19.138 | ||||
Table 10.
Health risk indices in canned meat
| Parameters | RfD | EDI (mg kg−1 bw day−1) | DE (mg kg−1 day−1) | THQ | HI |
|---|---|---|---|---|---|
| Product type A | |||||
| Fe | 0.7 | 0.618 | 43.245 | 0.883 | 2.389 |
| Mn | 0.14 | 0.006 | 0.394 | 0.040 | |
| Zn | 0.3 | 0.083 | 5.824 | 0.277 | |
| Cd | 0.001 | 0.000 | 0.030 | 0.434 | |
| Pb | 0.0036 | 0.000 | 0.000 | 0.000 | |
| NO3 | 1.6 | 0.167 | 11.696 | 0.104 | |
| NO2 | 0.1 | 0.065 | 4.550 | 0.650 | |
| Na | 69.184 | ||||
| Product type B | |||||
| Fe | 0.7 | 0.593 | 41.478 | 0.846 | 1.974 |
| Mn | 0.14 | 0.007 | 0.523 | 0.053 | |
| Zn | 0.3 | 0.083 | 5.779 | 0.275 | |
| Cd | 0.001 | 0.000 | 0.005 | 0.069 | |
| Pb | 0.0036 | 0.000 | 0.000 | 0.000 | |
| NO3 | 1.6 | 0.162 | 11.331 | 0.101 | |
| NO2 | 0.1 | 0.063 | 4.403 | 0.629 | |
| Na | 76.557 | ||||
| Product type C | |||||
| Fe | 0.7 | 0.693 | 48.493 | 0.990 | 2.454 |
| Mn | 0.14 | 0.006 | 0.437 | 0.045 | |
| Zn | 0.3 | 0.106 | 7.434 | 0.354 | |
| Cd | 0.001 | 0.000 | 0.013 | 0.183 | |
| Pb | 0.0036 | 0.000 | 0.000 | 0.000 | |
| NO3 | 1.6 | 0.197 | 13.776 | 0.123 | |
| NO2 | 0.1 | 0.076 | 5.322 | 0.760 | |
| Na | 69.264 | ||||
| Product type D | |||||
| Fe | 0.7 | 0.469 | 32.845 | 0.670 | 2.175 |
| Mn | 0.14 | 0.009 | 0.643 | 0.066 | |
| Zn | 0.3 | 0.158 | 11.030 | 0.525 | |
| Cd | 0.001 | 0.000 | 0.000 | 0.000 | |
| Pb | 0.0036 | 0.000 | 0.013 | 0.051 | |
| NO3 | 1.6 | 0.191 | 13.389 | 0.120 | |
| NO2 | 0.1 | 0.074 | 5.206 | 0.744 | |
| Na | 75.050 | ||||
| Product type E | |||||
| Fe | 0.7 | 0.505 | 35.315 | 0.721 | 2.527 |
| Mn | 0.14 | 0.011 | 0.742 | 0.076 | |
| Zn | 0.3 | 0.122 | 8.518 | 0.406 | |
| Cd | 0.001 | 0.001 | 0.035 | 0.503 | |
| Pb | 0.0036 | 0.000 | 0.026 | 0.104 | |
| NO3 | 1.6 | 0.159 | 11.133 | 0.099 | |
| NO2 | 0.1 | 0.062 | 4.326 | 0.618 | |
| Na | 75.718 | ||||
Table 11.
Health risk indices in canned beans/peas
| Parameters | RfD | EDI (mg kg−1 bw day−1) | DE (mg kg−1 day−1) | THQ | HI |
|---|---|---|---|---|---|
| Product type A | |||||
| Fe | 0.7 | 1.397 | 97.795 | 1.996 | 10.133 |
| Mn | 0.14 | 0.040 | 2.769 | 0.283 | |
| Zn | 0.3 | 0.515 | 36.025 | 1.715 | |
| Cd | 0.001 | 0.002 | 0.142 | 2.029 | |
| Pb | 0.0036 | 0.000 | 0.007 | 0.028 | |
| NO3 | 1.6 | 0.904 | 63.289 | 0.565 | |
| NO2 | 0.1 | 0.352 | 24.623 | 3.518 | |
| Na | 288.856 | ||||
| Product type B | |||||
| Fe | 0.7 | 1.898 | 132.869 | 2.712 | 11.824 |
| Mn | 0.14 | 0.039 | 2.741 | 0.280 | |
| Zn | 0.3 | 0.885 | 61.955 | 2.950 | |
| Cd | 0.001 | 0.002 | 0.128 | 1.826 | |
| Pb | 0.0036 | 0.000 | 0.000 | 0.000 | |
| NO3 | 1.6 | 0.928 | 64.951 | 0.580 | |
| NO2 | 0.1 | 0.348 | 24.339 | 3.477 | |
| Na | 236.146 | ||||
| Product type C | |||||
| Fe | 0.7 | 1.776 | 124.321 | 2.537 | 9.107 |
| Mn | 0.14 | 0.047 | 3.280 | 0.335 | |
| Zn | 0.3 | 0.580 | 40.612 | 1.934 | |
| Cd | 0.001 | 0.000 | 0.000 | 0.000 | |
| Pb | 0.0036 | 0.000 | 0.000 | 0.000 | |
| NO3 | 1.6 | 0.953 | 66.683 | 0.595 | |
| NO2 | 0.1 | 0.371 | 25.943 | 3.706 | |
| Na | 287.422 | ||||
| Product type D | |||||
| Fe | 0.7 | 1.325 | 92.783 | 1.894 | 10.281 |
| Mn | 0.14 | 0.035 | 2.435 | 0.249 | |
| Zn | 0.3 | 0.714 | 49.998 | 2.381 | |
| Cd | 0.001 | 0.001 | 0.092 | 1.319 | |
| Pb | 0.0036 | 0.001 | 0.071 | 0.282 | |
| NO3 | 1.6 | 0.921 | 64.482 | 0.576 | |
| NO2 | 0.1 | 0.358 | 25.077 | 3.582 | |
| Na | 293.926 | ||||
| Product type E | |||||
| Fe | 0.7 | 1.937 | 135.624 | 2.768 | 11.608 |
| Mn | 0.14 | 0.049 | 3.436 | 0.351 | |
| Zn | 0.3 | 0.583 | 40.839 | 1.945 | |
| Cd | 0.001 | 0.003 | 0.206 | 2.941 | |
| Pb | 0.0036 | 0.002 | 0.107 | 0.423 | |
| NO3 | 1.6 | 0.705 | 49.317 | 0.440 | |
| NO2 | 0.1 | 0.274 | 19.184 | 2.741 | |
| Na | 325.691 | ||||
Table 12.
Health risk indices in canned sweet corn
| Parameters | RfD | EDI (mg kg−1 bw day−1) | DE (mg kg−1 day−1) | THQ | HI |
|---|---|---|---|---|---|
| Product type A | |||||
| Fe | 0.7 | 0.196 | 13.692 | 0.279 | 1.336 |
| Mn | 0.14 | 0.006 | 0.411 | 0.042 | |
| Zn | 0.3 | 0.064 | 4.496 | 0.214 | |
| Cd | 0.001 | 0.000 | 0.019 | 0.276 | |
| Pb | 0.0036 | 0.000 | 0.012 | 0.047 | |
| NO3 | 1.6 | 0.106 | 7.405 | 0.066 | |
| NO2 | 0.1 | 0.041 | 2.881 | 0.412 | |
| Na | 31.799 | ||||
| Product type B | |||||
| Fe | 0.7 | 0.203 | 14.213 | 0.290 | 0.957 |
| Mn | 0.14 | 0.005 | 0.327 | 0.033 | |
| Zn | 0.3 | 0.062 | 4.348 | 0.207 | |
| Cd | 0.001 | 0.000 | 0.000 | 0.000 | |
| Pb | 0.0036 | 0.000 | 0.000 | 0.000 | |
| NO3 | 1.6 | 0.094 | 6.614 | 0.059 | |
| NO2 | 0.1 | 0.037 | 2.570 | 0.367 | |
| Na | 34.621 | ||||
| Product type C | |||||
| Fe | 0.7 | 0.168 | 11.784 | 0.240 | 0.954 |
| Mn | 0.14 | 0.008 | 0.529 | 0.054 | |
| Zn | 0.3 | 0.084 | 5.856 | 0.279 | |
| Cd | 0.001 | 0.000 | 0.000 | 0.000 | |
| Pb | 0.0036 | 0.000 | 0.000 | 0.000 | |
| NO3 | 1.6 | 0.084 | 5.909 | 0.053 | |
| NO2 | 0.1 | 0.033 | 2.297 | 0.328 | |
| Na | 41.797 | ||||
| Product type D | |||||
| Fe | 0.7 | 0.200 | 14.006 | 0.286 | 1.238 |
| Mn | 0.14 | 0.007 | 0.500 | 0.051 | |
| Zn | 0.3 | 0.110 | 7.718 | 0.368 | |
| Cd | 0.001 | 0.000 | 0.004 | 0.060 | |
| Pb | 0.0036 | 0.000 | 0.004 | 0.017 | |
| NO3 | 1.6 | 0.101 | 7.093 | 0.063 | |
| NO2 | 0.1 | 0.039 | 2.759 | 0.394 | |
| Na | 36.261 | ||||
| Product type E | |||||
| Fe | 0.7 | 0.233 | 16.301 | 0.333 | 1.193 |
| Mn | 0.14 | 0.007 | 0.475 | 0.048 | |
| Zn | 0.3 | 0.076 | 5.326 | 0.254 | |
| Cd | 0.001 | 0.000 | 0.003 | 0.048 | |
| Pb | 0.0036 | 0.000 | 0.005 | 0.020 | |
| NO3 | 1.6 | 0.109 | 7.626 | 0.068 | |
| NO2 | 0.1 | 0.042 | 2.957 | 0.422 | |
| Na | 37.635 | ||||
The EDI values in mg kg−1 bw day−1 for canned fish ranged from 0.099 to 0.151 for Fe, 0.001–0.002 for Mn, 0.01–0.0037 for Zn, 0.033–0.049 for NO3 and 0.013–0.019 for NO2. Cd and Pb were below detectable limit. The EDI for canned meat had the following ranged values in mg kg−1 bw day−1; Fe (0.469–0.693), Mn (0.006–0.011), Zn (0.083–0.158), Cd (0–0.001), Pb (BDL), NO3 (0.159–0.197) and NO2 (0.062–0.076). The results from the analyses revealed that canned beans/peas had the highest EDI with values (in mg mg kg−1 bw day−1) ranging from 1.325 to 1.937 for Fe, 0.035–0.049 for Mn, Zn (0.515–0.885), Cd (0–0.003), Pb (0–0.002), NO3 (0.705–0.953) and NO2 (0.274–0.371). The ranged values obtained from the EDI of sweet corn in mg kg−1 bw day−1 are; Fe (0.168–0.23), Mn (0.005–0.008), Zn (0.062–0.110), Cd and Pb (BDL), NO3 (0.084–0.109) and NO2 (0.033–0.042). The established EDI range from the various canned categories in this study were compared to established provisional tolerable daily intake (PTDI) and the values were within benchmark except for nitrates in canned meat which had a maximum value exceeding the benchmark as shown in Table 13.
Table 13.
Comparing EDI with recommended intake values from various standards
| Canned food | Parameter | EDI (mg kg−1 bw day−1) range | Provisional tolerable daily intake (mg kg−1 bw day−1) | References |
|---|---|---|---|---|
| Fish | Fe | 0.099–0.151 | 0.8 | [14] |
| Mn | 0.001–0.002 | 0.067 | [15] | |
| Zn | 0.01–0.0037 | 1 | [16] | |
| Cd | 0-BDL | 0.001 | [17] | |
| Pb | 0-BDL | 0.00357 | [18] | |
| NO3 | 0.033–0.049 | 0–3.7 | [19] | |
| NO2 | 0.013–0.019 | 0–0.07 | [19] | |
| Meat | Fe | 0.469–0.693 | 0.8 | [14] |
| Mn | 0.006–0.011 | 0.067 | [15] | |
| Zn | 0.083–0.158 | 1 | [16] | |
| Cd | 0–0.001 | 0.001 | [17] | |
| Pb | 0-BDL | 0.00357 | [18] | |
| NO3 | 0.159–0.197 | 0–3.7 | [19] | |
| NO2 | 0.062–0.076 | 0–0.07 | [19] | |
| Beans/Peas | Fe | 1.325–1.937 | 0.8 | [14] |
| Mn | 0.035–0.049 | 0.067 | [15] | |
| Zn | 0.515–0.885 | 1 | [16] | |
| Cd | 0–0.003 | 0.001 | [17] | |
| Pb | 0–0.002 | 0.00357 | [18] | |
| NO3 | 0.705–0.953 | 0–3.7 | [19] | |
| NO2 | 0.274–0.371 | 0–0.07 | [19] | |
| Sweet corn | Fe | 0.168–0.233 | 0.8 | [14] |
| Mn | 0.005–0.008 | 0.067 | [15] | |
| Zn | 0.062–0.110 | 1 | [16] | |
| Cd | 0-BDL | 0.001 | [17] | |
| Pb | 0-BDL | 0.00357 | [18] | |
| NO3 | 0.084–0.109 | 0–3.7 | [19] | |
| NO2 | 0.033–0.042 | 0–0.07 | [19] |
The DE of the various parameters in the canned categories were also compared with recommended daily requirement set for each parameters as shown in Table 14. But the DE of canned fish for each parameters had values (in mg kg−1 day−1) ranging from 6.957 to 10.564 for Fe, 0.062–0.114 for Mn, Zn ranged from 0.676 to 2.598, Cd (0–0.008), Pb (0–0.007), NO3 (2.331–3.399), NO2 (0.907–1.335) and Na (16.67–19.14). In canned meat, the ranged values (mg kg−1 day−1) were; Fe (32.85–48.49), Mn (0.394–0.742), Zn (5.779–11.03), Cd (0–0.035), Pb (0–0.026), NO3 (11.13–13.78), NO2 (4.33–5.32) and Na (69.18–76.56). The highest DE (mg kg−1 day−1) was recorded in the canned beans/peas categories. They are; Fe (92.78–135.62), Mn (2.435–3.44), Zn (36.03–61.96), Cd (0–0.206), Pb (0–0.107), NO3 (49.32–66.68), NO2 (19.18–25.94) and Na (236.15–325.69). DE of sweet corn ranged from 11.78 to 16.30, 0.33–0.53, 4.34–7.72, 0–0.019, 0–0.012, 5.91–7.63, 2.3–2.96 and 31.80–41.80 mg kg−1 bw day−1 for Fe, Mn, Zn, Cd, Pb, NO3, NO2 and Na respectively.
Table 14.
Comparing DE with recommended intake values from various standards
| Canned food | Parameter | DE (mg kg−1 day−1) | Recommended daily requirement (mg day−1) | References |
|---|---|---|---|---|
| Fish | Fe | 6.957–10.564 | 10–15 | [20] |
| Mn | 0.062–0.114 | 2–9 | [21] | |
| Zn | 0.676–2.589 | 15–22 | [16] | |
| Cd | 0–0.008 | – | – | |
| Pb | 0–0.007 | 0.075 | [22] | |
| NO3 | 2.331–3.399 | – | – | |
| NO2 | 0.907–1.335 | – | – | |
| Na | 16.699–19.138 | 2300 | [23] | |
| Meat | Fe | 32.845–48.493 | 10–15 | [20] |
| Mn | 0.394–0.742 | 2–9 | [21] | |
| Zn | 5.779–11.030 | 15–22 | [16] | |
| Cd | 0–0.035 | – | – | |
| Pb | 0–0.026 | 0.075 | [22] | |
| NO3 | 11.133–13.776 | – | – | |
| NO2 | 4.326–5.322 | – | – | |
| Na | 69.184–76.557 | 2300 | [23] | |
| Beans/Peas | Fe | 92. 783–135.624 | 10–15 | [20] |
| Mn | 2.435–3.436 | 2–9 | [21] | |
| Zn | 36.025–61.955 | 15–22 | [16] | |
| Cd | 0–0.206 | – | – | |
| Pb | 0–0.107 | 0.075 | [22] | |
| NO3 | 49.317–66.683 | – | – | |
| NO2 | 19.184–25.943 | – | – | |
| Na | 236.146–325.691 | 2300 | [23] | |
| Sweet corn | Fe | 11.784–16.301 | 10–15 | [20] |
| Mn | 0.327–0.529 | 2–9 | [21 | |
| Zn | 4.348–7.718 | 15–22 | [16] | |
| Cd | 0–0.019 | – | – | |
| Pb | 0–0.012 | 0.075 | [22] | |
| NO3 | 5.909–7.626 | – | – | |
| NO2 | 2.297–2.957 | – | – | |
| Na | 31.799–41.797 | 2300 | [23] |
THQ values for all canned foods categories were less than 1 except canned beans/peas with values greater than 1. HI ranged from 0.421 to 11.824 in the food categories as shown in Tables 9, 8, 10, 11 and 12.
Discussion
The mean concentration heavy metals, Nitrate and Nitrite, (Fe, Zn, Cd, Pb, Mn and As across the canned food categories are presented in Figs. 1 and 2. The mean values for nitrates ranged from 54.22 ± 9.52 to 93.92 ± 3.73 mg kg−1 and the values were above Food Standards Australia New Zealand (FSANZ) bench marks. Nitrites mean values ranged from 21.1 ± 3.69 to 36.54 ± 1.45 mg kg−1 across the canned food categories and were below FSANZ bench marks. Heavy metals concentrations across the canned food categories ranged from 130.68 ± 1.74 to 303.08 ± 11.57 mg kg−1 (Fe), 1.44 ± 0.34–6.3 ± 0.35 mg kg−1 (Mn), 15.72 ± 3.49–91.88 ± 3.95 mg kg−1 (Zn), 0–0.23 ± 0.04 mg kg−1 (Cd), and 0–0.17 ± 0.08 mg/kg (Pb). Cd was above EU standard in all canned groups while Pb exceeded same standard in canned meat.
Fig. 1.

Mean concentration (mg kg−1) of heavy metals across canned food categories. The metal concentrations across canned categories tend to vary. Manganese appears to increase significantly from canned fish to canned sweetcorn. Cadmium was highest in canned beans/peas. Values are mean ± SE (n = 25 per category)
Fig. 2.
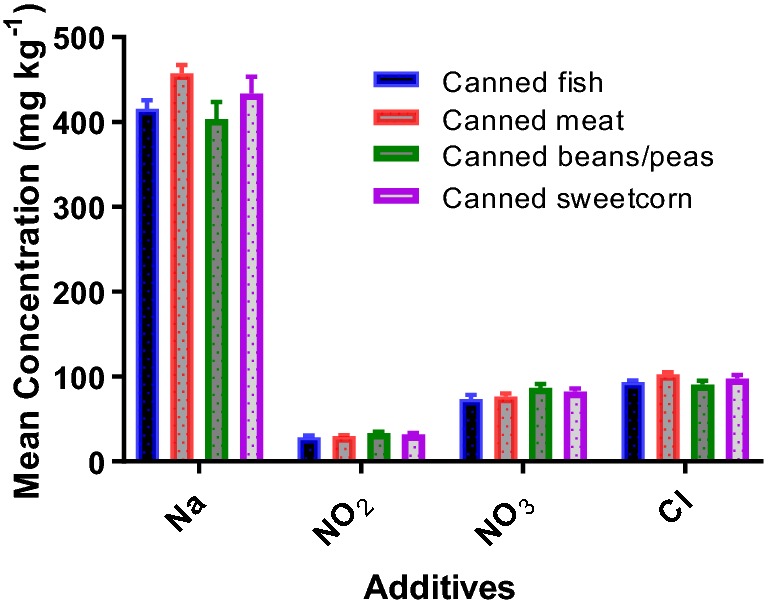
Mean concentration (mg kg−1) of chemical additives across canned food categories. The additives tend to be similar across the canned categories with no wide variation. Values are mean ± SE (n = 25 per category)
Health risk estimations showed as EDI and DE are shown in Tables 9, 10, 11 and 12. The values of EDI ranged from 0.033 to 0.953 mg kg−1 bw day−1 and 0.013 to 0.371 mg kg−1 bw day−1, for nitrates and nitrites respectively.
The Fe concentration in this study was far higher than that reported by Zarei et al. [24]. In their study, Fe ranged from 0.009 to 14.207 µg g−1 in canned tuna fish. It was also higher than the result obtained by Iwuoha et al. [25] were the Fe level in canned Geisha and Founty Mackerel in Choba market ranged from 0 to 0.0379 mg kg−1. Zn in this study were higher than the findings of Dallatu et al. [26,] who assessed the level of heavy metals in fresh and canned foods consumed in Northern central Nigeria reported Zn to range from 0.0526 to 1.5472 mg kg−1 in canned foods and 0.17841–6.41113 in fresh food samples. Cd in this study corroborates with that of Dallatu et al. [26] where the Cd assessed in fresh and canned foods were found to be higher than WHO standards and the values ranged from 0.0073 to 0.1919 mg kg−1. This may pose a threat considering the fact that accumulation of Cd in the human body may induce kidney dysfunction, skeletal damage and reproductive deficiencies [27]. Lead in this study did not corroborate the findings of Bordajandi et al. [28] which reported Pb values as high as 217 µg/g in sardine, 17.1 µg g−1 in canned tuna and 69.6 in canned sardines.
The results for Nitrate and Nitrite from this study were found to be higher than results obtained from the New Zealand’s nitrates and nitrites diet study were ninety-seven percent (97%) of the processed foods and meat analysed complied with the Australia New Zealand Food Standards with two meat samples containing low levels of nitrate and one with excessive nitrite [29]. The high levels recorded could be dangerous because nitrates are generally regarded to be of low toxicity but the toxicological squeals of nitrate exposure are considered to be virtually attributed to its conversion to nitrite. Nitrite reacts with haemoglobin (Hb) to form methaemoglobin (MetHb) in the blood which is the toxicological end point following nitrate and nitrite exposure. MetHb levels of up to 10% are typically not associated with clinical signs in humans. At a higher level, MetHb is associated with clinical signs including cyanosis, impaired aerobic respiration, and metabolic acidosis and in severe cases, death [30, 31]. Outside the use of nitrates and nitrites as additives in canned foods, the high level in this study may suggest a synergistic effect of the use of nitrogen rich fertilizer for cultivation alongside the contribution during manufacture process for preservation.
The observed pH values from this study did not differ widely from each canned categories assessed as shown in Fig. 3. This shows that the values are largely maintained within different canned foods.
Fig. 3.

pH of the canned foods. There was slight difference in the pH values recorded across the foods sampled. Canned fish and meat showed no significant variation in the different canned products analysed (P > 0.05) but canned beans/peas and canned sweet corn showed a high significant difference across the product types (P < 0.001). Values are mean ± SE (n = 25 per category)
Health assessment
In this study, possible health risk on consumption of the canned foods was assessed using Health risk indices reported as Estimated Daily Intake (EDI), Target Hazard Quotient (THQ), Hazard Index (HI) and Dietary Exposure (DE).
EDI values in mg kg−1 bw day−1 for Fe ranged from 0.099 to 0.15, 0.469–0.693, 1.325–1.937, 0.168–0.23 for canned fish, meat, beans/peas and sweet corn respectively were mostly found to be within PTDI of 0.8 mg kg−1 bw day−1 set by Joint Expert Committee on Food Additives (JECFA) [14] except for canned beans/peas which exceeded this limit. EDI of Fe in this study was found to higher than 0.09 mg kg−1 bw day−1 that reported by Korfali and Hamdan [32] in their study of canned foods in Lebanon.
That of Mn ranged from 0.001 to 0.002, 0.006–0.011, 0.035–0.049, 0.005–0.008 mg kg−1 bw day−1 for canned fish, meat, beans/peas and sweet corn. These values were lower than the PTDI set by Food Safety and Inspection Service (FSIS) [15] of 0.067 mg kg−1 bw day−1.
In a similar way, the EDI for Zn were found to be below 1 mg kg−1 bw day−1 set by JECFA [16] and the range from this study was 0.01–0.0037, 0.083–0.158, 0.515–0.885, 0.062–0.110 mg kg−1 bw day−1.
However, EDI for Cd was above the PTDI of 0.001 mg kg−1 bw day−1 set by JECFA [17] in canned beans/peas, but canned meat recorded an EDI of 0.001 mg kg−1 bw day−1 which is same as the PTDI but was below detectable limit for canned fish and sweet corn. The EDI for Cd in this study was found to be higher than those from previous studies; 0.11 µg kg−1 bw day−1 reported by Bordajandi et al. [28] and 0.14 µg kg−1 bw day−1 reported by Urieta et al. [33].
EDI for Pb was not recorded for all canned groups except canned beans/peas which recorded a range of 0–0.002 mg kg−1 bw day−1 which was slightly below the PTDI of 0.00357 mg kg−1 bw day−1 set by JECFA [18]. The EDI for Pb in this study was higher than 0.38 µg/kg bw/day reported by Bordajandi et al. [27] and also higher than 0.55 µg kg−1 bw day−1 reported by Urieta et al. [33].
EDI calculated for NO3 was within PTDI of 0–3.7 mg kg−1 bw day−1 set by JECFA [19] which was between 0.033 and 0.953 mg kg−1 bw day−1 across the canned groups. That of NO2 was found to be higher than the PTDI set values of 0–0.07 mg kg−1 bw day−1 in canned beans (0.274–0.371 mg kg−1 bw day−1) and canned meat (0.062–0.076 mg kg−1 bw day−1). The result from this study agrees with that of Thompson [29] that reported the EDI for New Zealand adults to nitrate and nitrite to range from 0 to 5 mg kg−1 bw day−1 and 0–0.10 mg kg−1 bw day−1 respectively.
The DE in this study was assessed to determine the values available on consumption of any of the canned products. Most diets are fortified with metals such as Fe and Zn but they are required in diet within a dietary intake level certified not to cause any form of toxicity. Hence, for this study, DE for Fe in the canned foods sampled ranged from 6.957 to 135.624 mg kg−1 bw day−1. This value were above the recommended daily requirement of 10–15 mg kg−1 day−1 set by Nordic Council of Ministers (NCM) [20] except for canned fish whose values were within the recommended intake level per day. This shows that consumption of these foods will not expose the consumer to any chance of anaemia. DE for Mn ranged from 0.062 to 3.436 mg kg−1 day−1 which was within the daily requirement recommended in food by WHO [21] which is 2–9 mg kg−1 bw day−1. Zn was found to have a DE within the daily recommended intake of 15–22 mg kg−1 day−1 set by JECFA [16] except for canned beans/peas with a DE of 36.025–61.955 mg kg−1 bw day−1. Cd, NO3 and NO2 recorded DE values which ranged from 0 to 0.206, 2.331–66.683, 0.907–25.943 mg kg−1 day−1 respectively with no data for comparison. There is a concern of Pb toxicity in canned beans/peas which had a DE of 0.107 mg kg−1 day−1 slightly above the daily requirement of 0.075 mg kg−1 bw day−1 set by US FDA [22].
There is no risk of Na induced hypertension because the DE of Na in this study was far below the daily requirement of 2300 mg kg−1 bw day−1 as specified by Centres for Disease Control and Prevention (CDC) [23]. The DE for the various parameters in this study may not totally account for their availability in a single diet. This is because, when they are used alongside other food substances in food preparation, the levels may likely increase hence increasing the risk associated with each parameters due to synergistic effect.
The human health risks posed by contaminant exposure are usually characterized by the target hazard quotient (THQ) [6]. If the value of THQ is less than 1, the risk of non-carcinogenic toxic effects is assumed to be low. When it exceeds 1, there may be concerns for potential health risks associated with overexposure. In this study, the THQ values for all canned foods categories were less than 1 except canned beans/peas with values greater than 1 in all of its parameters except Mn suggesting that there is a risk of a non-carcinogenic toxic effect. HI ranged from 0.421 to 11.824 in the food categories.
Results from this study revealed potential Cd toxicity and risk of non-carcinogenic toxic effect from canned beans/peas consumption; it is therefore imperative to monitor possible contamination of canned foods. This study also became an eye opener, because it demonstrated that some canned foods sold in Nigeria markets do not carry NAFDAC Registration No. NAFDAC (National Agency for Food and Drug Administration and Control) is an arm of the Nigeria Government whose mission is to safeguard the public health by ensuring that only the right quality of food, drugs and other regulated products are manufactured, exported, imported, advertised, sold and used. It is imperative therefore that such agency should collaborate with Institutions all over the country to help conduct research regularly and use the results as a monitoring guide. I also recommend that a total diet study be carried out to cover the scope outside of this research.
Acknowledgements
I want to acknowledge the team members of the Laboratory for Ecotoxicology and Environmental Forensics for their role in this research.
Compliance with ethical standards
Conflict of interest
This work has been extensively discussed in parts and whole at the 7th international toxicology symposium in Africa held in South Africa in August 2015. Martins Oshioriamhe Ainerua received a travel Grant from the University of Benin to the 7th international toxicology symposium in South Africa.
References
- 1.Voegborlo RB, El-Methnani AM, Abedin MZ. Mercury, cadmium and lead in canned fish. Food Chem. 1999;67:341–345. doi: 10.1016/S0308-8146(98)00008-9. [DOI] [Google Scholar]
- 2.Massadeh AM, Allah A, Al-Massaedh T, Kharibeh S. Determination of selected elements in canned food sold in Jordan markets. Environ Sci Pollut Res. 2018;25:3501–3509. doi: 10.1007/s11356-017-0465-5. [DOI] [PubMed] [Google Scholar]
- 3.Joint FAO/WHO Expert Committee on Food Additives (2006) Meeting and World Health Organization. Safety evaluation of certain food additives (No. 56). World Health Organization
- 4.AOAC . Official methods of analysis of the Association of Official Analytical Chemists. 14. Washington, DC: AOAC; 1984. [PubMed] [Google Scholar]
- 5.Radojevic M, Bashkin VN. Practical environmental analysis. Cambridge, UK: The Royal Society of Chemistry; 1999. Organic matter; pp. 325–329. [Google Scholar]
- 6.US EPA (United States Environmental Protection Agency) (1997) Exposure factors handbook. EPA/600/P-95/002F. Washington, DC. Update to Exposure Factors Handbook EPA/600/8-89/043 - May 1989. https://rais.ornl.gov/documents/EFH_Final_1997_EPA600P95002Fa.pdf
- 7.US EPA (United States Environmental Protection Agency) Integrated risk information system-database. Philadelphia: United States Environmental Protection Agency; 2007. [Google Scholar]
- 8.JECFA (2005) Consultations and workshops. Dietary exposure assessment of chemicals in food. Report of a Joint FAO/WHO Consultation Annapolis. MD, USA, 2–6 May 2005, pp 1–88
- 9.FDA (2007) Approximate pH of foods and food products. US Food and Drug Administration, Rockville. http://www.cfsan.fda.gov. Accessed 20 June 2014
- 10.Food Standards Australia New Zealand (FSANZ) (2004) Mercury in fish—Further information. http://www.foodstandards.gov.au/_srcfiles/FS_Mercury_in_fish_final.pdf. Accessed 20 June 2014
- 11.European Commission (2008) Commission Regulation 2008/629/EC of 2 July 2008, amending Regulation (EC) 1881/2006 setting maximum levels for certain contaminants in foodstuffs. L88/29–38. Accessed 29 Mar 2007
- 12.European Commission Commission Regulation (EC) 1881/(2006) of 20 December (2006) setting maximum levels for certain contaminants in foodstuffs. Off J Eur Union L. 2006;364:5–24. [Google Scholar]
- 13.Tuzen M, Soylak M. Determination of trace metals in canned fish marketed in Turkey. Food Chem. 2007;101:1378–1382. doi: 10.1016/j.foodchem.2006.03.044. [DOI] [Google Scholar]
- 14.JECFA . Evaluation of certain food additives and contaminants, 27th report. Geneva: WHO; 1983. [Google Scholar]
- 15.Food Safety and Inspection Service (FSIS) (2004) 2000 total diet study of 12 elements aluminium, arsenic, cadmium, chromium, copper, lead, magnesium, mercury, nickel, selenium tin and zinc. UK Food Standards Agency, FSA Food Survey Information Sheet 48/04. Food survey information sheet 48/04. http://www.food.gov.uk/science/surveillance/fsis2004branch/fsis4804metals. Accessed May 2014
- 16.JECFA (1982) Evaluation of certain food additives and contaminants. Twenty-six report of joint FAO/WHO Expert committee on food additives WHO Technical report Series 683
- 17.Joint Expert Committee on Food Additives (JECFA) (2013) About Codex. Codex Alimentarius. http://www.codexalimentarius.org/scientific-basis-for-codex/jecfa/en. Accessed Nov 2014
- 18.JECFA (1993) Evaluation of certain food additives and contaminants. Forty-first report of the Joint FAO/WHO Expert Committee on Food Additives. World Health Organization, Technical Report Series 837. WHO, Geneva, Switzerland [PubMed]
- 19.JECFA (2002) Safety evaluation of certain food additives and contaminants / prepared by the fifty-seventh meeting of the Joint FAO/WHO Expert Committee on Food Additives (JECFA). World Health Organization, pp 451–664. https://apps.who.int/iris/handle/10665/42501
- 20.Nordic Council of Ministers . Risk evaluation of essential trace elements—essential versus toxic levels of intake. Report of a Nordic project group. Oskarsson. A. Copenhagen: Nordic Council of Ministers; 1995. [DOI] [PubMed] [Google Scholar]
- 21.World Health Organization (WHO) Environmental health criteria 17: Manganese. Geneva: WHO; 1981. pp. 1–110. [Google Scholar]
- 22.US Food and Drug Administration . Everything added to food in the United States. Boca Raton: C.K. Smoley; 1993. [Google Scholar]
- 23.Centers for Disease Control and Prevention (CDC) Sodium intake among adults-United States, 2005–2006. MMWR Morb Mortal Wkly Rep. 2010;59:746. [PubMed] [Google Scholar]
- 24.Zarei M, Mollaie A, Eskandari MH, Pakfetrat S, Shekarforoush S. Histamine and heavy metals content canned tuna fish. Glob Vet. 2010;5:259–263. [Google Scholar]
- 25.Iwuoha GN, Uporo VB, Onwuachu UI. Variation of heavy metals in canned geisha and Founty mackerel fish brands obtained from Choba Market Port Harcourt, Nigeria. J Appl Sci Environ Manag. 2013;17:577–580. [Google Scholar]
- 26.Dallatu YA, Abechi SE, Abba H, Mohammed US, Ona EC. Level of heavy metals in fresh and canned foods consumed in North Central Nigeria. Sch J Agric Sci. 2013;3:210–213. [Google Scholar]
- 27.Commission of the European communities (2001) Commission regulation (EC) No. 221/2002 of 6 February 2002 amending regulation (EC) No. 466/2002 setting maximum levels for certain contaminants in foodstuffs. Off J Eur Commun L 37/4. https://eur-lex.europa.eu/LexUriServ/LexUriServ.do?uri=OJ:L:2002:037:0004:0006:EN:PDF. Accessed June 2014
- 28.Bordajandi LR, Gómez G, Abad E, Rivera J, Fernández-Bastón MDM, Blasco J, González MJ. Survey of persistent organochlorine contaminants (PCBs, PCDD/Fs, and PAHs), heavy metals (Cu, Cd, Zn, Pb, and Hg), and arsenic in food samples from Huelva (Spain): levels and health implications. J Agric Food Chem. 2004;52:992–1001. doi: 10.1021/jf030453y. [DOI] [PubMed] [Google Scholar]
- 29.Thomson B. Nitrates and nitrites dietary exposure and risk assessment: prepared as part of a New Zealand Food Safety Authority contract for scientific services. Wellington: Institute of Environmental Science & Research Limited; 2004. [Google Scholar]
- 30.Solecki R, Davies L, Dellarco V, Dewhurst I, van Raaij M, Tritscher A. Guidance on setting of acute reference dose (ARfD) for pesticides. Food Chem Toxicol. 2005;43:1569–1593. doi: 10.1016/j.fct.2005.04.005. [DOI] [PubMed] [Google Scholar]
- 31.Speijers GJA, van den Brandt PA. Nitrite (and potential formation of N-nitroso compounds) Geneva: WHO Food Additive Series; 2002. [Google Scholar]
- 32.Korfali SI, Hamdan WA. Essentail and toxic metals in lebanese marketed canned food: impact of metal cans. J Food Res. 2013;2:19–30. doi: 10.5539/jfr.v2n1p19. [DOI] [Google Scholar]
- 33.Urieta I, Jalón M, Eguileor I. Food surveillance in the Basque Country (Spain). II. Estimation of the dietary intake of organochlorine pesticides, heavy metals, arsenic, aflatoxin M1, iron, zinc through the total diet study, 1990/91. Food Addit Contam. 1996;13:29–52. doi: 10.1080/02652039609374379. [DOI] [PubMed] [Google Scholar]