

Abstract
Intracellular energy distribution has attracted much interest and has been proposed to occur in skeletal muscle via metabolite-facilitated diffusion1,2; however, genetic evidence suggests that facilitated diffusion is not critical for normal function3–7. We hypothesized that mitochondrial structure minimizes metabolite diffusion distances in skeletal muscle. Here we demonstrate a mitochondrial reticulum providing a conductive pathway for energy distribution, in the form of the proton-motive force, throughout the mouse skeletal muscle cell. Within this reticulum, we find proteins associated with mitochondrial proton-motive force production preferentially in the cell periphery and proteins that use the proton-motive force for ATP production in the cell interior near contractile and transport ATPases. Furthermore, we show a rapid, coordinated depolarization of the membrane potential component of the proton-motive force throughout the cell in response to spatially controlled uncoupling of the cell interior. We propose that membrane potential conduction via the mitochondrial reticulum is the dominant pathway for skeletal muscle energy distribution.
The mechanism by which the forms of potential energy generated by oxidative phosphorylation are distributed within skeletal muscle cells has been the subject of active research for many years. Two major facilitated diffusion mechanisms have been proposed. The creatine kinase shuttle system proposes that creatine phosphate and creatine are cytosolic facilitated diffusion partners with ATP and ADP1, while the second model proposes that the oxy-deoxy myoglobin shuttle aids diffusion of oxygen from capillaries to mitochondria2. However, in the absence of myoglobin3, creatine kinase4, or creatine5, mice survive with near-normal skeletal muscle performance and only modest adaptations5,7, suggesting that these facilitated diffusion pathways are not critical for normal muscle function. Thus, a re-examination of the pathways for distributing potential energy within skeletal muscle is warranted.
We selected high-resolution, three-dimensional (3D, 15-nm isotropic voxels) focused ion beam scanning electron microscopy (FIB-SEM)8,9 to better define the diffusion pathways in mitochondria-rich muscle fibres. Previous investigations of muscle 3D structure10–15 have yielded conflicting results, probably due to the size of the serial sections (60–90 nm), a lack of true 3D information16, and/or differences between muscle types studied12.
The contrast in the FIB-SEM image stack (Supplementary Video 1, raw data available at http://labalaban.nhlbi.nih.gov/files/SuppDataset.tif, see also Supplementary Information) was sufficient to enable automated segmentation of mitochondria, myofibrils, blood vessels, red blood cells and nuclei (Fig. 1a, b) and revealed four different mitochondrial morphologies (Supplementary Video 1): paravascular mitochondria (PVM) (Fig. 1c), I-band mitochondria (IBM) (Fig. 1c–e), fibre parallel mitochondria (FPM, Fig. 1d, e), and cross fibre connection mitochondria (CFCM, Fig. 1d). Consistent with our previous in vivo microscopy studies7,17,18, the PVM pool, often associated with a nucleus, was evident in mitochondria-rich fibres when imaged by FIB-SEM. Tracing the path of the PVM often revealed multiple or single direct connections (that is, a continuous outer membrane) with IBM19 (Fig. 2b). A PVM could be coupled to one or both IBM on opposing sides of the z-line (Supplementary Video 2). CFCM were less frequent and also seen as pairs of tubules proceeding transversely on both sides of a z-line. However, CFCM were oriented perpendicularly to IBM (Fig. 2c, d). Sarcomeres were observed to have associations with multiple mitochondrial structures (Fig. 2e). This analysis demonstrates that PVM are directly coupled to most IBM in the muscle, providing a conductive pathway for potential energy transfer from the periphery to deep inside the muscle. Skulachev proposed over 40 years ago that the electrical component of the proton-motive force, the membrane potential (ΔΨ), could be used by the cell as a transportable form of potential energy20 and later demonstrated that mitochondria could be electrically coupled in cultured cells21.
Figure 1 |. Muscle mitochondria form highly connected networks.
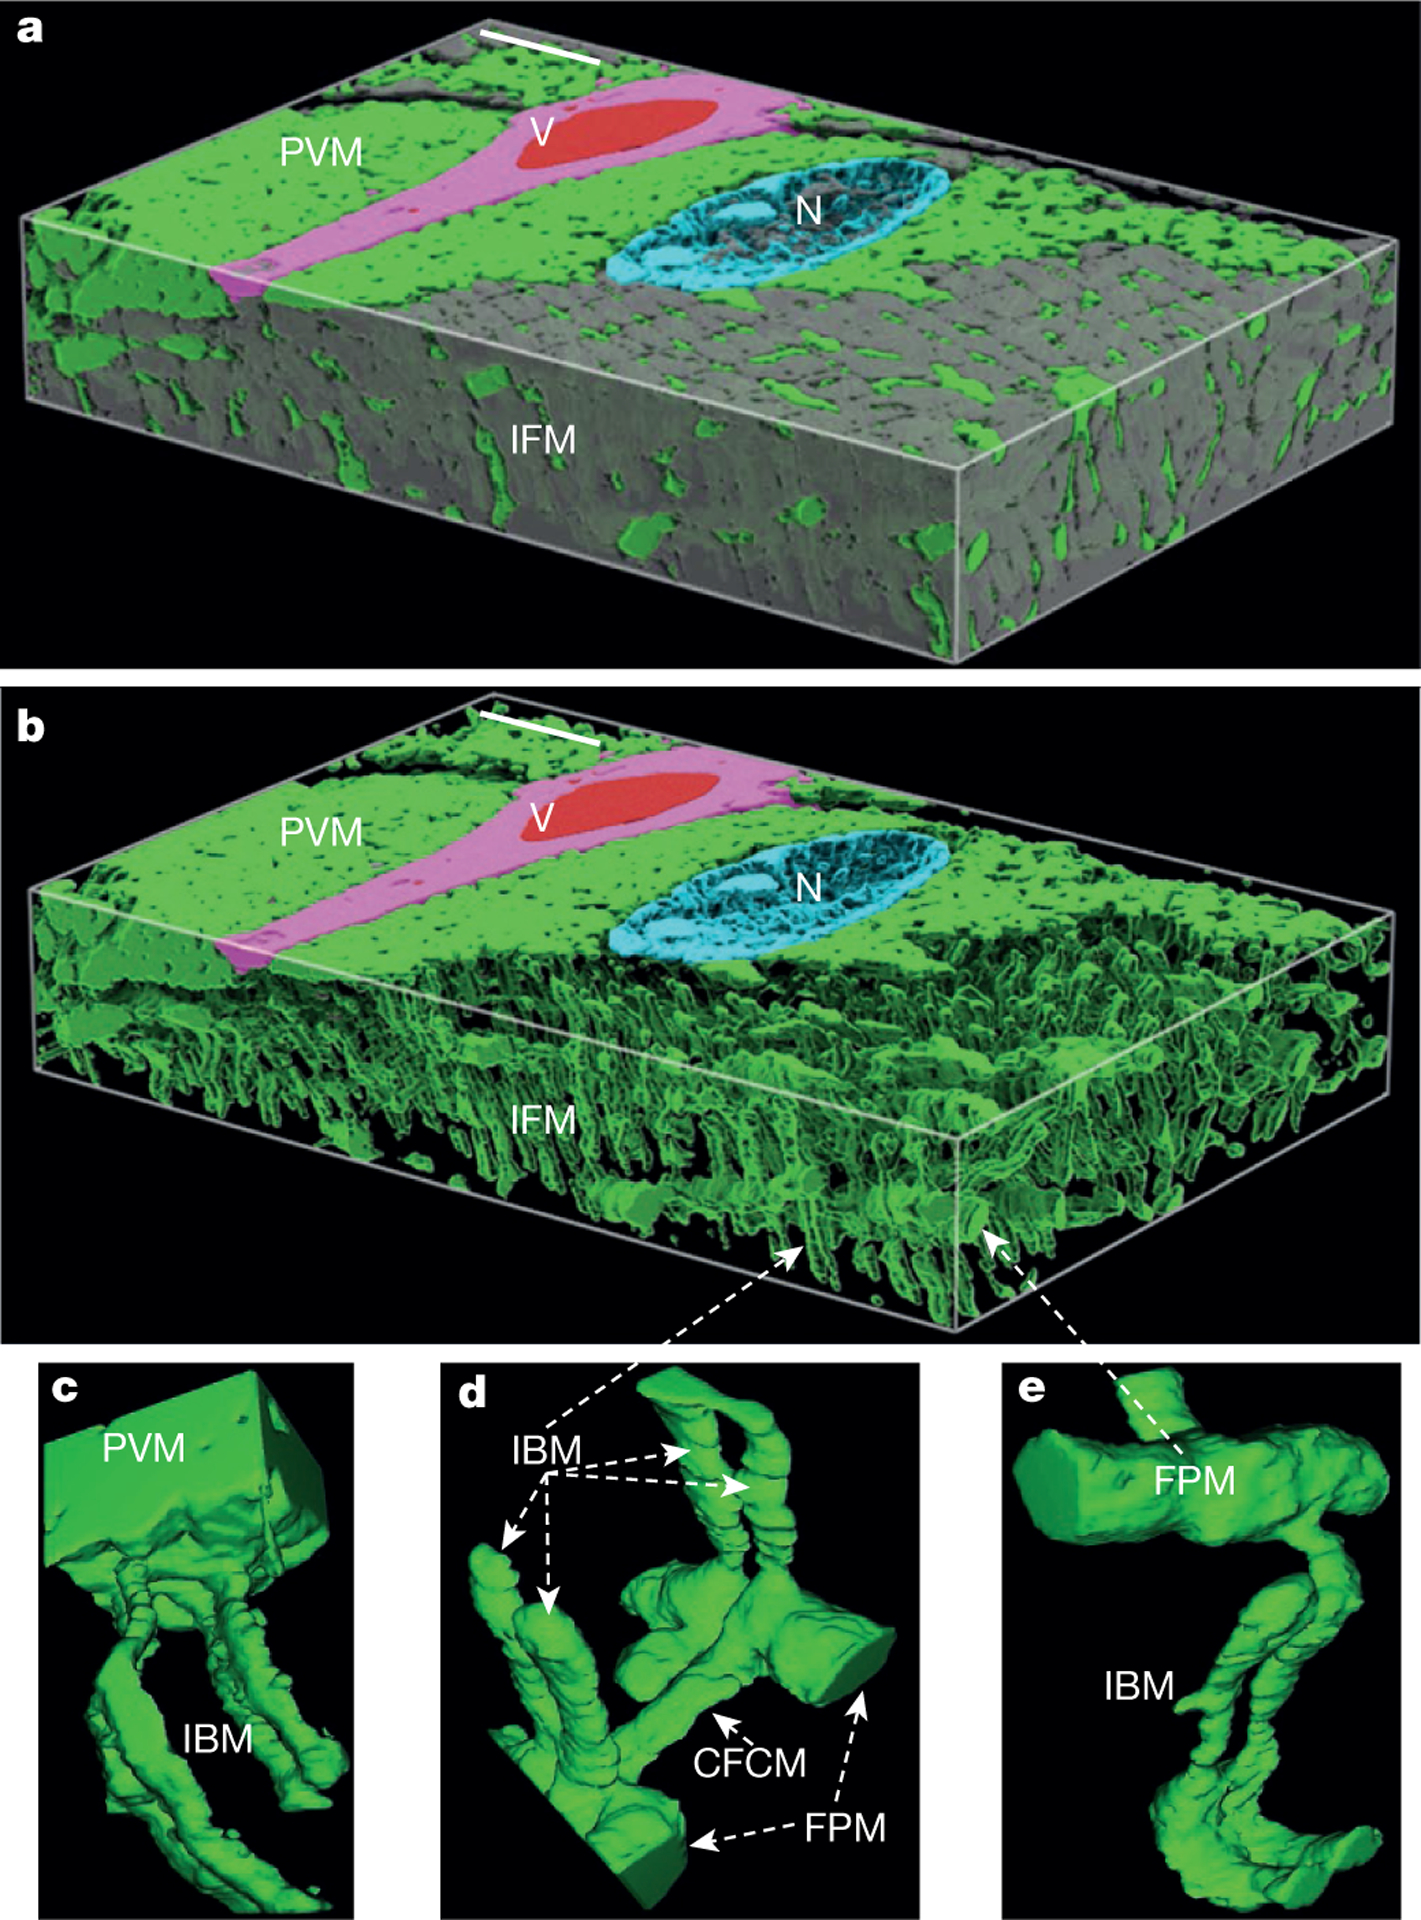
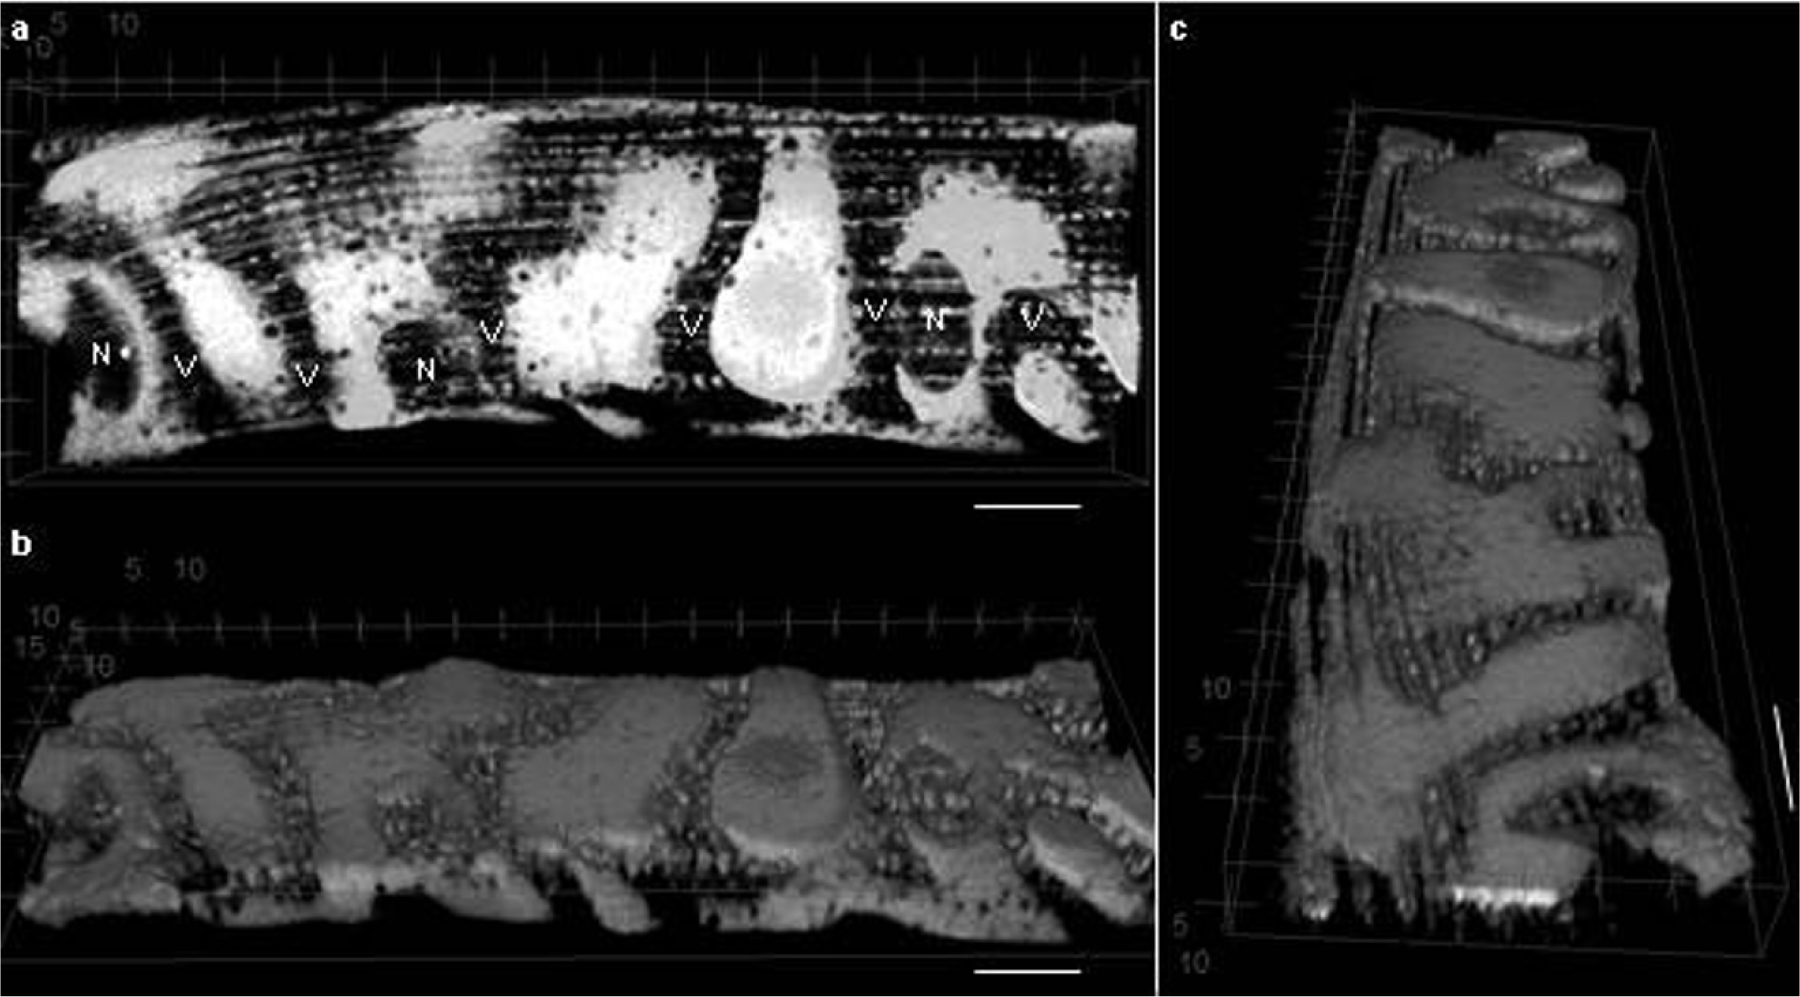
a, 3D surface rendering of 25.53 × 24.06 × 4.23 μm FIB-SEM volume segmented to show spatial relationships between mitochondria (green) and other structures (nucleus (N), cyan; capillary (V), magenta; red blood cell, red; myofibrils, grey). b, Removing myofibrils highlights different morphologies within intra-fibrillar mitochondrial (IFM) network. c–e, Zooming in reveals projections from paravascular mitochondria (PVM) into I-band mitochondria (IBM) (c), and numerous interactions between IBM and cross-fibre connection mitochondria (CFCM) (d) and fibre parallel mitochondria (FPM) (d, e). Scale bars, 3 μm. Representative of eight separate volumes analysedfrom four animals.
Figure 2 |. Muscle mitochondrial morphologies.
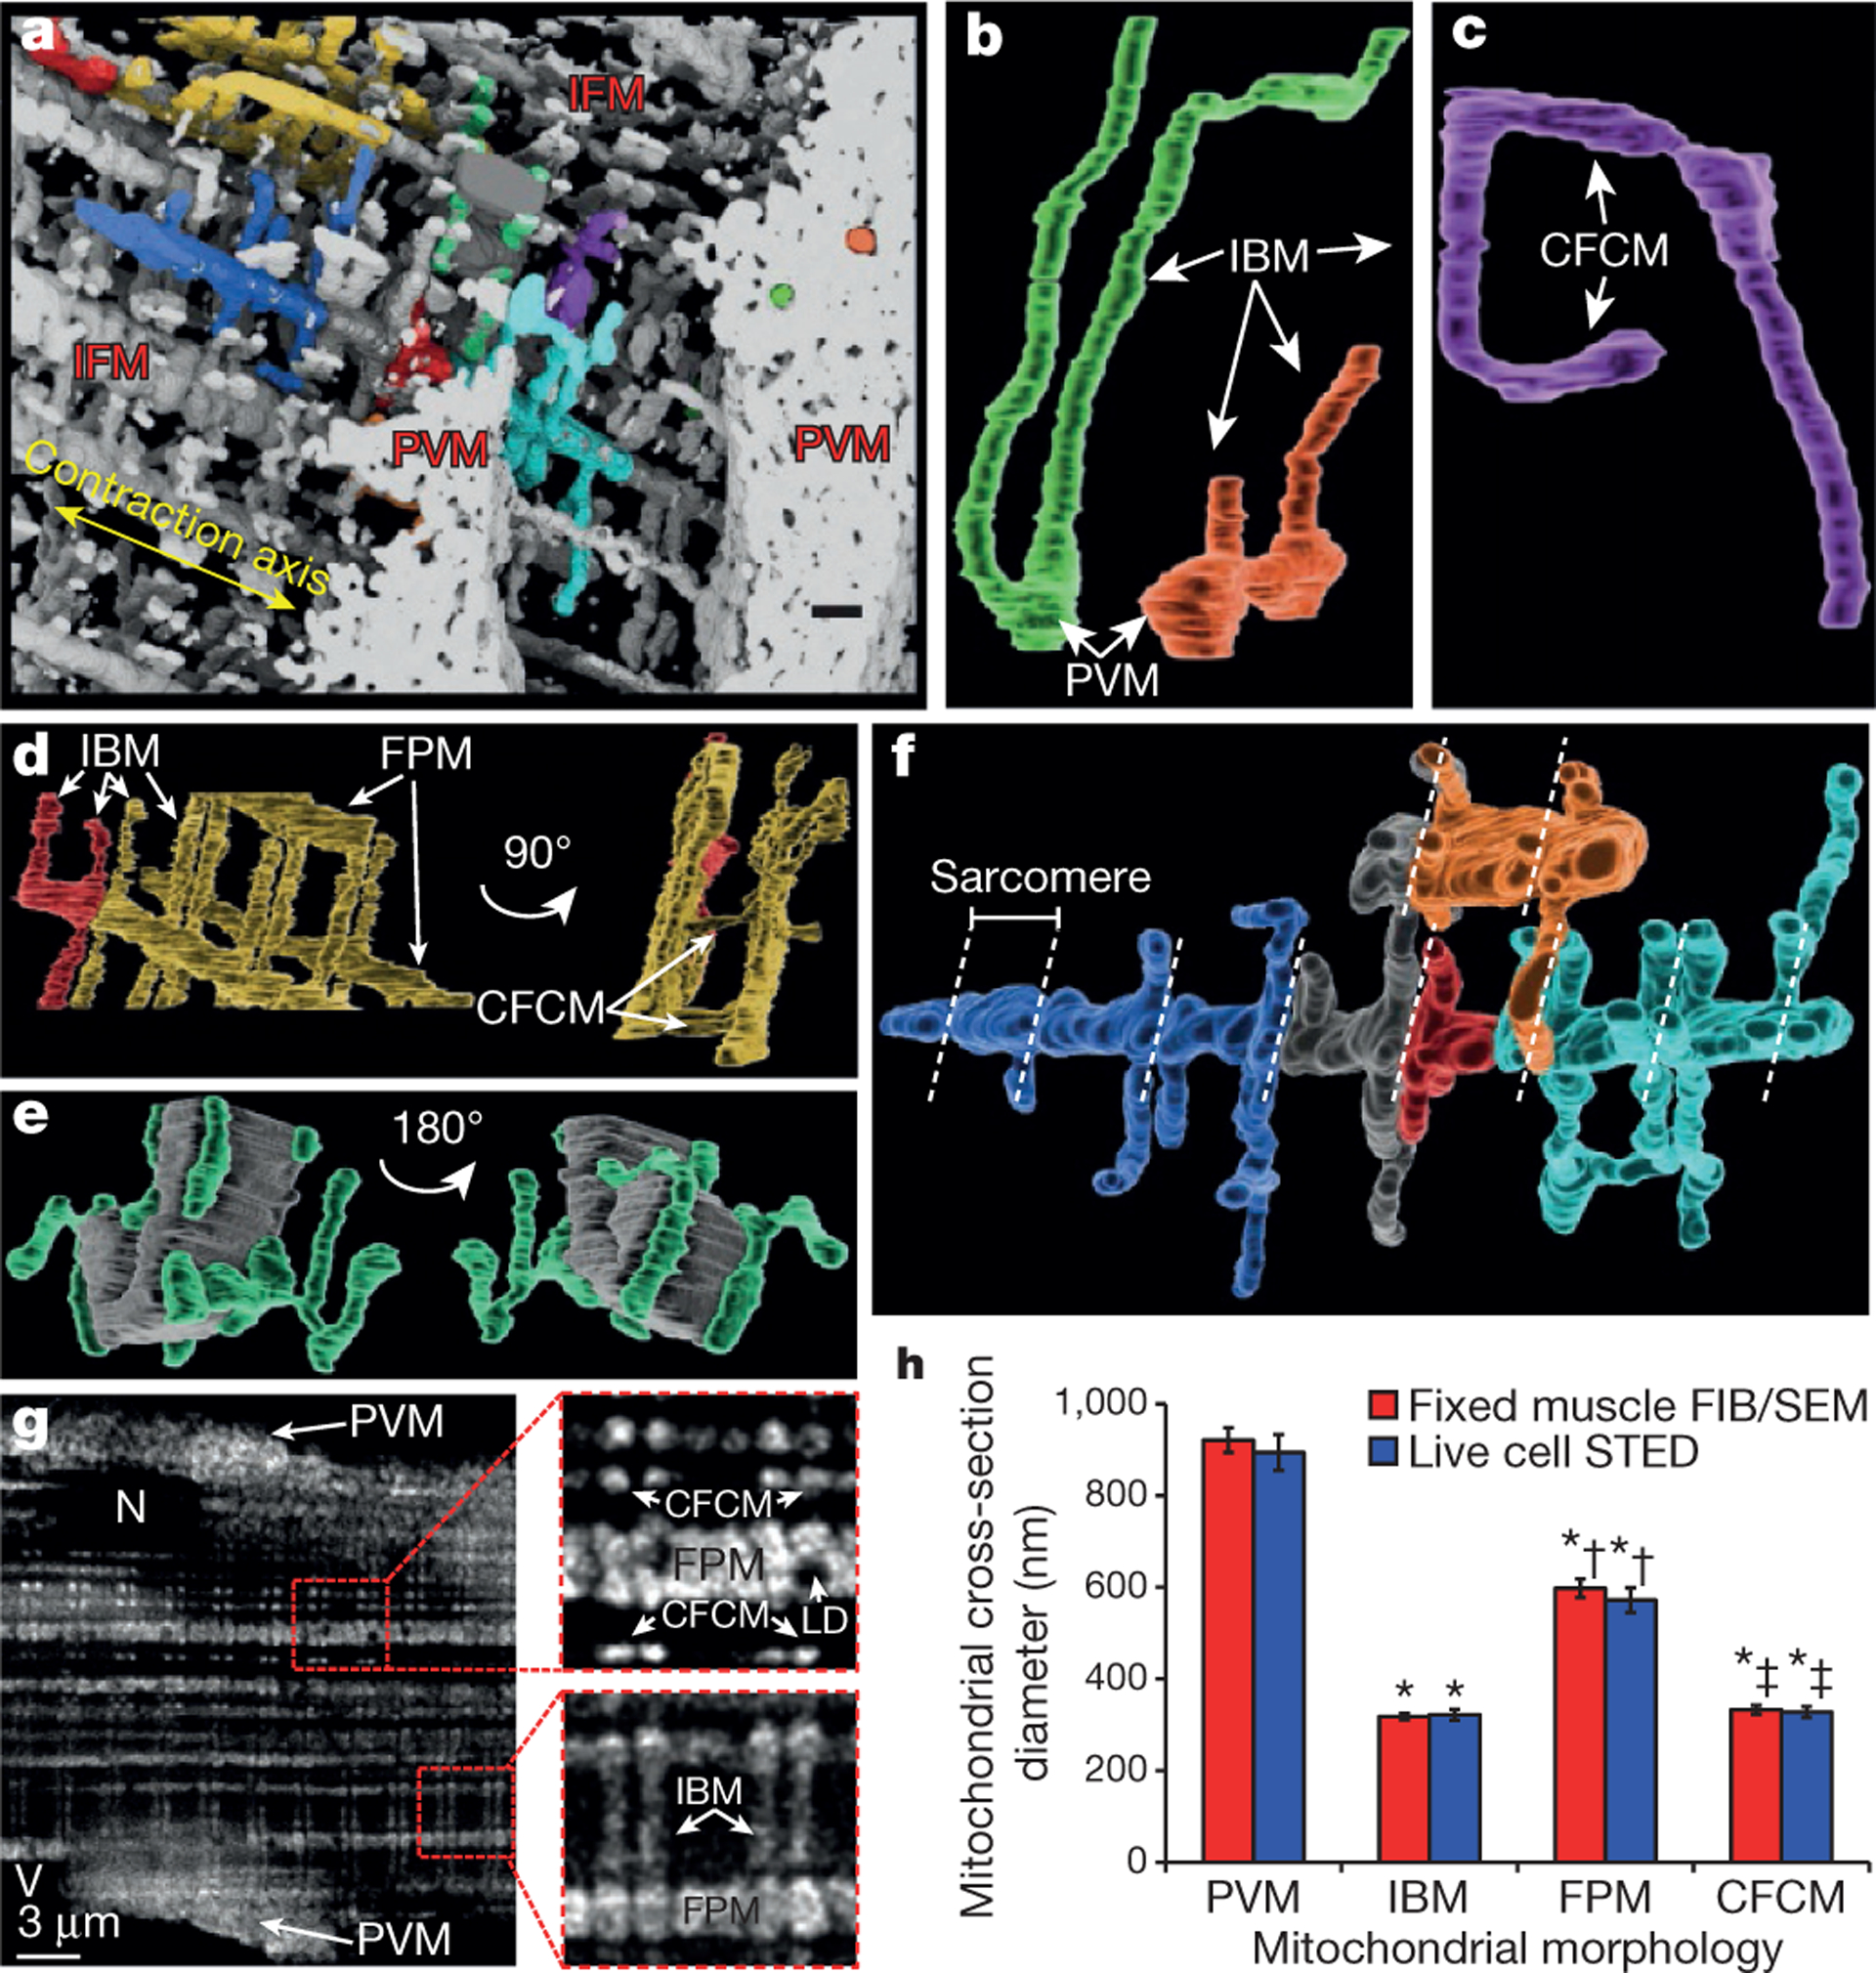
a, 3D rendering of mitochondria from FIB-SEM volume. Non-white colours indicate individual mitochondria. Scale bar, 750 nm. b, PVM projecting into IBM. c, Mitochondrion showing IBM and CFCM. d, Repeating connections between IBM and FPM. e, Myofibril (grey) and associated mitochondria (green). f, FPM with IBM and CFCM branches. Dotted lines indicate z-lines. g, Deconvolved super-resolution image of TMRM-loaded myocyte. LD, lipid droplet. Insets are magnified 3× from original. h, Mean mitochondrial diameters. Error bars indicate standard error. Quantification from raw images. Significantly different from PVM (*), IBM (†), FPM (‡) (ANOVA, P < 0.05). Images represent data from: FIB-SEM, 8 fibres, 4 mice; STED, 13 fibres, 3 mice.
PVM were highly irregular (Supplementary Video 1), mostly ellipsoidal structures. Their maximal cross-sectional diameter ranged from 300 to 1,600 nm (Extended Data Table 1). PVM that were contiguous with IBM (21.2 ± 3.2% of 1,152 PVM analysed, 4 animals) were located primarily at the PVM–myofibril interface (Extended Data Fig. 1a). Although a small fraction of PVM was directly coupled to IBM, the entire PVM pool (99.9 ± 0.1%) was linked via electron-dense contact sites (EDCS) between membranes of adjacent PVM (Extended Data Fig. 1b). These apparently dynamic EDCS22,23 may represent sites of fission or fusion24 as well as simply reflect tight packing of the mitochondria; however, the functional significance of these junctions is poorly defined. If EDCS are electrically conductive, these sites would couple essentially all PVM directly to IBM running deep into the muscle, creating a functional syncytium with regard to the proton-motive force (ΔΨ + pH gradient across the inner mitochondrial membrane) to generate ATP.
IBM were regular cylinders with a maximal cross-sectional diameter range of <100–678 nm (Extended Data Table 1) and, often, lengths >20 μm (Fig. 2), suggesting that they extend deep into the tissue. FPM (Fig. 2d, f) displayed maximal cross-sectional diameters ranging from 362 to 1,495 nm (Extended Data Table 1). 99.7 ± 0.3% of FPM (n = 776, 4 FIB-SEM data sets, 4 animals) were associated with adjacent FPM through EDCS (Extended Data Fig. 1d). Interconnection of different intra-fibrillar mitochondrial (IFM) morphologies was extensive. Indeed, 81.7 ± 3.6% of FPM were directly connected (continuous outer membrane) to an IBM (Extended Data Fig. 1c, n = 305 mitochondria from 4 FIB-SEM data sets from 4 animals). Mitochondria lacking either direct or EDCS connections were rare (~1–2 per data set) and may reflect either damaged mitochondria removed from the network11 or newly formed mitochondria yet to establish a network connection10,11. For a better appreciation of the mitochondrial reticulum throughout the entire cell, we collected 3D, multiphoton microscopy (MPM) images of mitochondria-rich fibres in situ. Although the spatial resolution was ~20-fold lower than with FIB-SEM, these MPM images (Extended Data Fig. 2 and Supplementary Videos 3, 4 and 5) suggest that the morphology observed by FIB-SEM at the periphery of the fibre persists throughout the entire cell. Additionally, super-resolution microscopy of mitochondria using ΔΨ-dependent tetramethylrhodamine (TMRM) in live, isolated muscle fibres provided further validation that the mitochondrial morphologies observed with FIB-SEM are representative of the in vivo condition (Fig. 2g, h, Extended Data Fig. 3 and Supplementary Video 6).
On the basis of the mitochondrial structures, we hypothesized that PVM are primarily involved in generation of the proton-motive force near the capillaries, while IBM use the proton-motive force to produce ATP near the ATPase activity. Along this line of thought, the distribution of the enzymes associated with production and utilization of the proton-motive force may be linked to the function of PVM and IBM pools, thereby optimizing the regional inner membrane concentration of enzymes to its functional requirements. Again, the PVM generation of ΔΨ is delivered to the IBM system via the mitochondria reticulum. To test this hypothesis, we compared the cellular distribution of a proton-motive-force-generating element, complex IV, with the enzyme complex responsible for phosphorylation of ADP to ATP using the proton-motive force, complex V. Figure 3a–c shows that complex IV (green) was higher in the periphery of the cell, consistent with the PVM pool, while complex V (red) was more concentrated in the intra-fibrillar region (Fig. 3 and Supplementary Video 7). Notably, complex IV and complex V were found throughout the cell (Supplementary Video 8 and Extended Data Fig. 4), just at different proportions in the different mitochondrial pools. Antibody specificity was validated by the appearance of single bands corresponding to complexes IV and V in western blots of mitochondrial proteins separated by clear native PAGE (Extended Data Fig. 5).
Figure 3 |. Capacity for membrane potential conduction.
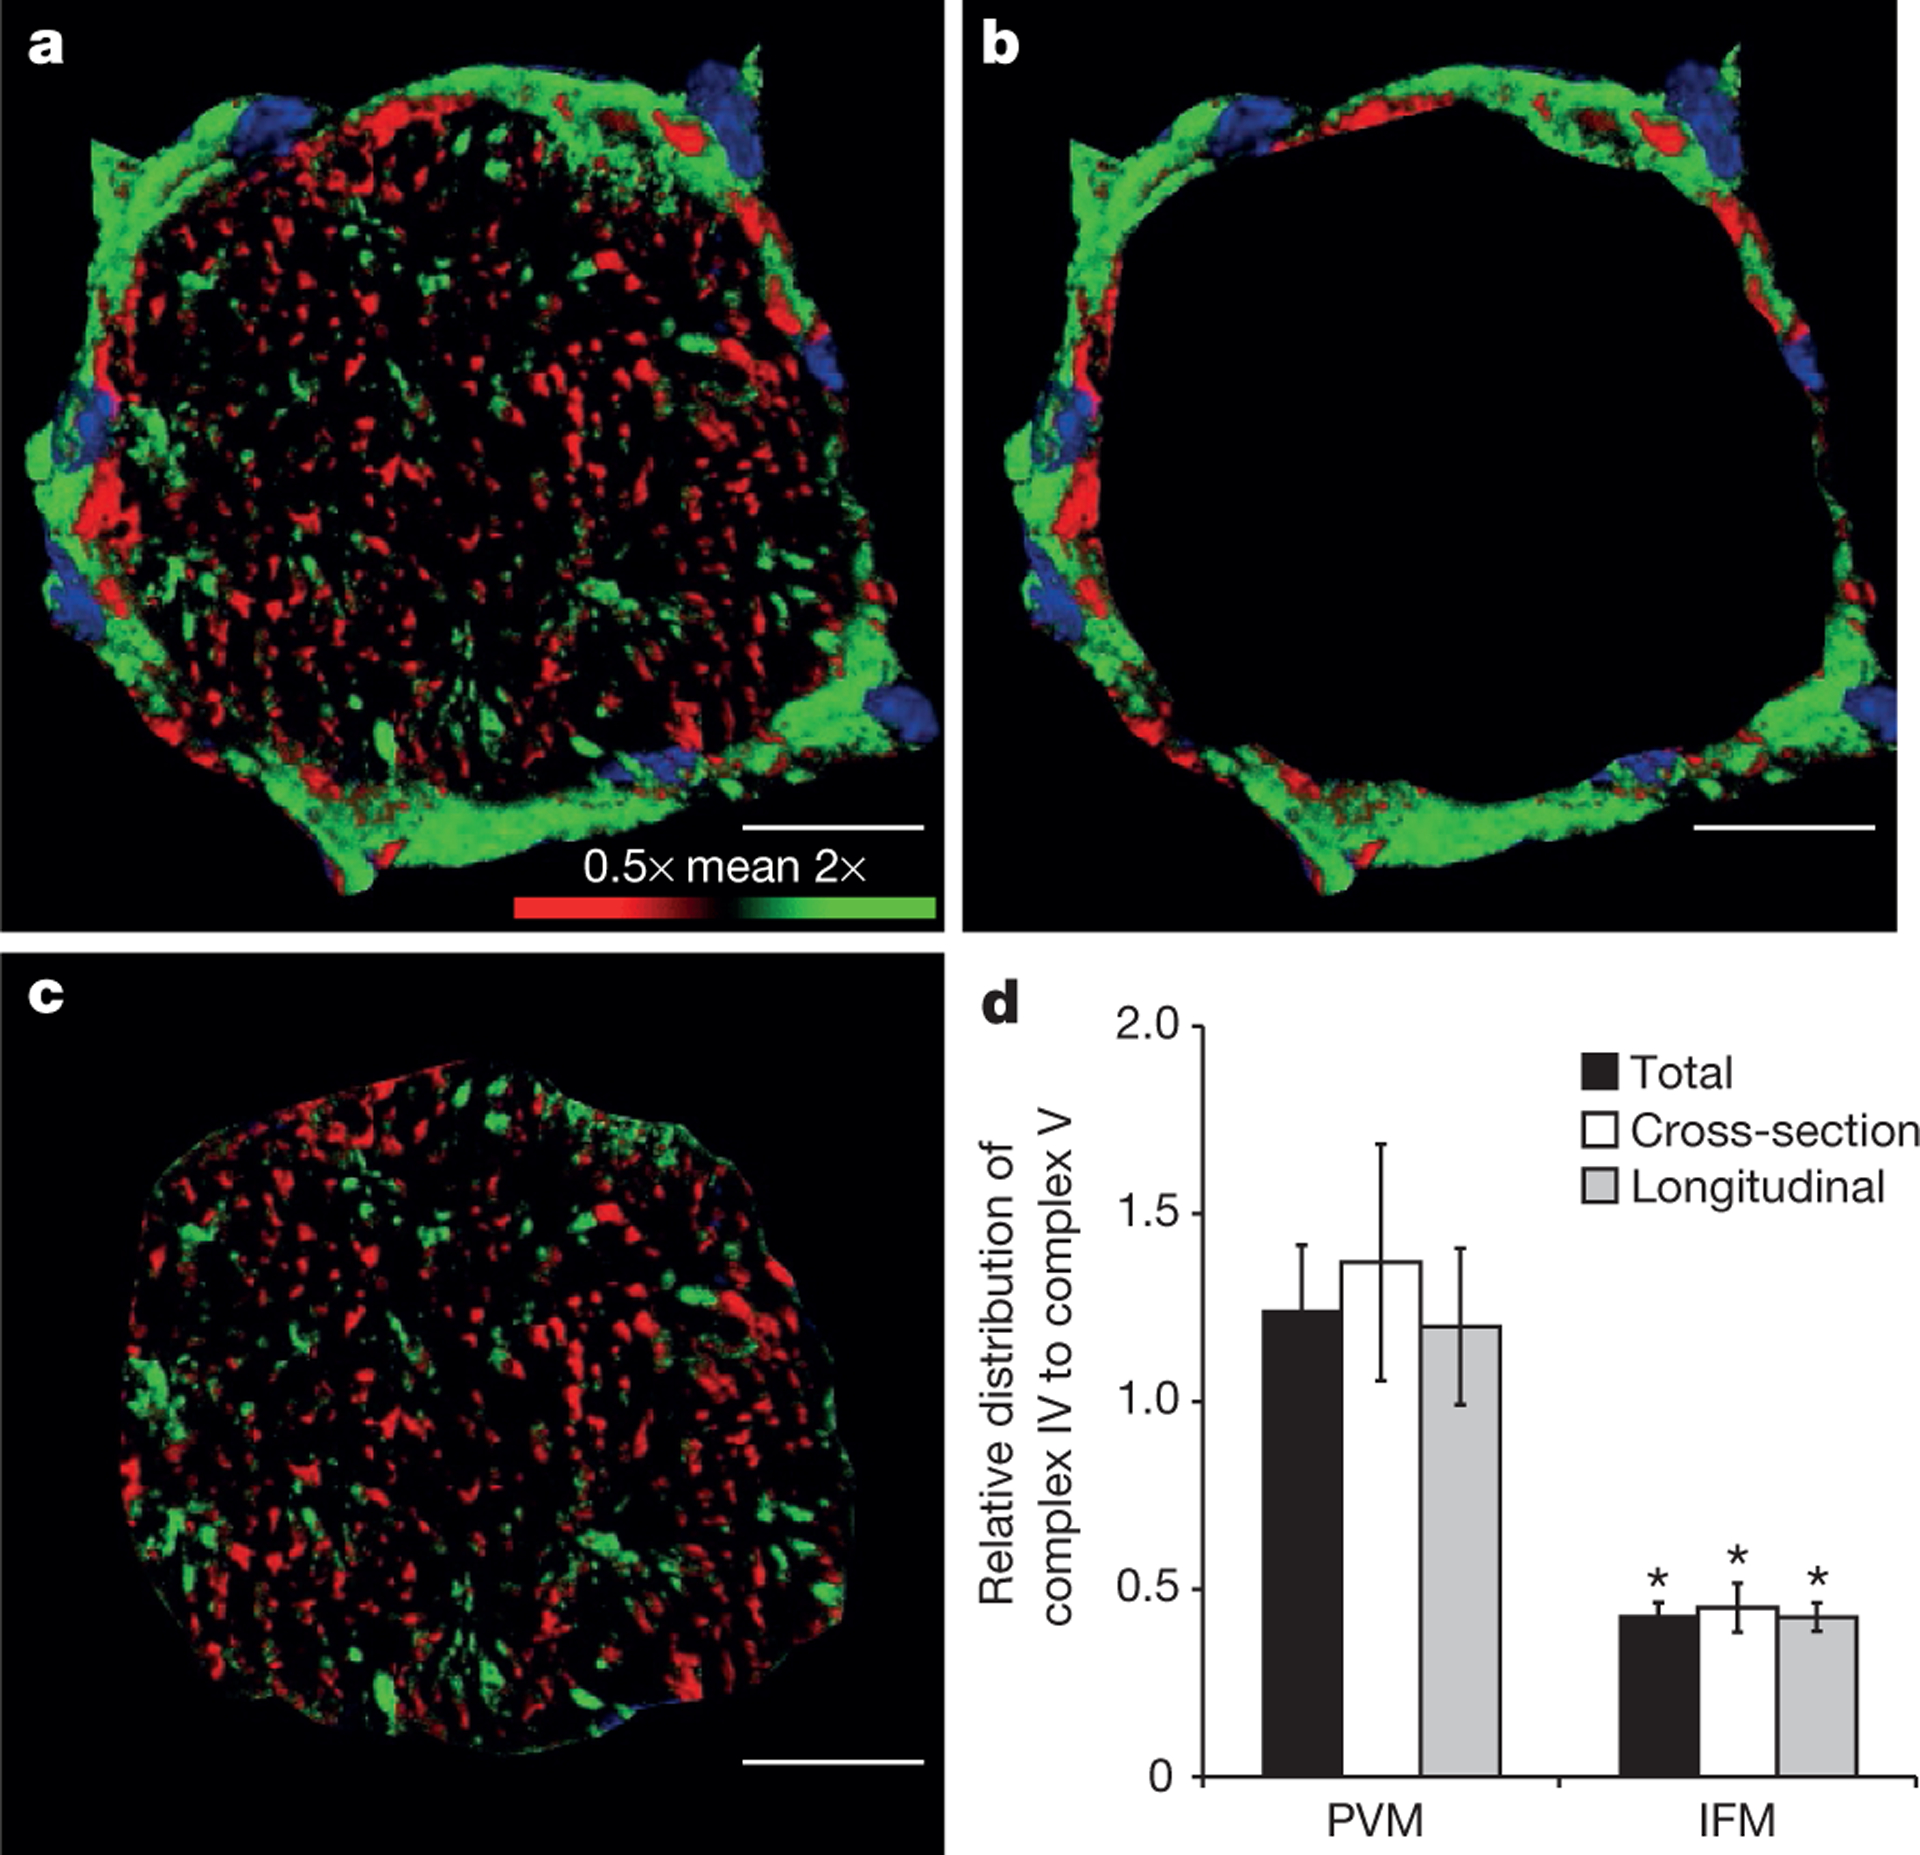
a, 3D rendering of muscle fibre immunostained for both complex IV and complex V. Confocal image coloured according to complex IV/complex V ratio. Relatively higher complex IV, green pixels; relatively higher complex V, red pixels. Nuclei, blue. b, c, Separation of PVM around fibre periphery (b) and IFM (c) within fibre as used for calculations. d, PVM have relatively greater capacity for membrane potential generation while IFM have greater capacity for membrane potential utilization. Images are representative of data from 12 fibres, 5 mice. Error bars indicate standard error. Asterisk indicates significantly different from PVM (paired t-test, P < 0.05). Scale bars, 15 μm.
To test our hypothesis that the mitochondrial reticulum is coupled via a contiguous matrix and/or EDCS, we performed localized mitochondrial uncoupling experiments and observed whether the associated drop in ΔΨ propagated throughout the mitochondrial pools in isolated muscle cells. In this study, we simulated an increase in intra-fibrillar complex V activity with a photo-activated uncoupler25 and observed the cellular topology of ΔΨ via TMRM distribution. Upon a mild depolarization of a small interior cell region, a rapid (<200 ms) and near-uniform drop in ΔΨ occurred across the cell, including a homogenous decrease in the PVM, seen as a redistribution of TMRM from mitochondria to cytosol and nuclei (Fig. 4 and Supplementary Video 9). Note that capillary grooves in the sarcolemma and adjacent PVM7 are still present even after vessel removal by the fibre isolation process (Extended Data Fig. 6). Figure 4k shows the mean post/pre change in TMRM intensity for mitochondrial and cytosolic plus nuclear pixels in each cell region. This analysis resulted in isolated signals from the cytosol, nucleus and PVM pools. However, all of the intra-fibrillar mitochondria were grouped together in this analysis. While linear intensity analysis (Extended Data Fig. 7a–d) could be used to assess IBM in some cases, any inclusion of FPM in the analysis window would be confounding, thereby limiting the image regions available for analysis. We were able to isolate the entire IBM pool based on their regular ~2 μm spacing (or 0.5 μm−1 spatial frequency) using a horizontal fast Fourier transform (FFT). A decrease (61 ± 3% (n = 9)) in the FFT-detected IBM pool occurred with a more even TMRM distribution between the IBM and cytosol (Extended Data Fig. 7e, f). Conversely, ultraviolet (UV) exposure in control cells resulted in a small, uniform drop in TMRM in both the cytosol and mitochondria in the stimulated region, consistent with slight TMRM photobleaching, and little effect in other regions of the cell, including the IBM pool (Extended Data Figs 7f and 8 and Supplementary Video 10). Restriction of UV light to designated regions of interest (ROIs) was confirmed in fluorescent test slides (Extended Data Fig. 9).
Figure 4 |. Mitochondrial membrane potential conduction.
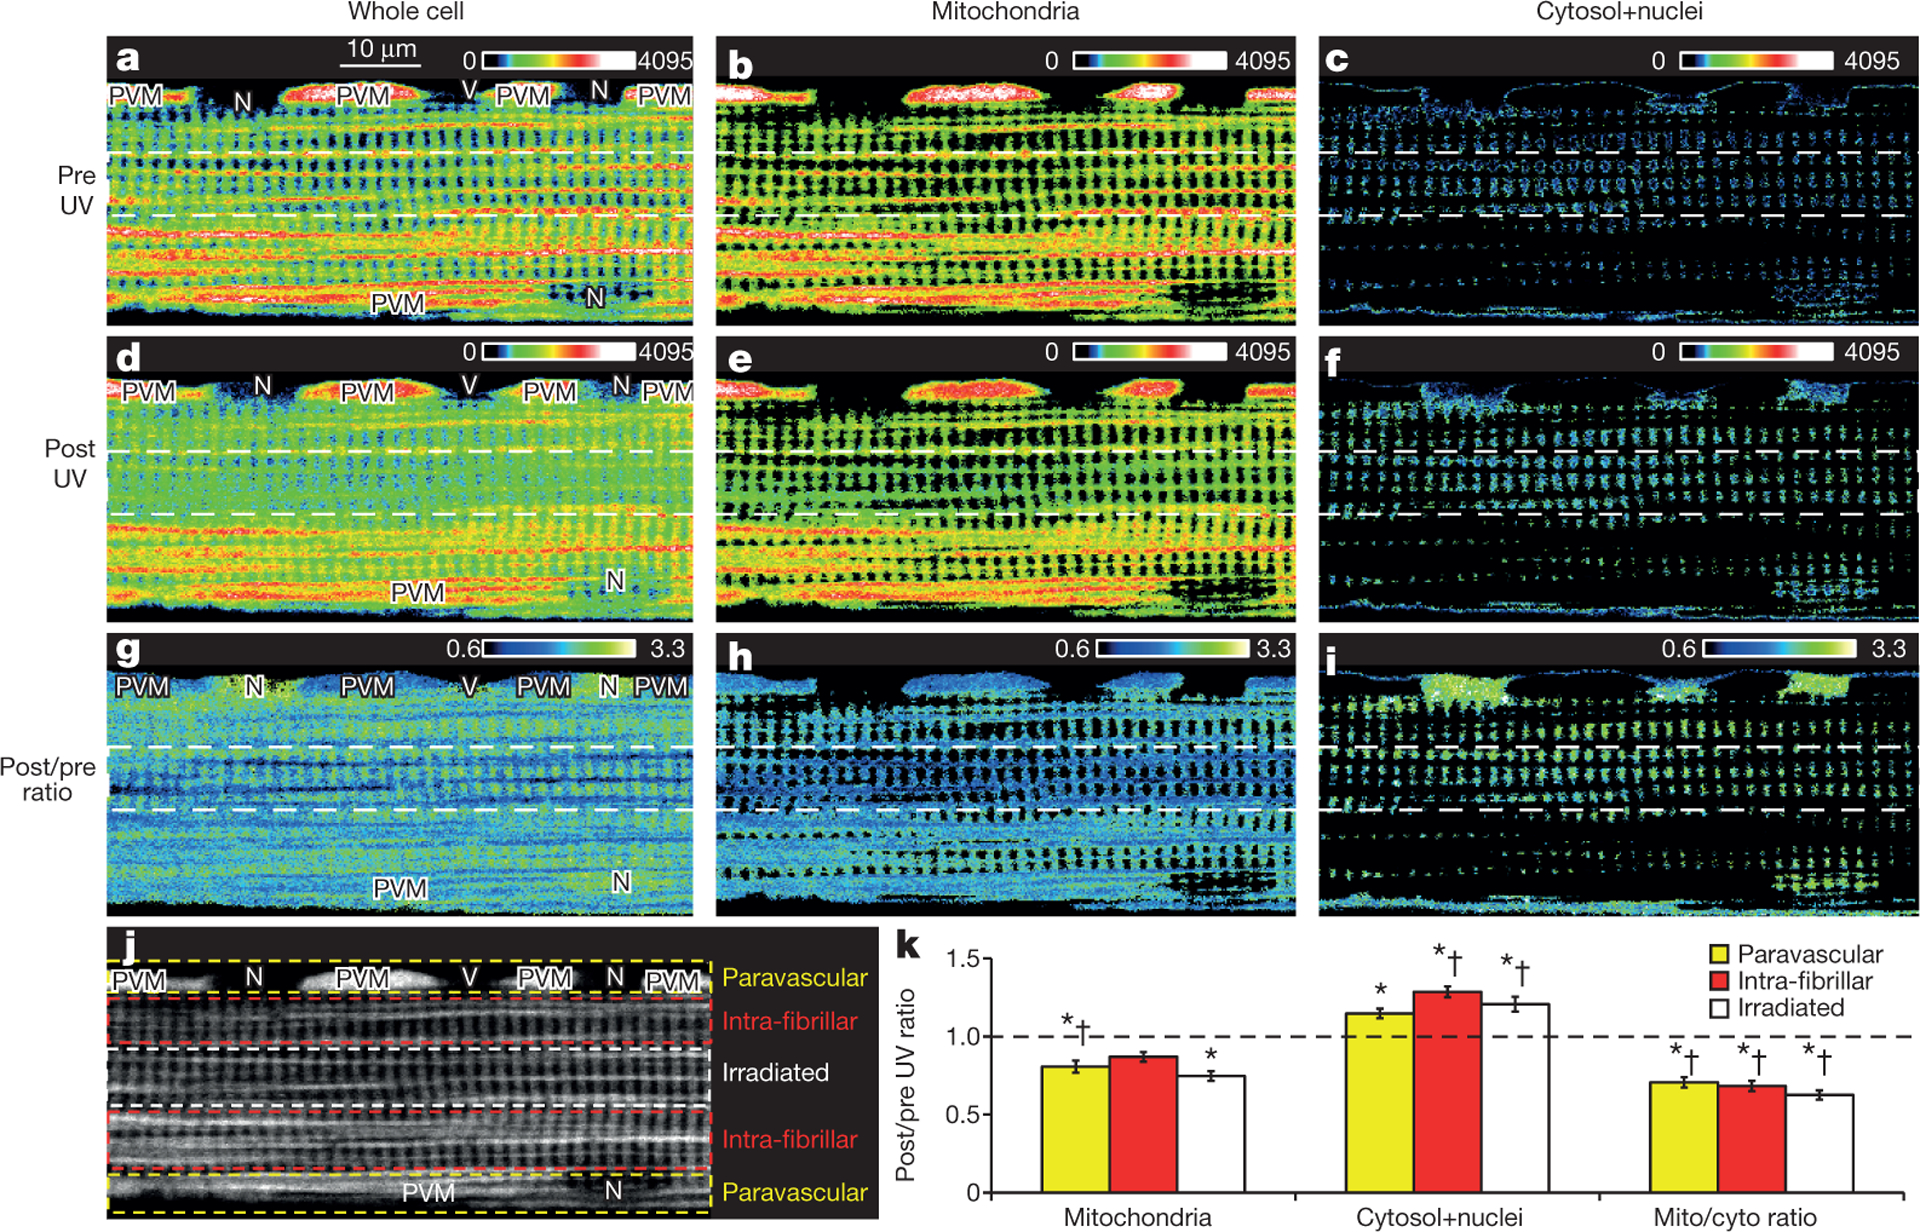
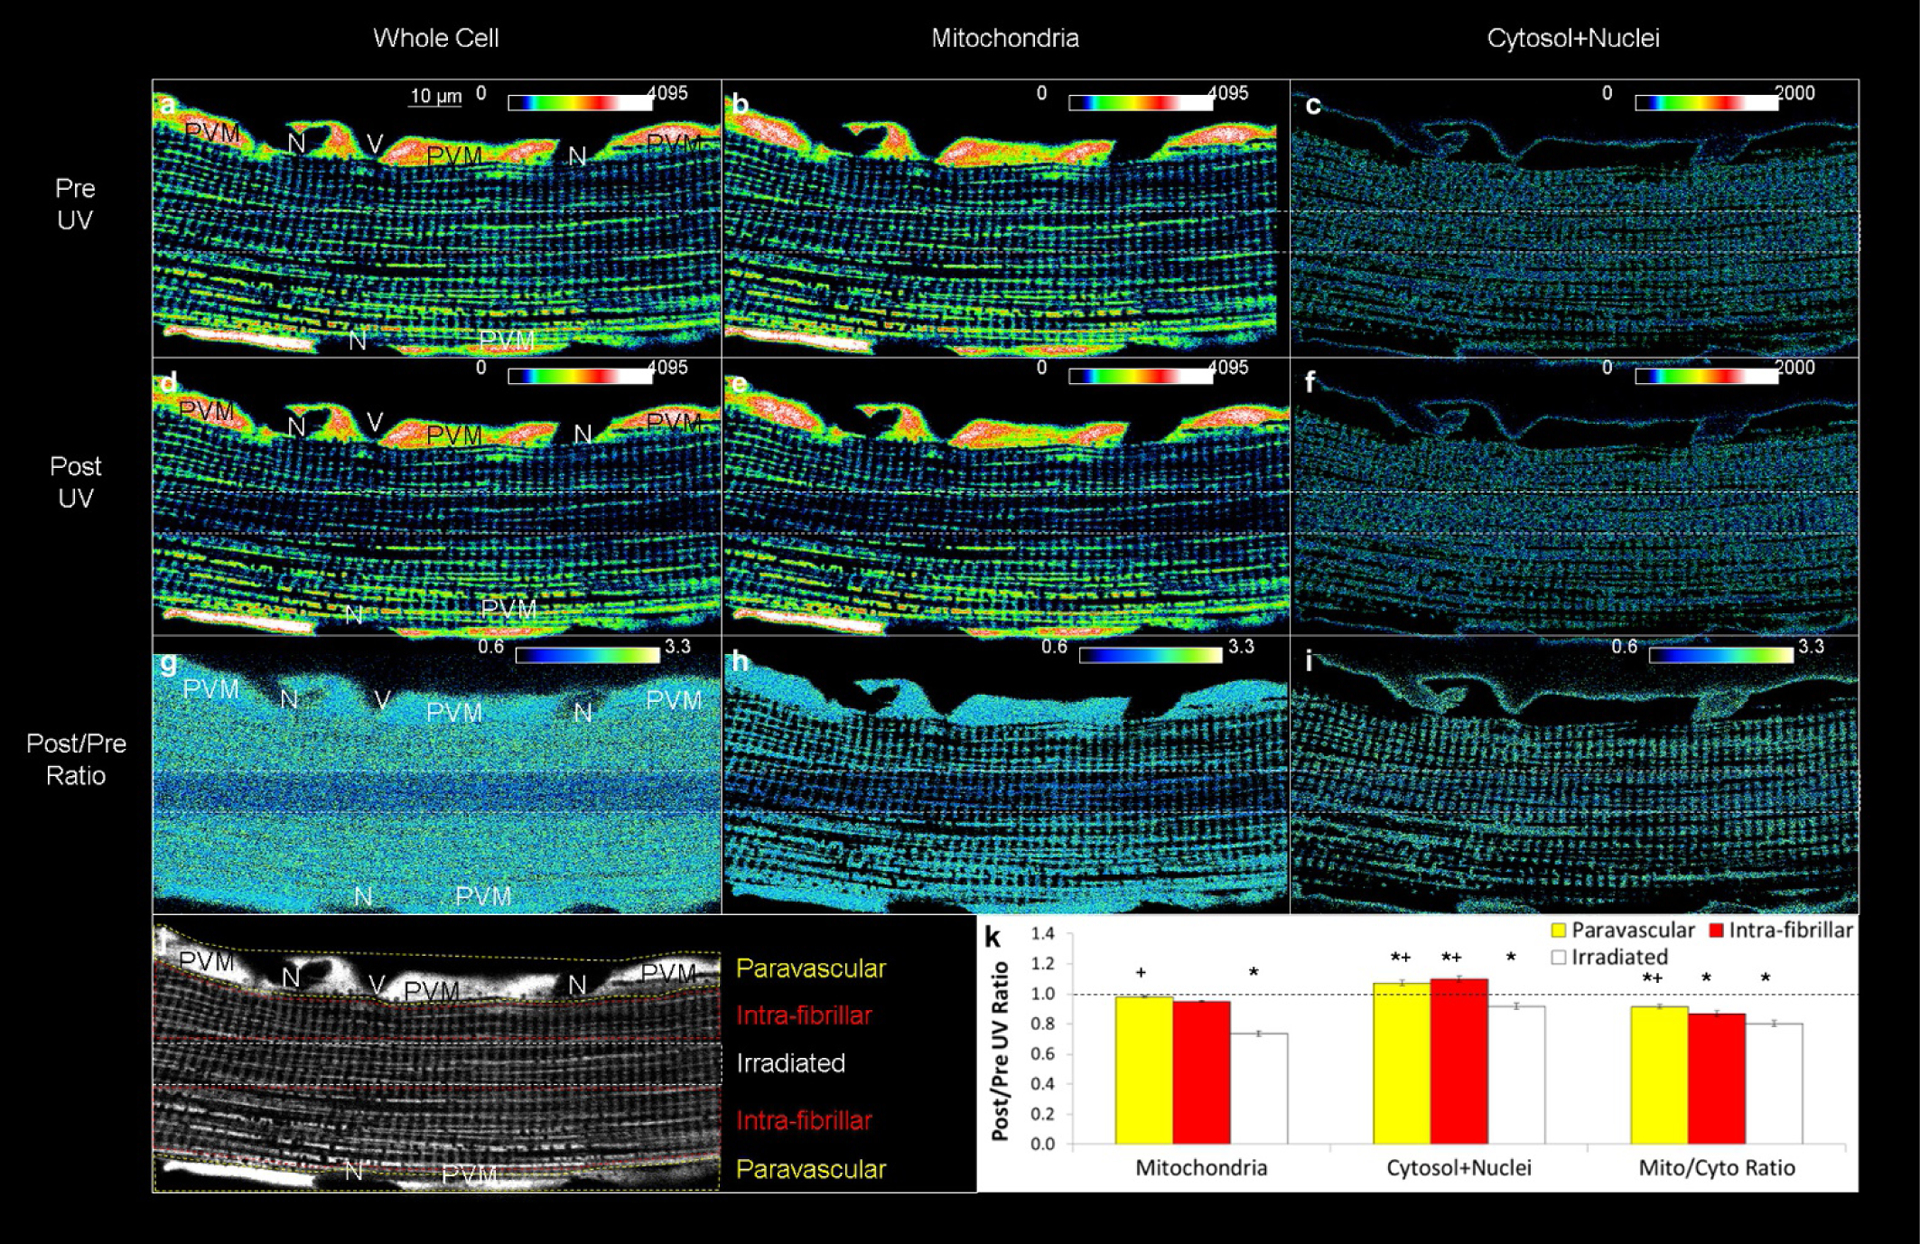
Regional uncoupling of fibre loaded with TMRM and MitoPhotoDNP. White dotted lines indicate region of MitoPhotoDNP UV activation. a–c, Pre-UV whole-cell (a), mitochondria (b) and cytosol plus nuclei (c) images. d–f, Post-UV whole-cell (d), mitochondria (e) and cytosol plus nuclei(f) images. g–i, Post/pre-UV ratios for whole-cell (g), mitochondria (h) and cytosol plus nuclei (i). j, Cell regions. k, Near-uniform redistribution of TMRM from mitochondria to cytosol plus nuclei consistent with homogenous depolarization of all cell regions. Mean ± standard error from 11 experiments, 4 animals. Significantly different (ANOVA, P < 0.05) values are indicated for post/pre ratio of 1.0 (*), control (†) (Extended Data Fig. 8). No statistical differences between cell regions.
These data are consistent with a tight, rapid electrical coupling mechanism between mitochondria, and that the PVM pool is a functional syncytium with regard to ΔΨ. The rapid, homogeneous response to the modest uncoupling, as shown in Fig. 4 and Supplementary Video 9, is indicative of a highly coupled, conductive network, although the mechanisms for this are yet to be fully resolved. We suggest, based on our structural data, that the contiguous matrix elements between mitochondrial pools are one of the obvious conductive elements of the network. We speculate that the EDCS are also conductive elements specifically within the PVM and FPM pools. Mitochondrial fission and fusion26 may also have a role in reticulum development and modulation. It is important to note that the putative conduction through the EDCS could also be dynamically modulated to affect mitochondrial electrical coupling.
Energy requirements in skeletal muscle can nearly instantaneously increase by more than 100-fold during intense contraction27. Thus, using electrical conduction as opposed to oxygen or ATP diffusion is a more effective way to quickly and uniformly distribute energy throughout these cells and may explain why disruption of the known ATP and oxygen facilitated diffusion systems results in only modest phenotype changes3,6,7. If electrical conduction via the mitochondrial reticulum is the major mechanism for potential energy distribution within the cell, this raises the question of why such a large investment in creatine kinase, creatine and myoglobin has been retained by the muscle. In the knockouts of these systems, small decrements, ~10%, in peak performance have been noted. Although these are often discounted as small effects, a 10% advantage in peak muscle performance would probably provide a significant evolutionary advantage, justifying the retention or development of these two complementary systems. As a reference, athletic performance is often measured in fractions of a per cent; evolutionary advantages might have a similar sensitivity. We propose that this conductive pathway is the major mechanism for energy distribution in skeletal muscle cells under normal conditions, and the metabolite facilitated diffusion pathways only become significant as one approaches maximum performance levels.
METHODS
Mice.
Male C57BL/6 mice, 2–4 months old, were purchased from Taconic Farms (Germantown, NY). All mice were fed ad libitum and kept on a 12 h light, 12 h dark cycle at 20–26 °C. The experiments were not randomized; the investigators were not blinded to allocation during experiments and outcome assessment.
Animal preparation.
All procedures were approved by the National Heart, Lung, and Blood Institute Animal Care and Use Committee and performed in accordance with the guidelines described in the Animal Care and Welfare Act (7 USC 2144). Mice were anaesthetized and the tibialis anterior (TA) muscle prepared by removing the skin and outer layers of fascia as described previously28.
Focused ion beam scanning electron microscopy (FIB-SEM).
Mouse hindlimbs were stabilized in the lengthened position and submerged in vivo in 5% glutaraldehyde in 0.12 M sodium cacodylate, pH 7.35 (fixative) for 15 min. After initial fixation, the TA was excised, placed into fresh, cold fixative, and cut into small strips. Fixed muscles were post-fixed with 1% osmium tetroxide, stained with 1% uranyl acetate, dehydrated with an ethanol series and propylene oxide, and embedded in EMbed-812 (Electron Microscopy Sciences, Hatfield, PA).
Nine data sets of mouse tibialis anterior muscle from four animals were collected on mitochondria-rich skeletal muscle fibres. One data set failed due to technical difficulties during data collection. A Zeiss Nvision 40 microscope was used for FIB-SEM imaging. The areas of muscle were chosen for FIB-SEM data collection following survey of 0.5–1-μm-thick sections of resin-embedded muscle tissue; sections were created using an Ultracut S microtome from Leica Microsystems. The sections were stained with Azure II/Toluidine blue that imparts colour to common morphological elements such as nuclei, plasma membranes and mitochondria. Once stained, the orientation and morphology were assessed using a light microscope. Muscle fibres were selected based on the presence of large accumulations of mitochondria in the paravascular region adjacent to a capillary embedded in the muscle cell7. Muscle fibres in the correct orientation with good morphology were chosen for FIB-SEM data collection and digital images were taken at 10×, 40× and 60× magnification. These images were used as maps to pinpoint the previously selected areas for data collection in the FIB-SEM.
SEM images were collected with 1.5 kV landing energy using the ESB (backscattered electron) detector. Parameters were chosen to provide 8-bit images with pixel sizes x = 5 nm, pixel size y = 5 nm, and z thickness = 15 nm. The FIB aperture sizes used for data collection were 300 pA and 700 pA. Automated data collection was performed using Atlas 3D software, which is integrated into the Zeiss platform, manufactured by Fibics29.
Focused ion beam scanning electron microscopy image processing and analysis.
Images (tifs) of each data set were aligned to each other using a cross-correlation algorithm30, then binned 3 × 3 in x and y directions to create isotropic volumes with edge dimensions of 15 nm. These volumes were initially analysed using IMOD open source software package31. Whole image segmentation was performed by first applying a 3D, two pixel median filter on a FIB-SEM data set and then manually adjusting the threshold to create binary images primarily including only mitochondria, myofibrils, nuclei, blood vessels, red blood cells, and/or z-lines. Thresholding often resulted in inclusion of two or more types of cellular structures. Individual structures were then segmented by subtracting images that had been differentially thresholded and/or using the Remove Outliers tool in ImageJ (National Institutes of Health, Bethesda, MD).
Using the TRAKEM2 plugin in ImageJ, the mitochondrial volumes were manually traced throughout the 3D volumes by two different observers. Most of the IBM structures were limited by the field of view of the 3D volumes, thus, the long axis extent of these structures through the cell were potentially grossly underestimated. For studies designed to estimate the number of PVM or FPM that have direct coupling to the IBM (that is, a continuous outer membrane), tracking was initiated at the middle of the 3D stack to minimize the effect of the field of view on detecting complete mitochondrial volumes. All PVM or FPM were then tracked through the 3D volume. Those mitochondria with a continuous projection into an IBM were labelled with a green spot. Those without a projection to an IBM were labelled with a red spot. PVM or FPM that continued out of the field of view without an IBM projection were labelled with a blue spot.
To determine the potential network of coupling between the mitochondria via EDCS, the same mid-volume planes were used. Initiating in the centre of a PVM pool or in the intra-fibrillar space for FPM analysis, every mitochondrion that was ‘connected’ via an EDCS was marked with a magenta marker. The PVM with IBM projections were also labelled with a green marker. Thus, PVM that project into IBM and also have EDCS were labelled with both green and magenta dots. The EDCS coupled most PVM and most FPM even without looking through the entire 3D volume. However, when using the full 3D volume, nearly all of the mitochondria were coupled via the EDCS structures. Mitochondria not coupled via an EDCS were labelled in orange in these studies; uncoupled mitochondria were rarely observed.
Transmission electron microscopy.
Selected specimens for FIB-SEM imaging were sectioned to produce ~100–150-nm-sized thin sections that were stained with uranyl acetate and lead citrate before imaging on a JEM 1400 electron microscope (JEOL USA, Peabody, MA) with an AMT XR-111 digital camera (Advanced Microscopy Techniques Corporation, Woburn, MA).
Multi-photon image acquisition.
Mouse TA muscles were imaged in situ after cutting the hindlimb just above the knee, leaving the lower hindlimb and the origin and insertion of the TA intact. The lower hindlimb was placed in a deformable cast in a Petri dish with the TA in the lengthened position and immersed in phosphate-buffered saline. Images were acquired using a Leica TCS SP5 II upright, resonant scanning, multi-photon microscope with a Nikon 25X, 1.1 NA water immersion objective. The exposed muscle was imaged with a pulsed Ti:sapphire laser tuned to 720 nm (Spectra Physics, Irvine, CA, USA), and all emitted light was collected by two hybrid detectors (HyDs, Leica Microsystems) separated by a 545 nm dichroic mirror. 3D image stacks of endogenous NAD(P)H were collected as 1,024 × 1,024 pixel, 12-bit images with 100 nm x and y pixel sizes and 100 nm z-steps between images. Image stacks were deconvolved using the measured point spread function and the 3D Parallel Iterative Deconvolution plugin in ImageJ for presentation purposes only.
Dual muscle section immunostaining.
Mouse TA muscles were frozen in the lengthened position and embedded in optimal cutting temperature compound (OCT). Cryosections were cut and air dried for 5 min before fixation in 10% buffered formalin for 7 min at room temperature for confocal imaging. Samples were washed three times in PBS for 5 min each and permeabilized with 0.01% Triton-X 100 in PBS for 5 min. Sections were blocked with 10% goat serum for 20 min before incubation with primary antibodies. Distribution of Complex V was assessed using anti-ATPB rabbit polyclonal IgG antibody from Abcam (ab128743; Cambridge, MA) and complex IV distribution was assessed with anti-complex IV subunit I mouse monoclonal IgG2a from Life Technologies (1D6E1A8; Grand Island, NY). Primary antibodies were incubated overnight at 4 °C at 1:75 (complex V) and 1:40 (complex IV) dilutions. After three 5 min washes in PBS, samples were incubated with secondary antibodies for 1 h at room temperature. Secondary antibodies used were TRITC goat, anti-rabbit IgG (1:100) and FITC goat, anti-mouse IgG (1:100) from Jackson ImmunoResearch Laboratories (West Grove, PA) for confocal imaging. To reduce non-specific binding of the anti-mouse secondary antibody, the MOM Fluorescein Kit from Vector Laboratories (Burlingame, CA) was used. Samples were then washed with PBS and mounted with VectaShield and DAPI (Vector) for confocal imaging. Slides were prepared for sections with each primary antibody separately, both antibodies together, and with primary antibodies omitted (negative control) from 6 TA muscles from 5 mice. No statistical methods were used to predetermine sample size—with the limited information available, we selected the sample size based on prior experience with immunostaining procedures in muscle.
Immunostained muscle image acquisition.
For confocal imaging, stacks of high resolution, 12 bit images (100 nm x and y pixel size) were collected sequentially throughout the depth of skeletal muscle tissue sections at 0.2 μm depth intervals using a 63× 1.4 NA oil immersion objective on a Leica SP5 confocal system (Leica Microsystems, Mannheim, Germany), or with a 63× 1.4 NA oil immersion objective on a Zeiss LSM780 confocal microscope (Carl Zeiss MicroImaging, Jena, Germany). FITC-labelled samples were imaged with a 488-nm excitation laser and a 505–550 nm acquisition window and TRITC-labelled samples were imaged with a 561-nm excitation laser and a 570–620 nm acquisition window. DAPI-labelled samples were imaged with a 405 nm excitation laser and a 430–490 nm acquisition window.
Immunostained muscle image analysis.
Spatial, ratiometric analysis of the distribution of complex IV and V within the muscle was performed. First, binary image masks were created by thresholding the 3D image stacks for both the complex IV and V signals, thereby allowing the removal of all pixels with negligible signal. Thus, ratiometric analysis proceeded only for pixels where signal could be detected. Thresholding was performed in ImageJ using Li’s Minimum Cross Entropy thresholding method. Ratio images were created by dividing the complex IV signal by the complex V signal for all remaining pixels. The look-up table for the ratiometric images was set as follows: the mean of the middle 80% of the data and removed pixels were set to black; green intensity was linearly increased from 0 at the mean up to 255 at 2× mean and above; red intensity was linearly increased from 0 at the mean up to 255 at 0.5× mean and below. The look-up table is included in Fig. 4a for reference. The spatial distribution of green (relatively higher complex IV) and red (relatively higher complex V) pixels was assessed for the PVM and IFM pools by tracing the outer boundary of the fibre and tracing the inner boundary of the PVM pool, allowing separate analysis of each region. The total intensity of green pixels was divided by the total intensity of red pixels for each region. This analysis was performed on 12 total fibres from 5 mice: 6 fibres in cross-section and 6 in longitudinal section.
Additionally, the fluorescent intensity profiles of the complex IV and V signals were assessed individually with respect to their distance from the fibre boundary. The background fluorescence for each channel was determined as the mean of a manually drawn ROI outside the fibre of interest where no other fibre was present. Background was subtracted from all pixels in each image. A binary mask of the fibre was created by manually tracing the fibre of interest, and a distance map from the fibre boundary was created using ImageJ. This distance map allowed for the selection of all pixels in the complex IV and V images that were a given distance from the fibre boundary and the mean value for each distance calculated. This was performed for both the complex IV and complex V signals individually. For a given image, all values for the complex IV intensity profile were divided by the maximal complex IV signal measured near the fibre boundary and all values for the complex V intensity profile were divided by the maximal complex V signal measured near the fibre boundary. This analysis was performed on images of 4 fibres from 4 mice.
Clear native PAGE and western blotting.
Mouse skeletal muscle mitochondria were used to test the specificity of the primary antibodies used in the whole muscle immunostaining studies. Skeletal muscles from the hindlimbs of two mice (~2.5 g) were dissected and combined for mitochondrial isolation as described previously32 except omitting the Percoll gradient and subsequent washes. Cytochrome a,a3 (cyt a) content was determined as described previously33. Clear Native (CN) PAGE was performed using the NativePAGE Novex Bis-Tris System (Invitrogen, Carlsbad, CA) with 4–16% 1 mm bis-tris gels and the anode and cathode buffers for high resolution CN PAGE 2 (hrCNE2)34. Mitochondria (10 pmol cyt a) were solubilized with 3% w/v dodecyl maltoside and added to each lane and run at 4 °C for 1 h at 150 V and 1.3 h at 250 V. Proteins were transferred to a PVDF membrane using a XCELL II blot module (Invitrogen, Carlsbad, CA) at 25 V for 3 h at 4 °C. After transfer, the PVDF membrane was incubated in 8% acetic acid for 15 min, rinsed with water, placed in Pierce StartingBlock buffer (ThermoScientific, Rockford, IL) for 1 h at room temperature, and incubated in the primary antibodies used above (1:1,000 in StartingBlock) overnight at 4 °C. The membrane was then washed for 20 min in StartingBlock buffer and two more times for 20 min in PBS + 0.05% Tween 20. Incubation with secondary antibodies (Alexa 488 donkey anti-mouse IgG and Alexa 488 goat, anti-rabbit IgG, Abcam 150105 and 150077, respectively) was done at a 1:10,000 dilution in PBS + Tween 20 for 1.5 h at room temperature in the dark. Membranes were washed 2× in PBS + Tween 20 for 20 min in the dark and imaged on a Typhoon variable mode imager.
Single muscle fibre isolation and imaging.
For these studies, mouse soleus muscle fibres were used to increase the probability of acquiring mitochondria-rich muscle fibres. The basic incubation medium (IM) was composed of (in mM): NaHEPES (10), NaCl (137), KCl (5.4), CaCl2 (1.8), MgCl2 (0.5), NaPO4 (0.5), glucose (10), NaPyruvate (1) and butanedione monoxomine (BDM, 20). The soleus muscles were quickly isolated tendon to tendon. The intact muscle was then placed in the IM solution containing 3 mg ml−1 collagenase D (Roche) for 30 to 45 min in a shaking water bath at 37 °C. The tissue was removed from the collagenase solution and placed in the IM solution alone. The fibres were gently teased from the muscle bundle and long, non-contracted fibres were used for study. For TMRM labelling, the fibres were incubated in IM containing 5 nM TMRM for >20 min. For regional uncoupling of mitochondria, MitoPhotoDNP25, a gift from S. Caldwell and R. Hartley (University of Glasgow), was used. In this preparation, we found that we needed an incubation concentration of 20 μM for approximately 30 min at room temperature to achieve adequate loading of the mitochondria. The loaded cells with TMRM and MitoPhotoDNP still in the IM were transferred to a Petri dish with a no. 1.5 coverglass bottom (MatTek) treated with Cell-Tak (BD Bioscience) for microscopy.
Confocal microscopy was conducted on an inverted ZEISS 780 with a 40×, 1.2 NA water objective. 976 × 976 pixel, 12-bit images of 106.3 × 106.3 μm were collected while TMRM was excited with a 561 nm laser at 0.2% power. Emitted light was collected from 570 nm to 695 nm. To photoactivate MitoPhotoDNP, an ROI was drawn along the longitudinal axis within the centre of the cell and exposed to UV light from a 355 nm laser (Coherent Inc.) at 40% power for 10 iterations. It is important to note that the mild depolarization used here is of similar magnitude to the full change in membrane potential of mitochondria moving from resting to maximally active states (so called State 4 to State 3 transition) where the ~200 mV membrane potential decreases by only 10–20%. To be physiologically relevant, any conductive mechanisms must be responsive to small changes in membrane potential. In control experiments, fibres which were not loaded with MitoPhotoDNP were exposed to an identical dose of UV light in an ROI in the centre of the cell. Experiments were only performed on fibres with a strong and homogeneous TMRM signal as low and heterogeneous signals are potential signs of a damage caused by the isolation process.
Quantitative image analysis was performed using ImageJ on an average of five images taken before (Pre) and of five images taken immediately after UV exposure/MitoPhotoDNP release (Post). Image acquisition time varied slightly depending on cell width but averaged ~200 ms per frame. Both Pre and Post images were amplitude thresholded to separate the mitochondrial and cytosolic+nuclear TMRM signals. Cells were then analysed by cell region: paravascular, intra-fibrillar and irradiated. The irradiated region is the area in the centre of the cell exposed to UV light, and the boundary between the paravascular and intra-fibrillar regions is clearly distinguishable due to the regularity of the low cytosolic TMRM signal in the intra-fibrillar region where myofibrils are located. The mean TMRM signal was then measured for all mitochondrial pixels and all cytosolic+nuclear pixels in each cell region in both the Pre and Post images. From these values, a Post/Pre ratio was calculated for the mitochondria and cytosol+nuclei in each cell region. The ratio between the mitochondrial and cytosolic+nuclear TMRM intensities (mito/cyto ratio) was also calculated for each cell region in the Pre and Post images as this is a more valid measure of mitochondrial membrane potential than just the mitochondrial signal alone.
Live cell mitochondrial morphology.
Super-resolution microscopy was also performed on the live, isolated fibres loaded with TMRM using stimulated emission depletion (STED) methodology. Although the spatial resolution of confocal microscopy is theoretically sufficient to measure mitochondrial cross-sectional diameters (mean values >300 nm) in these cells, the highly dense nature of the PVM pool makes it difficult to resolve the spaces between mitochondria. Thus, the improved spatial resolution with STED provides better definition of individual PVM structures. Gated STED images were obtained using a commercial Leica SP8 STED 3X system (Leica Microsystems, Mannheim, Germany), equipped with a white light excitation laser. A 100×/1.4 NA oil immersion objective lens (HCX PL APO STED white, Leica Microsystems) was used for imaging. Using TMRM as the mitochondrial probe for STED allowed the measurement of mitochondrial structure under the same conditions used to assess mitochondrial membrane potential conduction. Further, TMRM is highly recommended by Leica for live cell STED as it is very bright and highly photostable, which is supported by the results of the UV irradiation experiments described above. Also, tetramethylrhodamine has been used previously to collect STED images in live cells35. Image stacks were collected as 8 bit, 1,024 × 1,024 images with 30 nm x and y pixel sizes, 6 line averages and 0.2 μm z-steps. Muscle cells were imaged with 550 nm excitation light, a 660 nm STED depletion laser at 20% power and an emission window from 564 nm to 640 nm. Tandem confocal images (no STED depletion, 3× lower excitation power) were also obtained with confocal and STED images collected sequentially, frame by frame, with the confocal image first.
Measurement of mitochondrial diameters was performed in ImageJ using the raw STED image stacks. A line was drawn across the maximal cross-sectional diameter and the length determined as the full width at half maximum (FWHM) of the linear fluorescent intensity profile. We analysed 175 mitochondria from 13 muscle fibres from 3 animals (see Extended Data Table 1). STED image stacks were deconvolved using Huygens software and the CMLE algorithm for presentation purposes only.
Fast Fourier transform (FFT) IBM analysis.
In the isolated muscle fibres, IBM were generally spaced every ~2 μm adjacent to the z-lines in the isolated cells. Since depolarization dissipates the TMRM signal from the mitochondria to the cytosol, we reasoned that an FFT of the TMRM signal along the long axis of the cell would selectively highlight, due to its periodicity, the IBM pool signal alterations. To accomplish this, a large ROI of the intra-fibrillar region was selected, eliminating the PVM pool. The FFT were conducted serially along the long axis of the cell summing the power spectrum of each FFT to provide the overall power spectrum of the ROI. The IBM represented a unique resonance in the 0.5 μm−1 region permitting the specific analysis of the IBM amplitude using this approach.
Statistical analyses.
Differences in mitochondrial diameter for the four mitochondrial pools were assessed using a one-way ANOVA with a Tukey’s HSD post hoc test and a P value of 0.05. Differences in the relative distribution of complex IV and complex V between the PVM and IFM pools were determined using paired t-tests and a P value of 0.05. Differences between isolated muscle fibres before and after UV exposure and for different cell regions were assessed by ANOVA with a Tukey’s HSD post hoc test and a P value of 0.05.
Extended Data
Extended Data Figure 1 |. Mitochondrial coupling assessment.
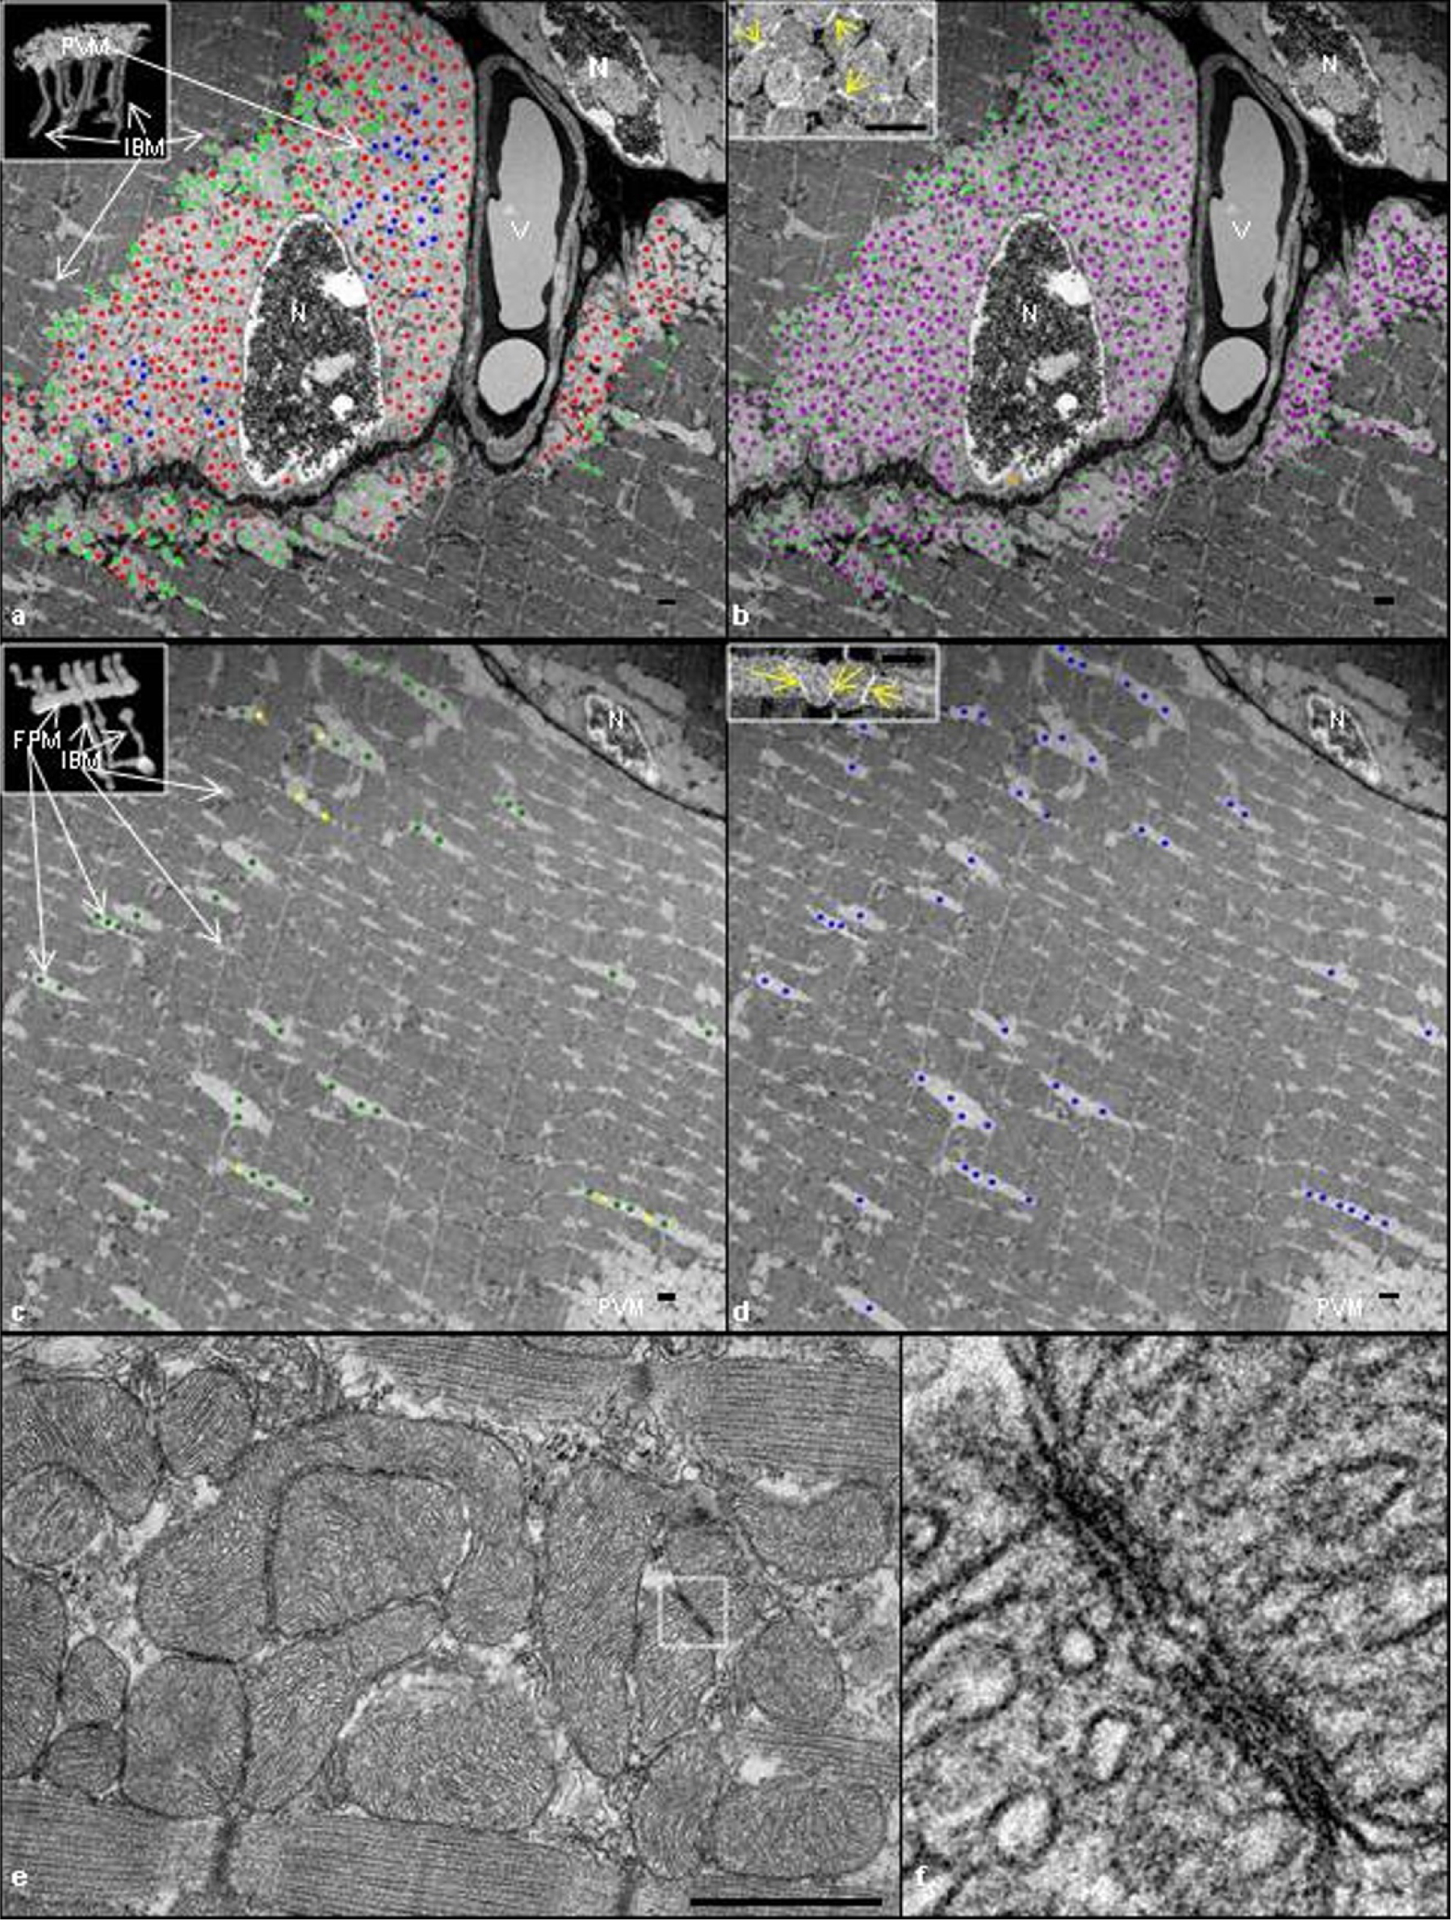
a, b, Single image from the middle of a FIB-SEM muscle volume including two nuclei (N) and a blood vessel (V). a, Direct coupling. PVM tagged green are those where a single mitochondrion projects from a PVM into an IBM with a continuous outer membrane (see inset) within the imaged volume. Red-tagged PVM did not project into IBM. Blue-tagged PVM continued out of the field of view and could not be classified. b, Electron-dense contact site (EDCS) coupling. Magenta-tagged mitochondria were connected by EDCS (see yellow arrows in inset). Additional green dots were added to PVM which project into IBM (see a). Greater than 99% of tracked PVM were coupled by EDCS. c, d, Single image from the middle of the intra-fibrillar region of a FIB-SEM volume. c, Direct coupling. FPM tagged green are those where a single mitochondrion projects from an FPM into an IBM with a continuous outer membrane (see inset). Yellow-tagged FPM did not project into IBM. d, EDCS coupling. FPM tagged blue were connected to an adjacent FPM through an EDCS (see yellow arrows in inset). Images are representative of 4 samples with significant paravascular and intra-fibrillar mitochondrial content from 4 animals. e, A longitudinal TEM mouse tibialis anterior muscle image showing the close association between adjacent mitochondria. f, Close up view of an EDCS highlighted in e showing the convergence of mitochondrial membranes between two adjacent mitochondria. Scale bars, 750 nm.
Extended Data Figure 2 |. Multi-photon microscopy (MPM) images of fresh muscle fibres in situ.
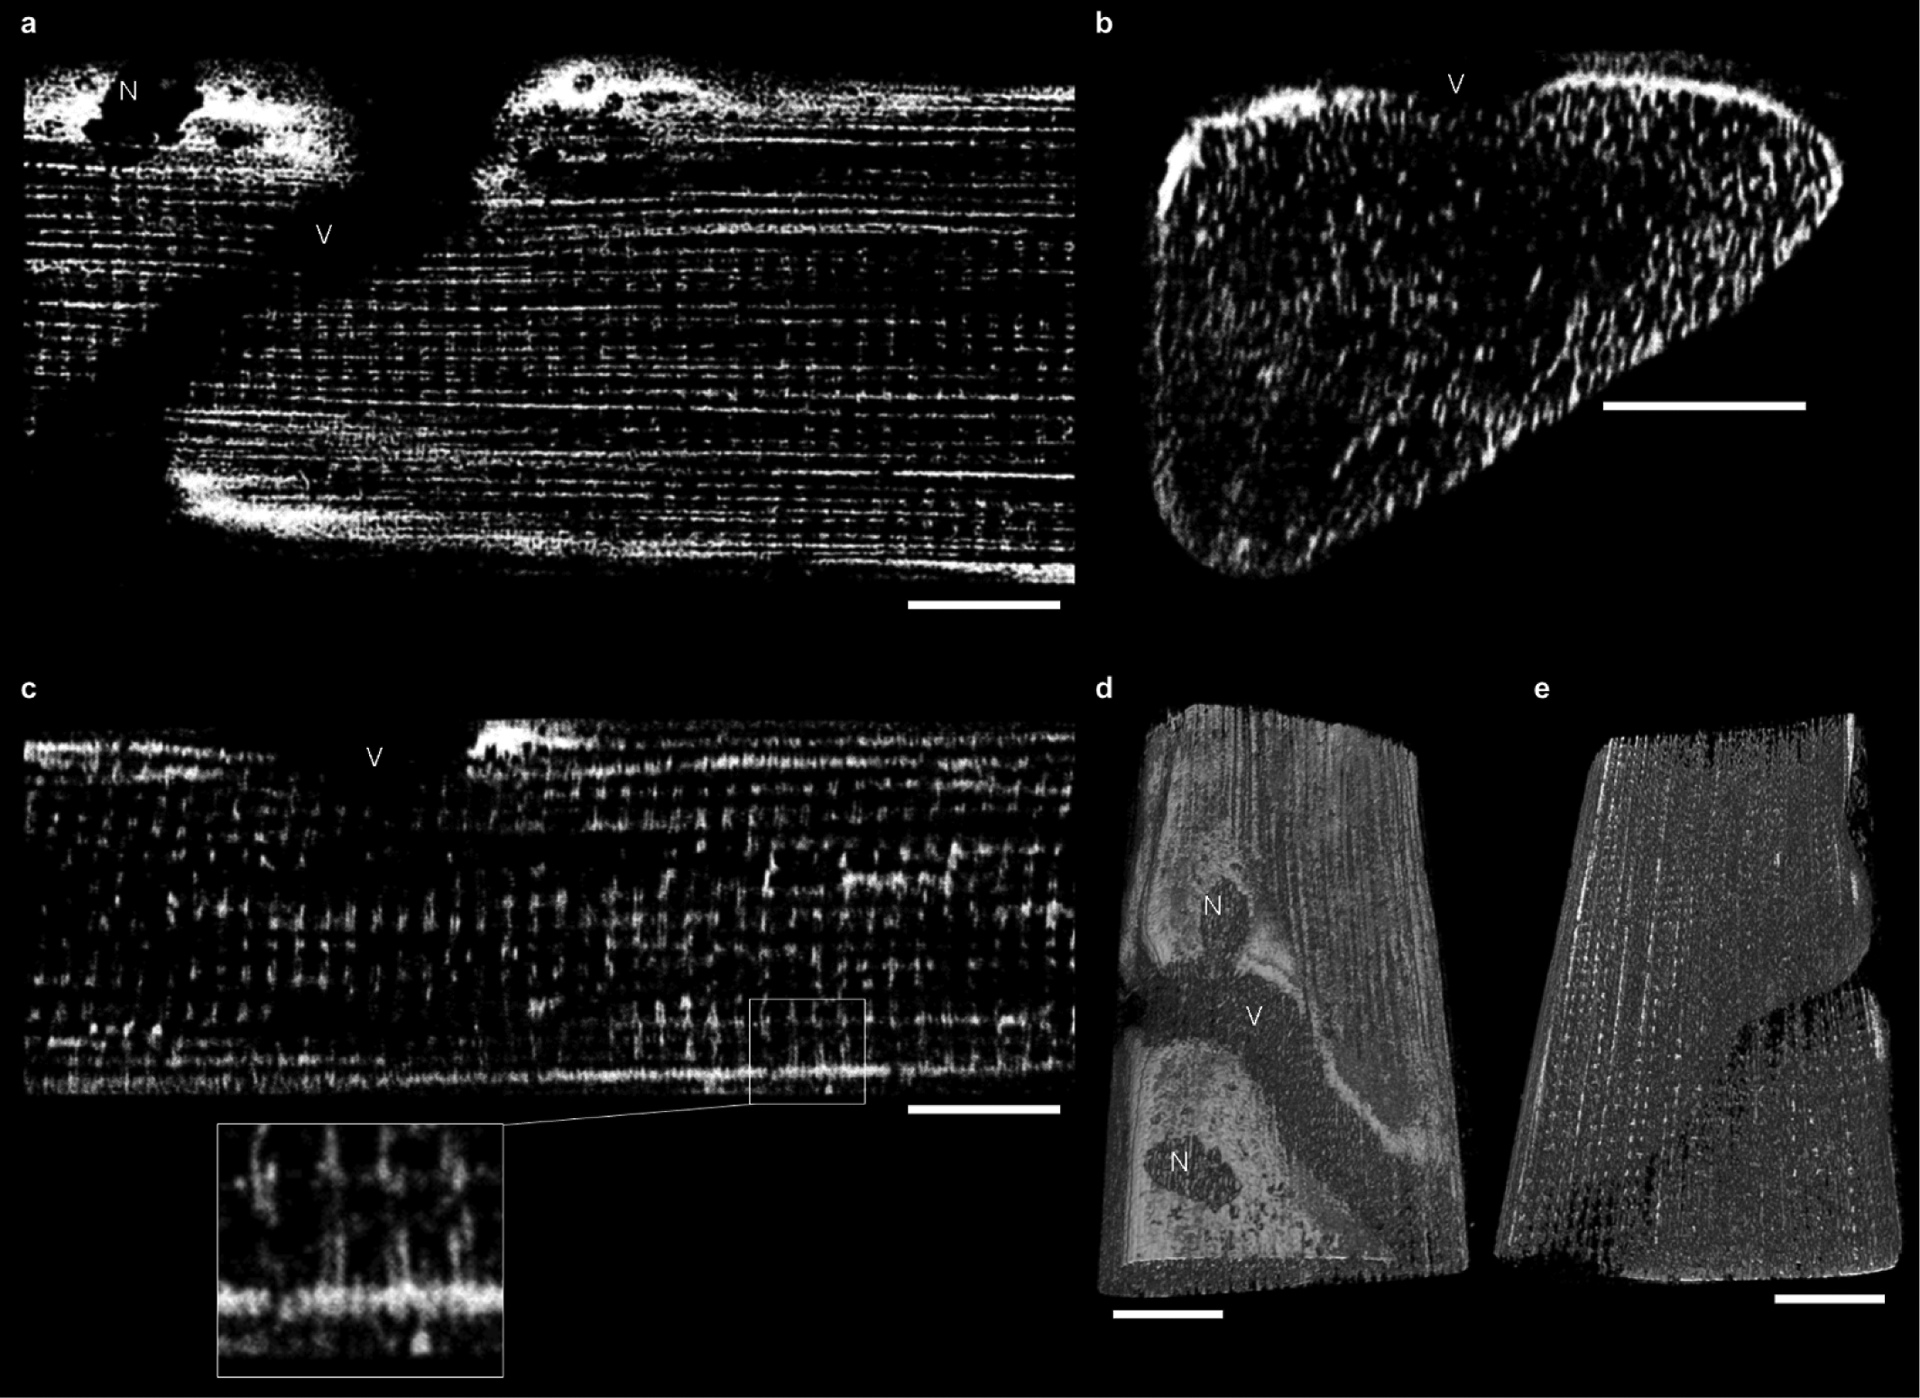
a, Endogenous mitochondrial NAD(P)H signal froma single XY image within a 3D volume of a muscle fibre. In this orientation, paravascular mitochondria (PVM) are apparent as clusters around the embedded capillary (V) and nuclei (N). Fibre parallel mitochondria (FPM) are seen as horizontal lines while I-band mitochondria (IBM) are seen as discrete spots. There are very few vertical lines in this image due to the infrequency of cross-fibre connection mitochondria (CFCM). The full volume can be seen in Supplementary Video 3. b, A YZ image from the same fibre volume asin a. PVM appear lateral to the embedded capillary (V), while IBM appear as vertical lines and FPM are seen as discrete spots. Note the lack of horizontal lines (CFCM) in this image or the accompanying video (Supplementary Video 4). c, An XZ image of the same muscle volume as in a and b. PVM are located on the cell periphery; IBM are seen as vertical lines; FPM are seen as horizontal lines; and CFCM as discrete spots. In the inset, pairs of IBM projecting out from PVM are highlighted. d, A 3D rendering of the endogenous mitochondrial NAD(P)H signal within the muscle fibre shown in a–c. 360° views of this 3D rendering are shown in Supplementary Video 5. e, A viewof the interior of the 3D rendering from d showing the regularity of the mitochondrial network within skeletal muscle. The field of view for the muscle volume in this image is 102.4 × 51.2 × 36.8 μm in x, y and z, respectively. Scale bars, 15 μm. Mean fibre volume from these MPM images was 159,431 ± 15,507 μm3. Images are representative of 4 fibres from 3 mice.
Extended Data Figure 3 |. Super resolution microscopy allows improved visualization of individual mitochondria.
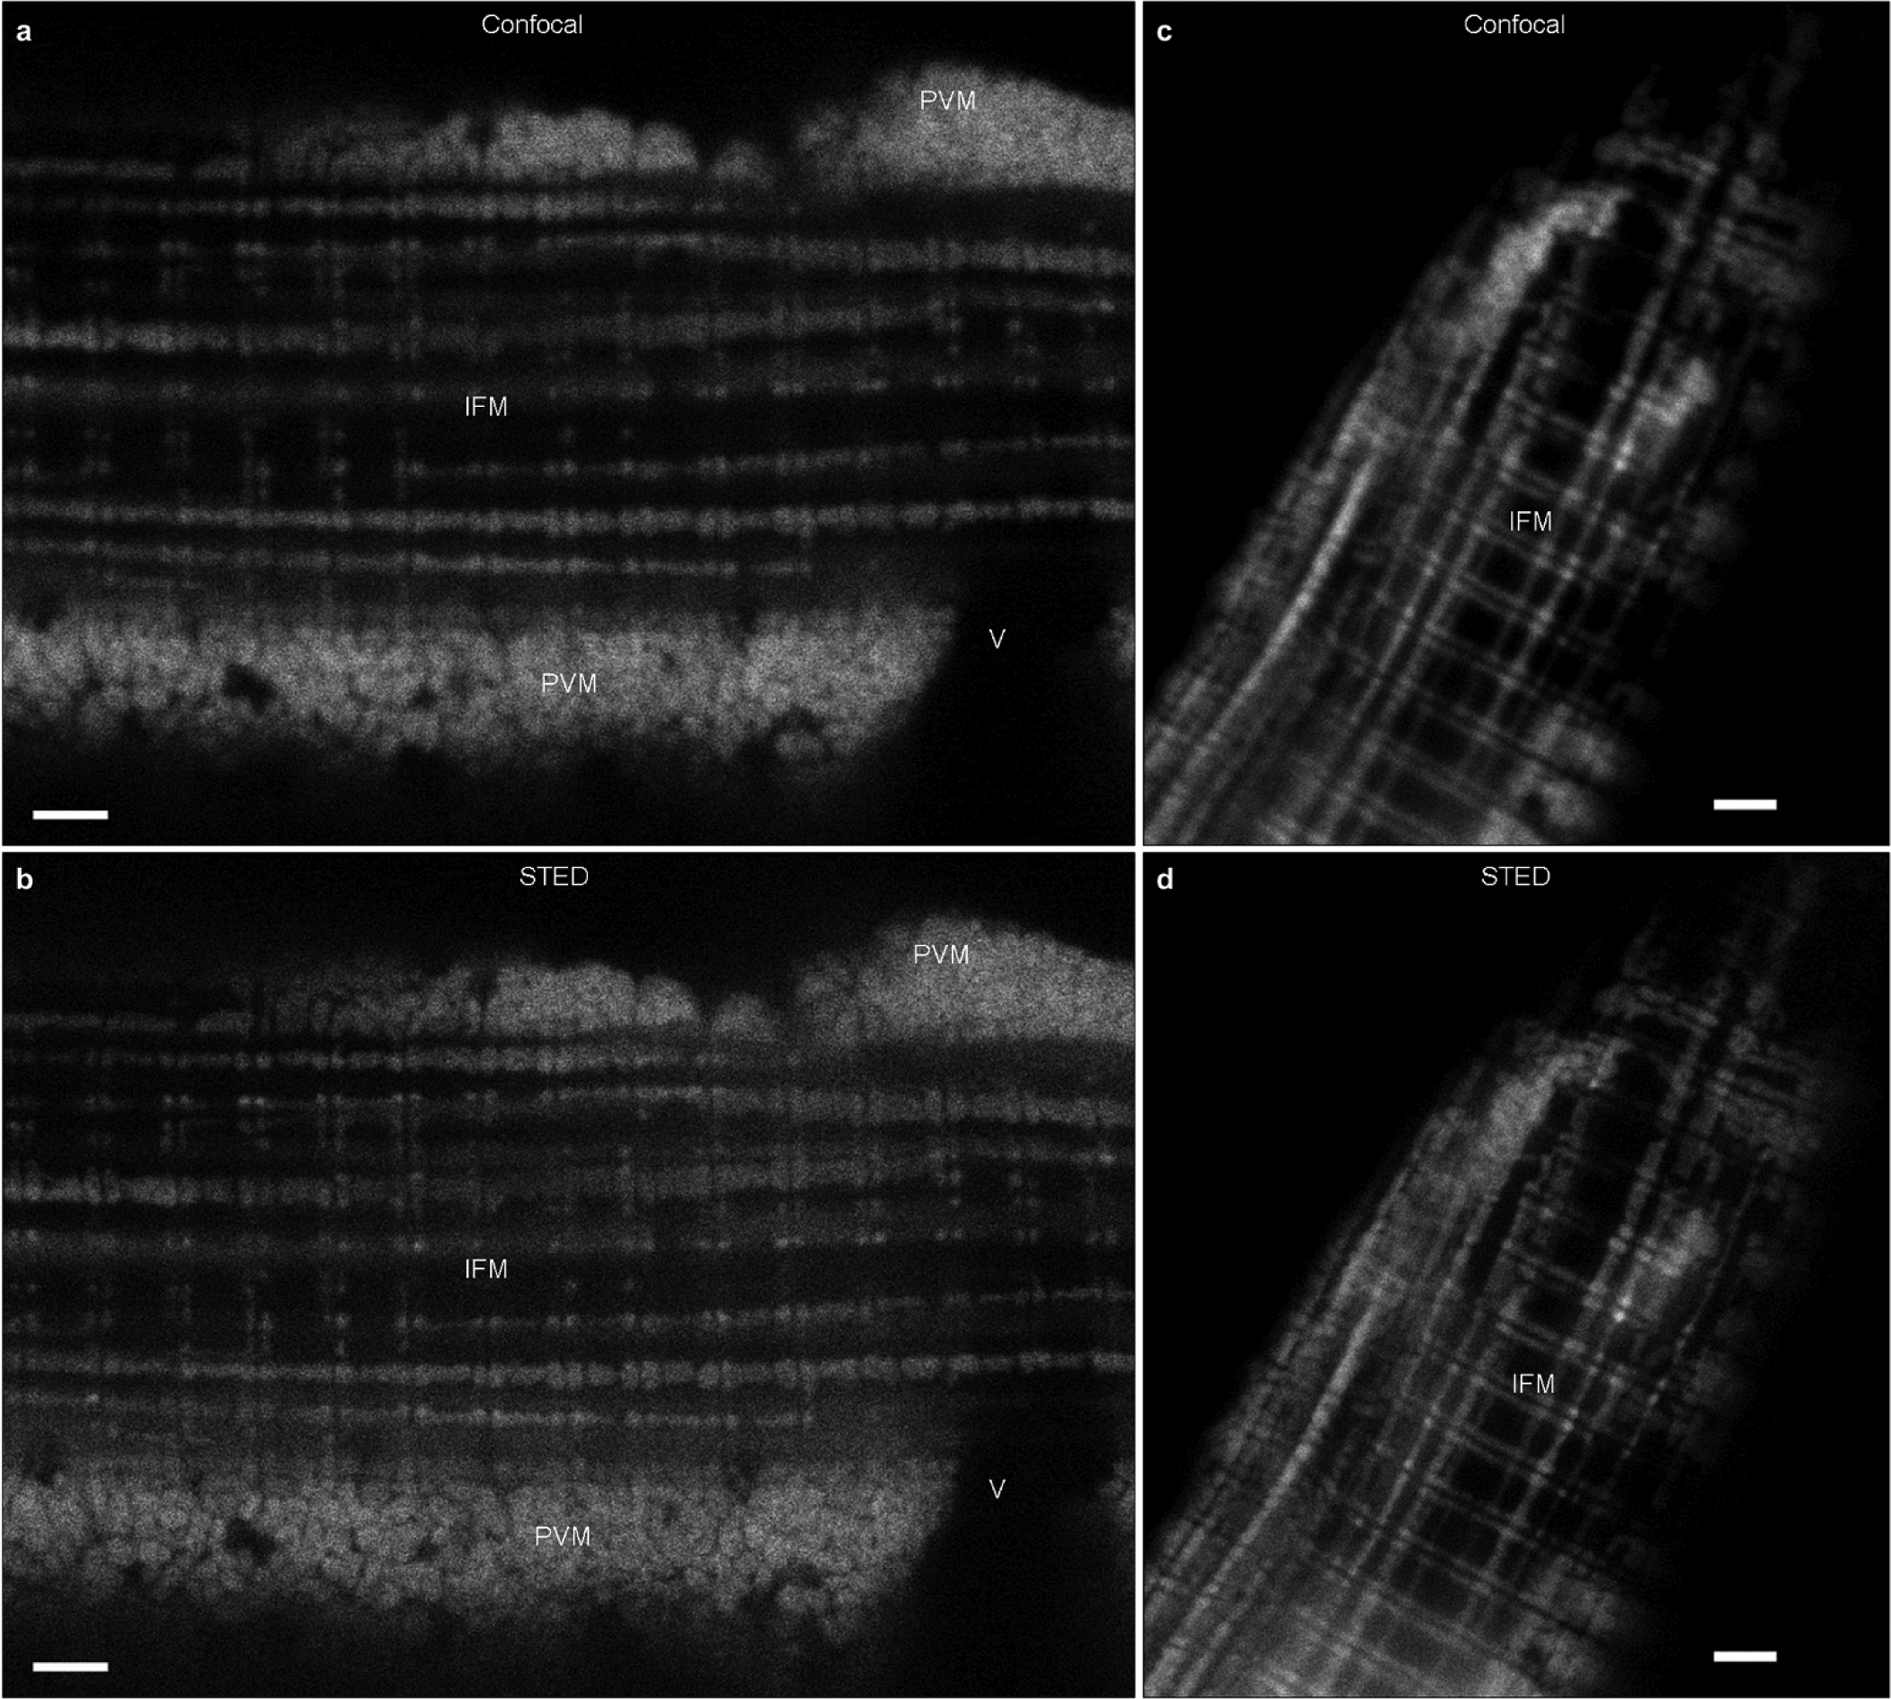
a, Single confocal microscopy image of an isolated muscle fibre loaded with mitochondrial membrane potential dye, TMRM. PVM, paravascular mitochondria; IFM, intra-fibrillar mitochondria; V, vessel. b, Single stimulated emission depletion (STED) microscopy image of the same fibre as in a. c, The average of a confocal microscopy image stack of a TMRM loaded isolated muscle fibre. d, The average of a STED microscopy image stack of the same fibre as in c. For c and d, image volume was 24.30 × 27.47 × 1.75 μm in x, y and z, and images shown are the average of 9 images taken with 219 nm z-steps. Confocal imageswere acquired before STED images at each image depth. All images were acquired with x and y pixel sizes of 30 nm. Scale bars, 2 μm. As most muscle mitochondria are larger than 300 nm, the improved resolution with STED is primarily noted by the increased clarity of the spaces between individual mitochondria, particularly the PVM. Images are representative of 13 fibres from 3 mice.
Extended Data Figure 4 |. Complex V expression is relatively higher than complex IV in the muscle fibre interior.
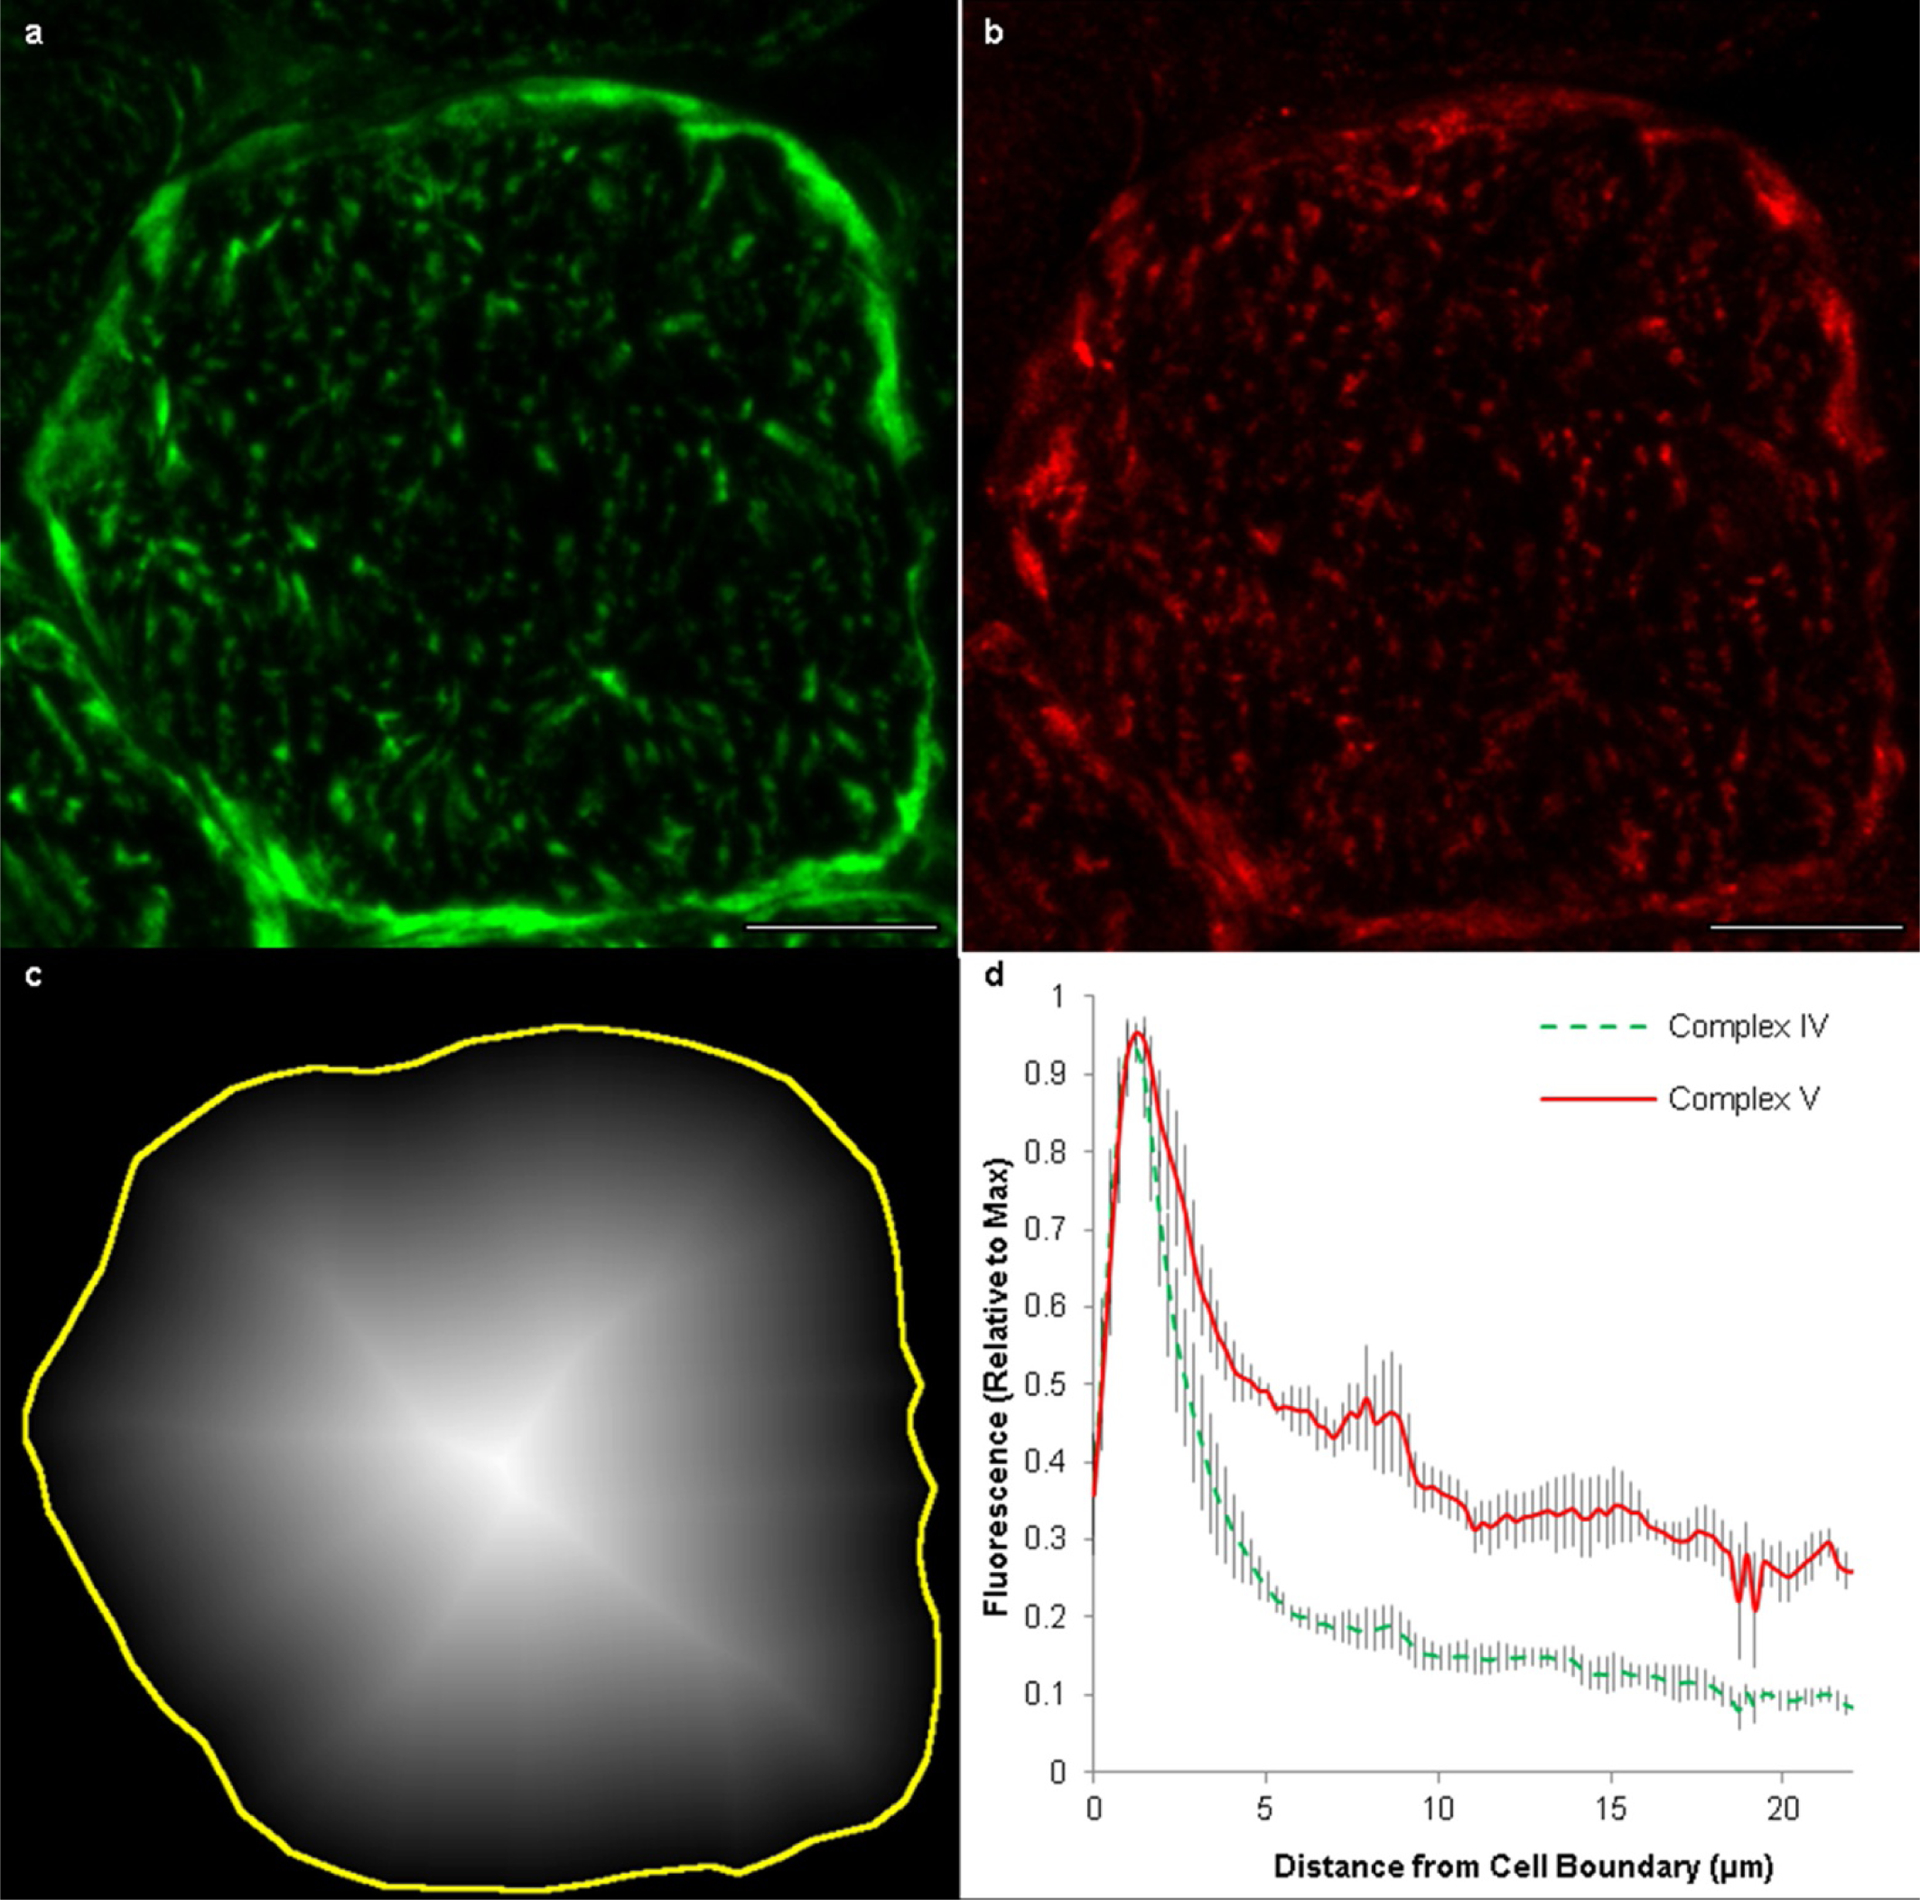
a, Representative confocal microscopy image of a cross-section of a muscle fibre immunostained for complex IV. b, The same muscle section depicted in a immunostained for complex V. Scale bars, 15 μm. All images analysis was performed on the raw images. Brightness and contrast have been increased for the images shown here to improve presentation. c, Distance map from the boundary of the cell (yellow line) towards the interior of the fibre where image intensity corresponds to distance from the cell boundary. The mean fluorescence signal for all pixels of a given distance from the cell boundary was assessed for both complex IV and complex V. Images representative of 4 fibres from 4 mice. d, Results from intensity profile analysis of 4 muscle fibres from 4 animals show relatively increased complex V in the fibre interior or, conversely, relatively higher complex IV near the fibre periphery. The red, solid line shows the mean intensity profile for complex V from the outside to the inside of the fibre. The green, dotted line shows the mean intensity profile for complex IV from the outside to the inside of the fibre. Values are normalized to the maximal intensity from each intensity profile to allow comparison of images of varying intensities. Grey shading around each line shows the standard error.
Extended Data Figure 5 |. Primary antibody specificity.
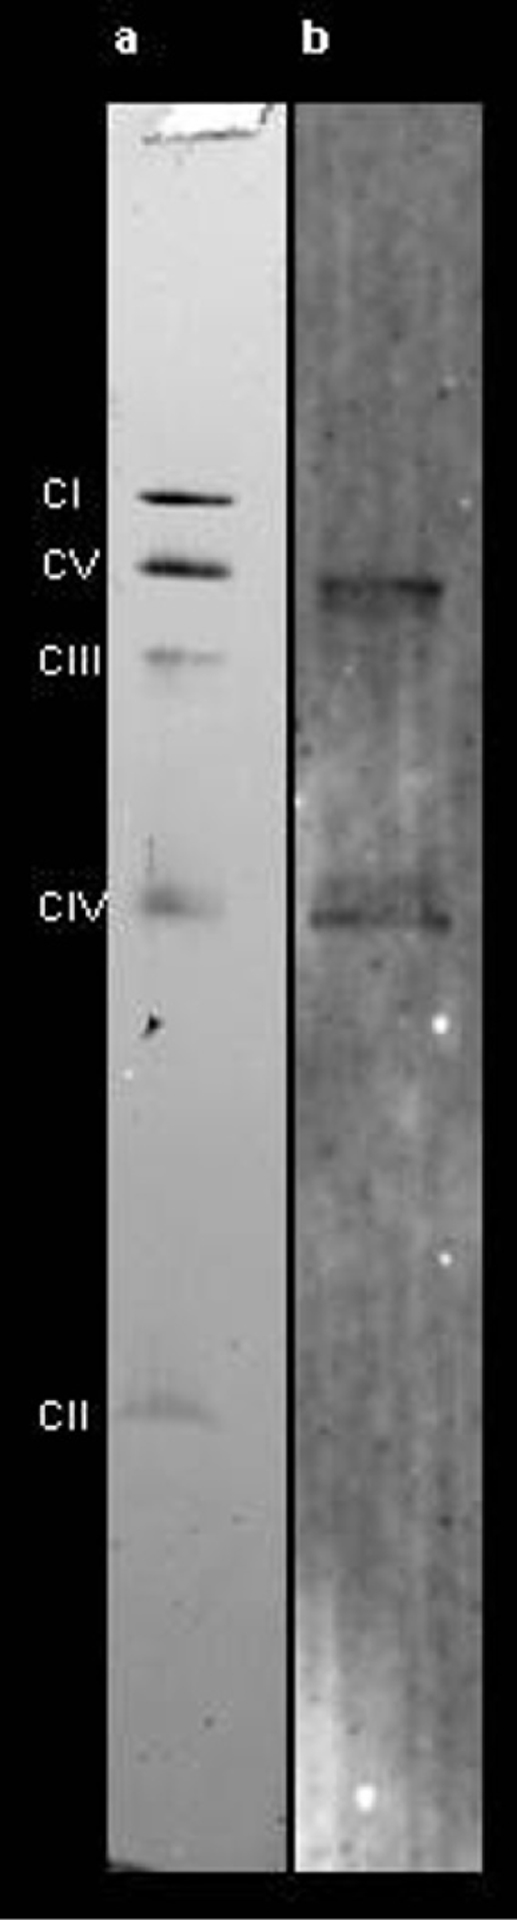
a, Coomassie-stained CN-PAGE gel after transferring isolated mouse skeletal muscle mitochondrial proteins to PVDF membrane for western blotting. Mitochondrial oxidative phosphorylation complexes I–V can be resolved as individual bands. b, Western blot dual immunostained for complex V, β-subunit (upper band), and complex IV, subunit I (lower band), with the same primary antibodies as used for the muscle section dual immunostaining as shown in Fig. 3 and Extended Data Fig. 4.
Extended Data Figure 6 |. Sarcolemmal capillary grooves remain even after removal of capillaries.
a, Longitudinal view of a 3D rendering of the outer 10 μm of an enzymatically isolated muscle fibre imaged as the mitochondrial TMRM signal by confocal microscopy. Blood vessels (V) and nuclei (N) are apparent as negative signals. b, c, Rotation of the volume in a around the longitudinal (b) and cross-sectional (c) axes reveals the grooves in the sarcolemma where capillaries were once present. Scale bars, 10 μm. Images representative of 11 fibres from 4 mice.
Extended Data Figure 7 |. Additional analyses of mitochondrial membrane potential conduction.
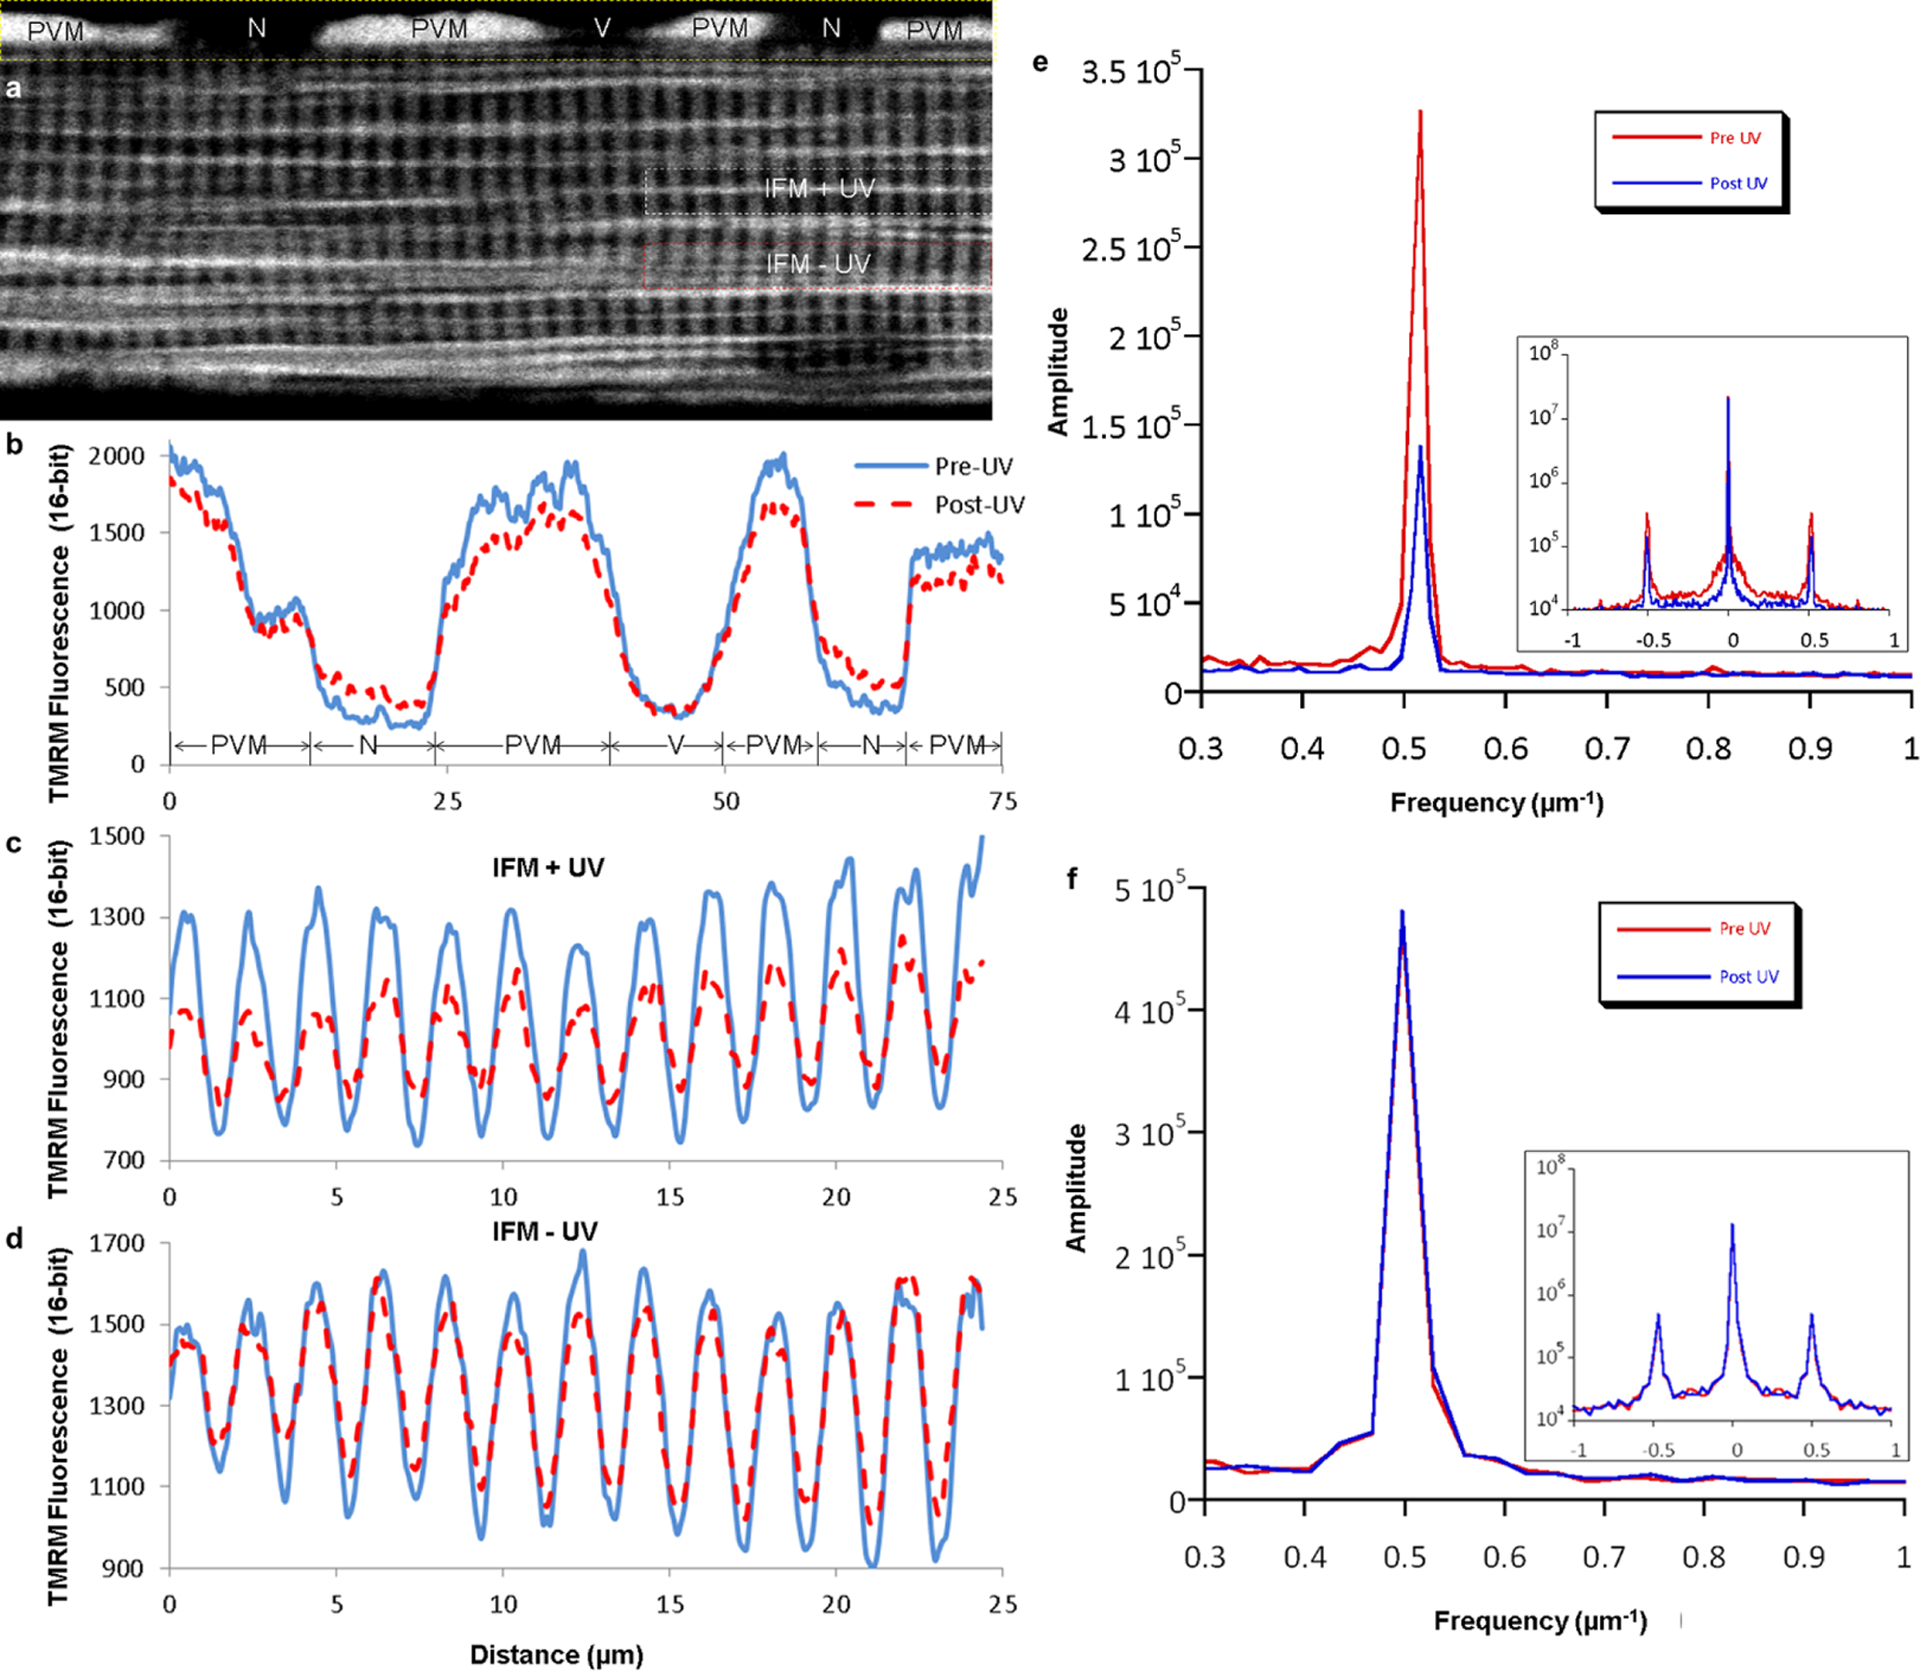
a, Confocal image of an isolated muscle fibre loaded with TMRM showing regions chosen for representative line profile analysis. Images are representative of 11 fibres from 4 mice. b, Line profile of TMRM fluorescence in the PVM+nuclear (N) region of the cell (marked by yellow dotted lines in a) before and after activation of MitoPhotoDNP shows a decrease in PVM signal, increase in N signal, and no change outside of the cell where a blood vessel (V) was located before enzymatic fibre isolation. c, Line profile of TMRM fluorescence in the region of the cell irradiated with UV light (irradiated, marked by white dotted lines in a) showing a decrease in mitochondrial signal (peaks) and an increase in cytosolic signal (troughs) after MitoPhotoDNP activation. d, Line profile of TMRM fluorescence in the non-irradiated IFM region of the cell (intra-fibrillar, marked by red dotted lines in a) showing a decrease in mitochondrial signal (peaks) and an increase in cytosolic signal (troughs) after MitoPhotoDNP activation. c and d take advantage of the regular pattern of IBM and cytosol in the intra-fibrillar space. However, any FPM in the regions selected for analysis may confound these results. A more robust analysis that selects only the IBM is shown in e and f. e, Representative fast Fourier transform (FFT) power spectrum of IFM TMRM signal reveals a 61 ± 3% decrease (n = 9 experiments) in the amplitude of IBM component (0.5 μm−1 frequency) after MitoPhotoDNP activation. Inset: log scale full FFT power spectrum. f, Representative FFT analyses of IFM mitochondria reveals no change (pre/post = 1.0 ± 0.03, n = 5 experiments) in the TMRM amplitude of IBM (0.5 μm−1 frequency) after UV exposure when MitoPhotoDNP is not present. Inset: log scale full FFT power spectrum.
Extended Data Figure 8 |. Effect of UV exposure on membrane potential without MitoPhotoDNP.
a, Representative heat map image of an isolated mouse soleus muscle fibre loaded with 5 nM TMRM. N, nucleus; V, vessel. b, c, Image from a thresholded to include only the TMRM signal in the mitochondria (b) or cytosol+nuclei (c). d–f, Whole cell (d), mitochondrial (e) and cytosolic+nuclear (f) TMRM signals immediately after UV exposure in the centre region of the cell (outlined by the white dotted lines). g–i, Post/pre ratiometric whole-cell (g), mitochondrial (h), and cytosolic+nuclear (i) TMRM images showing little change outside of the UV-exposed area. j, Greyscale image of a highlighting the different cell regions used for quantitative analysis. All pixels were analysed. k, TMRM signal decreased in both the mitochondria and cytosol in the UV-exposed region indicative of slight photobleaching. Images are representative of 10 fibres from 3 mice. Data represent the mean ± s.e. from 10 experiments from 3 animals. Asterisk indicates significantly different (ANOVA, P < 0.05) from a post/pre ratio of 1.0. Plus symbol indicates significantly different (P < 0.05) from IFM+UV region. See Supplementary Video 10 for time course video.
Extended Data Figure 9 |. UV light was restricted to the drawn ROI.
Difference XY image of a uniformly blue fluorescent slide before and after exposure to UV light in the drawn ROI (white outline). Inset: YZ view shows that the UV light was largely maintained to the ROI drawn (black line). Scale bars, 5 μm. Images are representative of 3 experiments.
Extended Data Table 1 |.
Skeletal muscle mitochondrial cross-sectional diameters
| Fixed Muscle FIB/SEM | Live Cell STED | |||||||
|---|---|---|---|---|---|---|---|---|
| PVM | IBM | FPM | CFCM | PVM | IBM | FPM | CFCM | |
| Mean diameter (nm) | 921 | 318* | 598*^ | 333*# | 894 | 322* | 572*^ | 328*# |
| SE (nm) | 27 | 7 | 20 | 10 | 39 | 12 | 27 | 12 |
| Range (nm) | 436–2207 | 127–679 | 315–1495 | 134–565 | 581–1425 | 178–520 | 260–1011 | 167–524 |
| n mitochondria | 105 | 167 | 81 | 79 | 27 | 52 | 48 | 48 |
| n fibers | 8 | 8 | 8 | 8 | 8 | 13 | 12 | 12 |
| n animals | 4 | 4 | 4 | 4 | 3 | 3 | 3 | 3 |
FIB-SEM, focused ion beam scanning electron microscopy; STED, stimulated emission depletion microscopy; PVM, paravascular mitochondria; IBM, I-band mitochondria; FPM, fibre parallel mitochondria; CFCM, cross fibre connection mitochondria. Statistical test was analysis of variance (P < 0.05). There were no significant differences between FIB-SEM and STED. Diameters were measured at the maximum cross-section of the short axis of the mitochondria which were roughly ellipsoidal or cylindrical in shape. STED diameters were determined by the full-width half-maximum (FWHM) of the linear fluorescence intensity profile, and FIB-SEM diameters were determined as the distance of a line drawn across a mitochondrion.
Denotes significantly different from PVM.
Denotes significantly different from IBM.
Denotes significantly different from FPM.
Supplementary Material
Acknowledgements
We would like to thank E. Tyler for his assistance with image rendering, J. Taraska for providing experimental advice, T. Karpova and the NCI Core Fluorescence Imaging Facility for access to a microscope with a 355-nm laser, and P. Kellman for assistance with image analysis. We would also like to thank S. Caldwell and R. Hartley for providing us with MitoPhotoDNP. This study was supported by intramural funding of the Division of Intramural Research, National Heart, Lung, and Blood Institute and the Center for Cancer Research, National Cancer Institute.
Footnotes
Supplementary Information is available in the online version of the paper.
The authors declare no competing financial interests.
Readers are welcome to comment on the online version of the paper.
Online Content Methods, along with any additional Extended Data display items and Source Data, are available in the online version of the paper; references unique to these sections appear only in the online paper.
References
- 1.Bessman SP & Geiger PJ Transport of energy in muscle: The phosphorylcreatine shuttle. Science 211, 448–452 (1981). [DOI] [PubMed] [Google Scholar]
- 2.Wittenberg JB Myoglobin-facilitated oxygen diffusion: Role of myoglobin in oxygen entry into muscle. Physiol. Rev 50, 559–632 (1970). [DOI] [PubMed] [Google Scholar]
- 3.Garry DJ et al. Mice without myoglobin. Nature 395, 905–908 (1998). [DOI] [PubMed] [Google Scholar]
- 4.van Deursen J et al. Skeletal muscles of mice deficient in muscle creatine kinase lack burst activity. Cell 74, 621–631 (1993). [DOI] [PubMed] [Google Scholar]
- 5.Lygate CA et al. Living without creatine: unchanged exercise capacity and response to chronic myocardial infarction in creatine-deficient mice. Circ. Res 112, 945–955 (2013). [DOI] [PMC free article] [PubMed] [Google Scholar]
- 6.Kernec F, Unlu M, Labeikovsky W, Minden JS & Koretsky AP Changes in the mitochondrial proteome from mouse hearts deficient in creatine kinase. Physiol. Genomics 6, 117–128 (2001). [DOI] [PubMed] [Google Scholar]
- 7.Glancy B et al. In vivo microscopy reveals extensive embedding of capillaries within the sarcolemma of skeletal muscle fibers. Microcirculation 21, 131–147 (2014). [DOI] [PMC free article] [PubMed] [Google Scholar]
- 8.Narayan K et al. Multi-resolution correlative focused ion beam scanning electron microscopy: Applications to cell biology. J. Struct. Biol 185, 278–284 (2014). [DOI] [PMC free article] [PubMed] [Google Scholar]
- 9.Dahl R et al. Three dimensional reconstruction of the human skeletal muscle mitochondrial network as a tool to assess mitochondrial content and structural organization. Acta Physiol. 213, 145–155 (2015). [DOI] [PubMed] [Google Scholar]
- 10.Bakeeva LE, Chentsov YS & Skulachev VP Ontogenesis of mitochondrial reticulum in rat diaphragm muscle. Eur. J. Cell Biol 25, 175–181 (1981). [PubMed] [Google Scholar]
- 11.Bakeeva LE, Chentsov Yu S & Skulachev VP Mitochondrial framework (reticulum mitochondriale) in rat diaphragm muscle. Biochim. Biophys. Acta 501, 349–369 (1978). [DOI] [PubMed] [Google Scholar]
- 12.Kayar SR, Hoppeler H, Mermod L & Weibel ER Mitochondrial size and shape in equine skeletal muscle: a three-dimensional reconstruction study. Anat. Rec 222, 333–339 (1988). [DOI] [PubMed] [Google Scholar]
- 13.Kirkwood SP, Munn EA & Brooks GA Mitochondrial reticulum in limb skeletal muscle. Am. J. Physiol 251, C395–C402 (1986). [DOI] [PubMed] [Google Scholar]
- 14.Kirkwood SP, Packer L & Brooks GA Effects of endurance training on a mitochondrial reticulum in limb skeletal muscle. Arch. Biochem. Biophys 255, 80–88 (1987). [DOI] [PubMed] [Google Scholar]
- 15.Ogata T & Yamasaki Y Scanning electron-microscopic studies on the three-dimensional structure of mitochondria in the mammalian red, white and intermediate muscle fibers. Cell Tissue Res. 241, 251–256 (1985). [DOI] [PubMed] [Google Scholar]
- 16.Denk W & Horstmann H Serial block-face scanning electron microscopy to reconstruct three-dimensional tissue nanostructure. PLoS Biol. 2, e329 (2004). [DOI] [PMC free article] [PubMed] [Google Scholar]
- 17.Bakalar M et al. Three-dimensional motion tracking for high-resolution optical microscopy, in vivo. J. Microsc 246, 237–247 (2012). [DOI] [PMC free article] [PubMed] [Google Scholar]
- 18.Rothstein EC, Carroll S, Combs CA, Jobsis PD & Balaban RS Skeletal muscle NAD(P)H two-photon fluorescence microscopy in vivo: topology and optical inner filters. Biophys. J 88, 2165–2176 (2005). [DOI] [PMC free article] [PubMed] [Google Scholar]
- 19.Bubenzer HJ Die Dunnen Und Die Dicken Muskelfasern Des Zwerchfells Der Ratte. Z. Zellforsch. Mikrosk. Anat 69, 520–550 (1966). [PubMed] [Google Scholar]
- 20.Skulachev VP Energy transformation in the respiratory chain. Curr. Top. Bioenerg 4, 127–190 (1971). [Google Scholar]
- 21.Amchenkova AA, Bakeeva LE, Chentsov YS, Skulachev VP & Zorov DB Coupling membranes as energy-transmitting cables. I. Filamentous mitochondria in fibroblasts and mitochondrial clusters in cardiomyocytes. J. Cell Biol 107, 481–495 (1988). [DOI] [PMC free article] [PubMed] [Google Scholar]
- 22.Picard M et al. Acute exercise remodels mitochondrial membrane interactions in mouse skeletal muscle. J. Appl. Physiol 115, 1562–1571 (2013). [DOI] [PMC free article] [PubMed] [Google Scholar]
- 23.Saito A, Smigel M & Fleischer S Membrane junctions in the intermembrane space of mitochondria from mammalian tissues. J. Cell Biol 60, 653–663 (1974). [DOI] [PMC free article] [PubMed] [Google Scholar]
- 24.Eisner V, Lenaers G & Hajnoczky G Mitochondrial fusion is frequent in skeletal muscle and supports excitation-contraction coupling. J. Cell Biol 205, 179–195 (2014). [DOI] [PMC free article] [PubMed] [Google Scholar]
- 25.Chalmers S et al. Selective uncoupling of individual mitochondria within a cell using a mitochondria-targeted photoactivated protonophore. J. Am. Chem. Soc 134, 758–761 (2012). [DOI] [PMC free article] [PubMed] [Google Scholar]
- 26.Fan X, Hussien R & Brooks GA H2O2-induced mitochondrial fragmentation in C2C12 myocytes. Free Radic. Biol. Med 49, 1646–1654 (2010). [DOI] [PMC free article] [PubMed] [Google Scholar]
- 27.Weibel ER & Hoppeler H Exercise-induced maximal metabolic rate scales with muscle aerobic capacity. J. Exp. Biol 208, 1635–1644 (2005). [DOI] [PubMed] [Google Scholar]
- 28.Bakalar M et al. Three-dimensional motion tracking for high-resolution optical microscopy, in vivo. J. Microsc 246, 237–247 (2012). [DOI] [PMC free article] [PubMed] [Google Scholar]
- 29.Narayan K et al. Multi-resolution correlative focused ion beam scanning electron microscopy: applications to cell biology. J. Struct. Biol 185, 278–284 (2014). [DOI] [PMC free article] [PubMed] [Google Scholar]
- 30.Murphy GE et al. Correlative 3D imaging of whole mammalian cells with light and electron microscopy. J. Struct. Biol 176, 268–278 (2011). [DOI] [PMC free article] [PubMed] [Google Scholar]
- 31.Kremer JR, Mastronarde DN & McIntosh JR Computer visualization of three-dimensional image data using IMOD. J. Struct. Biol 116, 71–76 (1996). [DOI] [PubMed] [Google Scholar]
- 32.Glancy B & Balaban RS Protein composition and function of red and white skeletal muscle mitochondria. Am. J. Physiol. Cell Physiol 300, C1280–C1290 (2011). [DOI] [PMC free article] [PubMed] [Google Scholar]
- 33.Balaban RS, Mootha VK & Arai A Spectroscopic determination of cytochrome c oxidase content in tissues containing myoglobin or hemoglobin. Anal. Biochem 237, 274–278 (1996). [DOI] [PubMed] [Google Scholar]
- 34.Wittig I, Karas M & Schagger H High resolution clear native electrophoresis for in-gel functional assays and fluorescence studies of membrane protein complexes. Mol. Cell. Proteomics 6, 1215–1225 (2007). [DOI] [PubMed] [Google Scholar]
- 35.Hein B et al. Stimulated emission depletion nanoscopy of living cells using SNAP-Tag fusion proteins. Biophys. J 98, 158–163 (2010). [DOI] [PMC free article] [PubMed] [Google Scholar]
Associated Data
This section collects any data citations, data availability statements, or supplementary materials included in this article.