
Figure 2 |. Muscle mitochondrial morphologies.
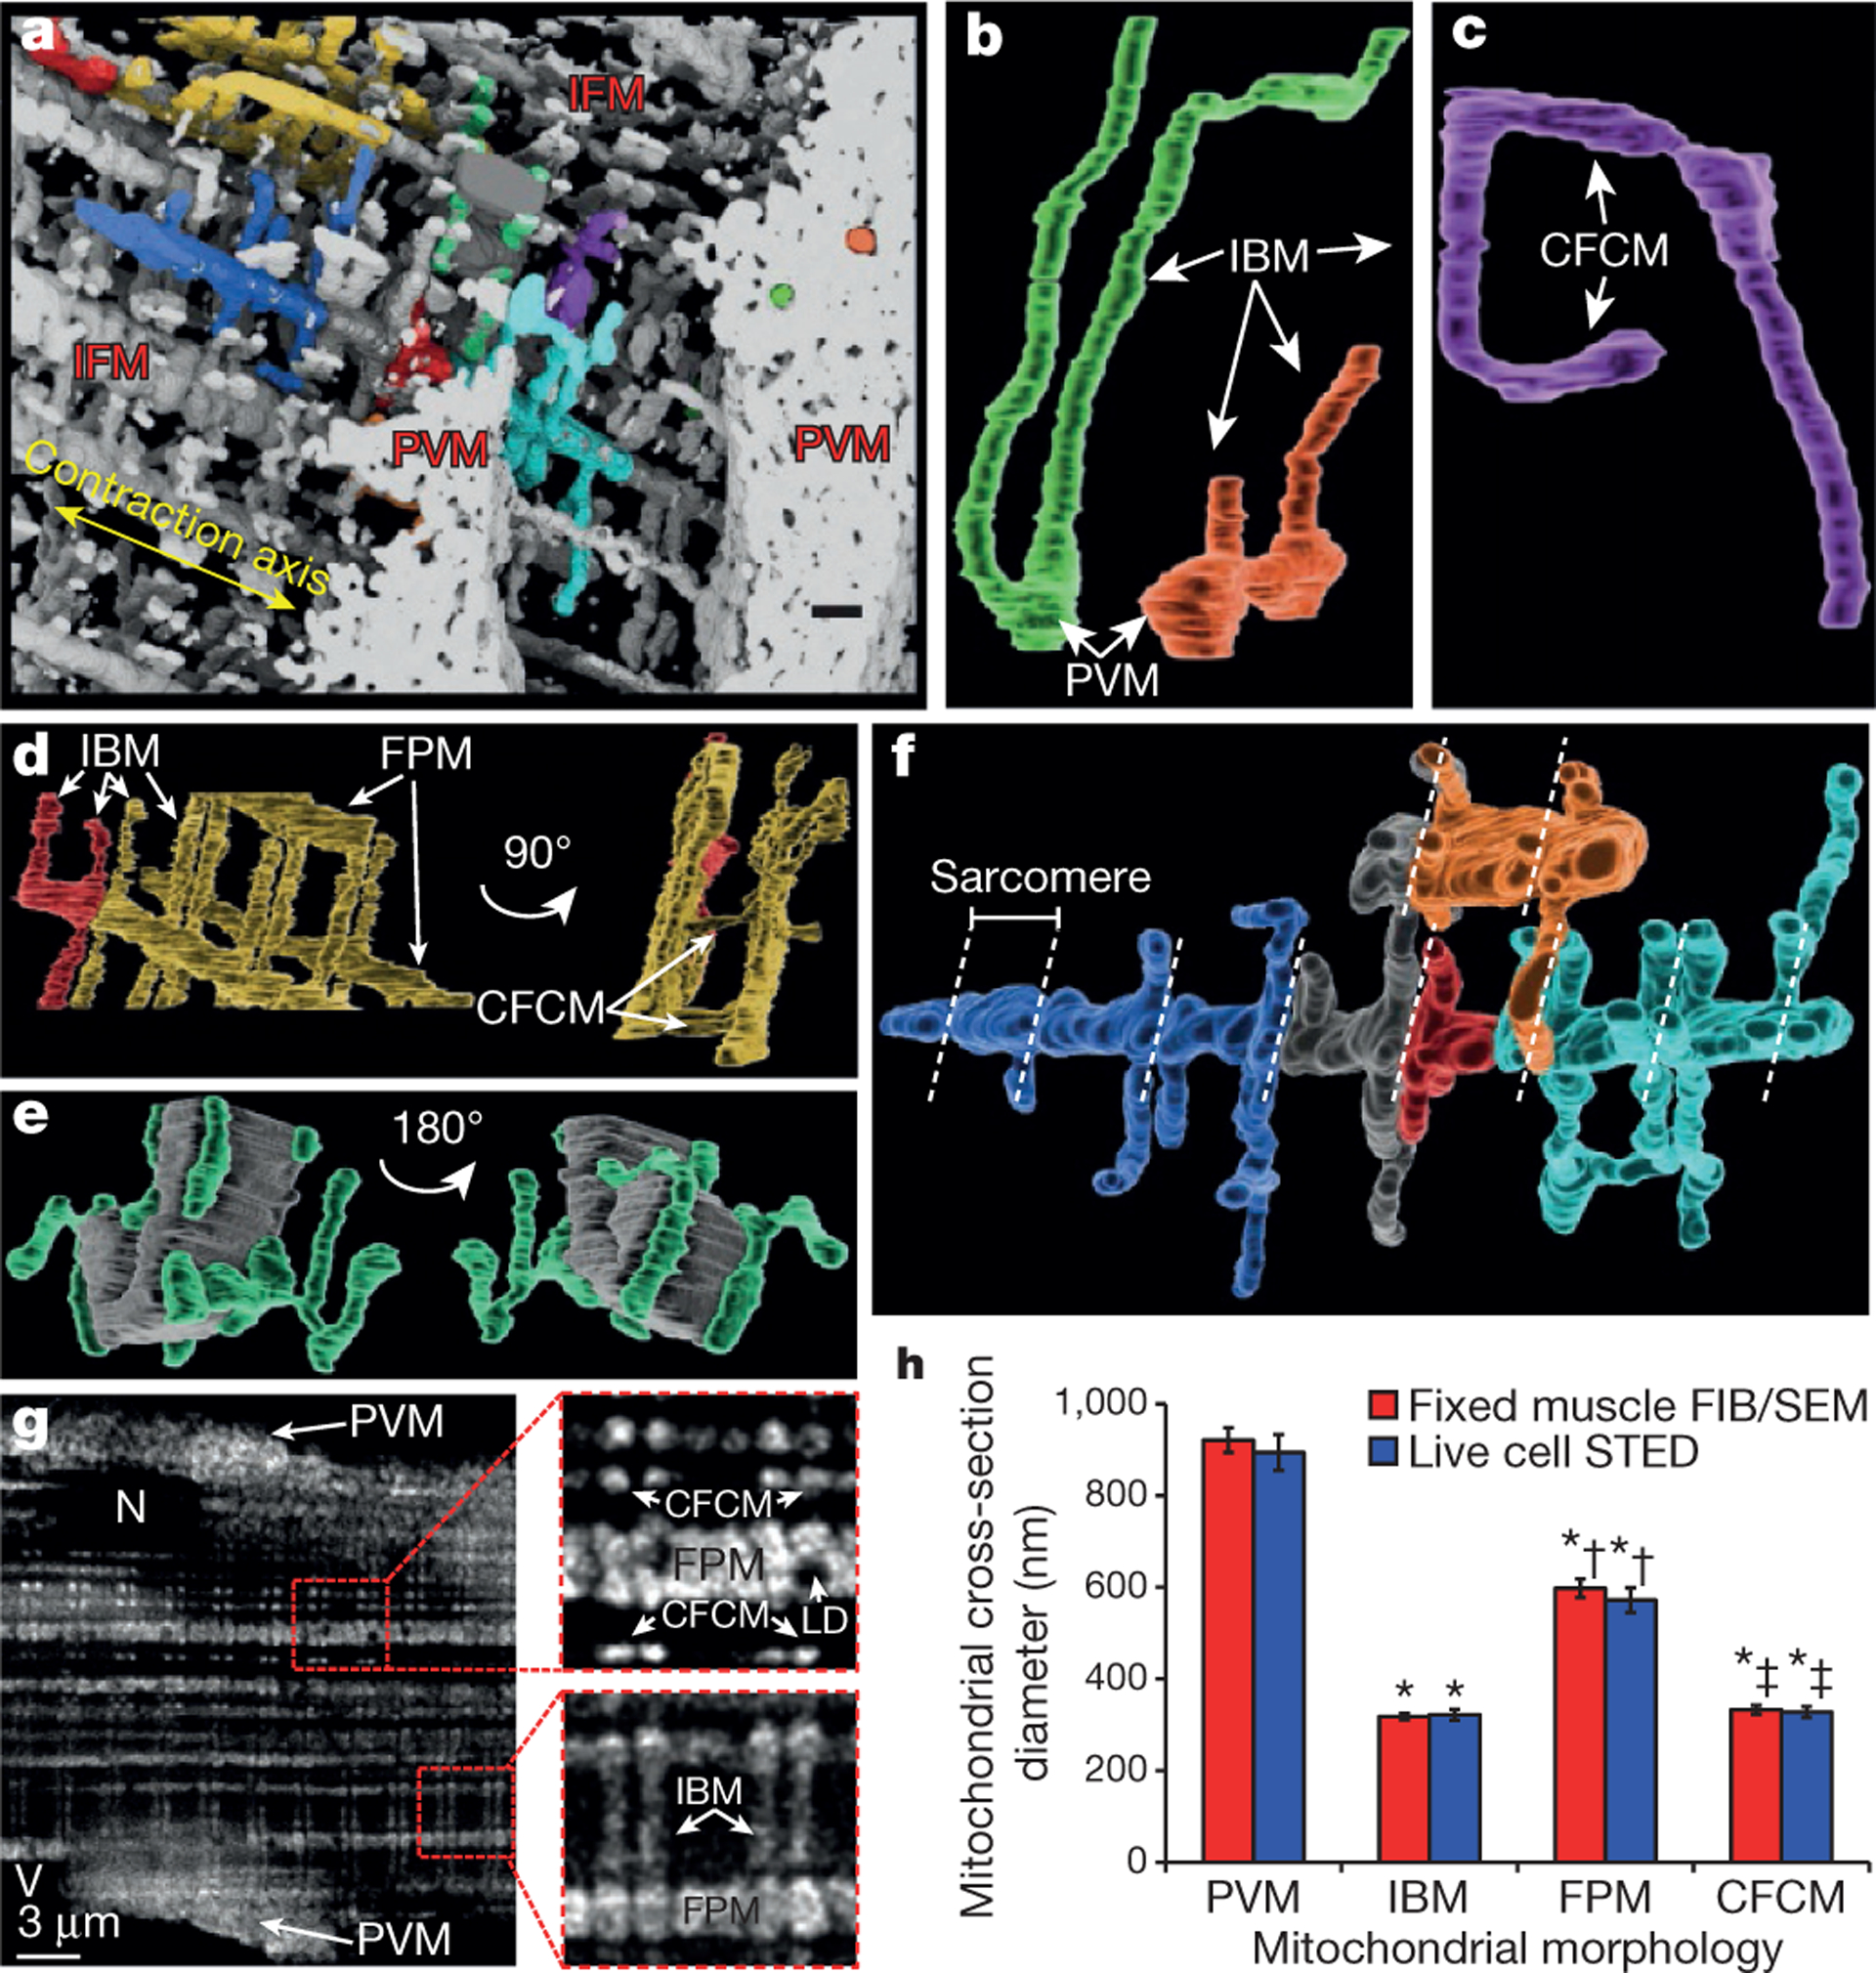
a, 3D rendering of mitochondria from FIB-SEM volume. Non-white colours indicate individual mitochondria. Scale bar, 750 nm. b, PVM projecting into IBM. c, Mitochondrion showing IBM and CFCM. d, Repeating connections between IBM and FPM. e, Myofibril (grey) and associated mitochondria (green). f, FPM with IBM and CFCM branches. Dotted lines indicate z-lines. g, Deconvolved super-resolution image of TMRM-loaded myocyte. LD, lipid droplet. Insets are magnified 3× from original. h, Mean mitochondrial diameters. Error bars indicate standard error. Quantification from raw images. Significantly different from PVM (*), IBM (†), FPM (‡) (ANOVA, P < 0.05). Images represent data from: FIB-SEM, 8 fibres, 4 mice; STED, 13 fibres, 3 mice.