Abstract
The assertion that efficacy of “targeted therapies” (TAR) cannot be assessed by traditional response measures has become conventional wisdom often guiding trial design and interpretation. Because stable disease (SD) has been increasingly reported as a measure of activity even for “cytotoxic therapies” (CTX), we sought to compare the occurrence of SD in phase II trials of cytotoxic CTX and TAR. We catalogued response assessments in 143 phase II studies reported in 5 journals between October 2006 and March 2008. Eighty-five studies incorporated CTX and 58 administered TAR. Both groups had comparable distribution of histologies and similar progression free survival (PFS) (median 4.8/2.35 months) and OS (median 10.9/9.15 months). SD was defined in only 28.6% of studies (median 10 weeks). SD rates were nearly identical—mean/median 35.05/34.7% for CTX, and 32.3/31.05% for TAR—with similar distributions across histologies, suggesting SD may not reflect drug activity. There were no positive correlations between %SD and PFS or OS. The overall response rate (complete response + partial response) was higher with CTX therapies (mean/median, 28/25% versus 13.1/5.3%) and in both groups overall response rate demonstrated a strong correlation (P < 0.0001) with PFS and OS. As currently defined and measured SD is not a property of TAR but is as frequently found with CTX therapies and may not reflect antitumor activity. Responses are observed with “both classes” of therapy and should be sought as a measure of activity. Studies that use SD as an end point require an adequate control to distinguish antitumor activity from normal variability in time to progression.
Keywords: stable disease, targeted therapies, cytotoxic therapies, cancer therapy, clinical trials, drug evaluation, drug assessment, phase II studies, RECIST, WHO criteria, complete response rate, partial response rate, overall response rate, progression free survival, time to progression, overall survival
As the number of “targeted therapies” (TAR) in preclinical development increased, the expectation that they would soon enter clinical trials led to several publications focusing on the design of clinical trials for TAR.1-3 Noting that, “preclinical data suggests that some new anticancer agents directed at novel targets demonstrate tumor growth inhibition but not tumor shrinkage,” numerous authors concluded that “such cytostatic agents may offer clinical benefits for patients in the absence of tumor shrinkage.”2 Early results seemed to support this concept. Sorafenib in renal cell cancer produced increases in progression-free survival despite a low-response rate; whereas in gastrointestinal stromal tumors, tumor size often did not initially change with therapy although metabolic studies demonstrated marked reduction in “activity.” These studies led to a more general sense that classic response measures were inadequate. As other TAR began clinical trials, often with disappointing results, many asserted their efficacy could not be assessed by traditional response measures. This idea has become conventional wisdom, influencing clinical trial design and interpretation. Because stable disease (SD) as a “measure of activity” was being increasingly reported with traditional cytotoxic (CTX) agents, we set about to methodically compare the occurrence of SD in phase II trials of novel TAR and CTX agents.
As noted more than a decade ago, “an end point is that which can be measured to assist in reaching the stated trial goal; efficacy must reflect meaningful benefit at the level of the patient with the disease.”3 Here, we present data that raises questions about whether SD, as currently reported, has any value in assessing drug efficacy. We argue that if cytostasis is to be used as an end point, then either a randomized control group is necessary or SD definitions should be carefully developed appropriate to specific tumor types based on careful evaluation of the distribution of time to progression (TTP) in comparable historical control groups. Otherwise, proven indicators of clinical benefit should be used.
MATERIALS AND METHODS
We catalogued response assessments in 143 phase II studies reported between October 2006 and March 2008 in 5 journals (Cancer, British Journal of Cancer, Clinical Cancer Research, The Journal of Clinical Oncology, and Lancet Oncology). Eighty-five used “cytotoxic therapies,” and 58 used TAR. The journals were chosen to represent a spectrum of international clinical trials encompassing a range of malignancies recognizing other equally valuable journals were not selected. The time period was chosen to retrieve sufficiently diverse reports of TAR as single agents or in combination with other TAR, while also trying to avoid the expected evolution to studies combining TAR with “traditional cytotoxic compounds.” All journals were examined “manually” and also using the individual journal’s online search engine. All phase II studies in advanced, locally advanced, unresectable, or metastatic diseases were tabulated. Forty-seven reports that used combinations with either radiotherapy or radioactive therapies were excluded, as were half that many because they combined CTX and TAR. All data were entered on an Excel spreadsheet and checked for accuracy twice. The majority were not randomized comparisons. However, if a study had 2 or more treatment arms, each arm was entered as a separate entry. Finally, although most studies reported the analyses as “intention to treat,” a few did not; however, similar results were obtained using the data as reported or after adjusting to reflect an intention to treat analysis and thus we used the reported data. Thirty-eight properties including complete response (CR), partial response (PR), SD, progression free survival (PFS), and overall survival (OS) were recorded for each study. The references can be found in Supplemental Material (http://links.lww.com/PPO/A2). The agents used were as follows:
CTX agents.
Amrubicin, capecitabine, carboplatin, cisplatin, cyclophosphamide, docetaxel, doxorubicin, epirubicin, estramustine, etoposide, 5FU, gemcitabine, ifosfamide, (indisulam), irinotecan, ixabepilone, pegylated liposomal doxorubicin, methotrexate, mitomycin-C, oxaliplatin, paclitaxel, topotecan, pemetrexed, S-1, SPI-77, temozolomide, treosulfan, trabectedin (ecteinascidin 743 or ET-743, Yondelis), ZT-1027 (Soblidotin), uracil-tegafur, vinblastine, vinflunine, and vinorelbine.
Targeted agents.
ABT-510, axitinib, bevacizumab, bexarotene, cetuximab, CI-1033(PD 183805), erlotinib, gefitinib, (IFN-alfa-2b), imatinib, lapatinib, lenalidomide, midostaurin, sorafenib, sunitinib, thalidomide, temsirolimus, octreotide, panitumumab, perifosine, pertuzumab, and PF-3512676.
RESULTS
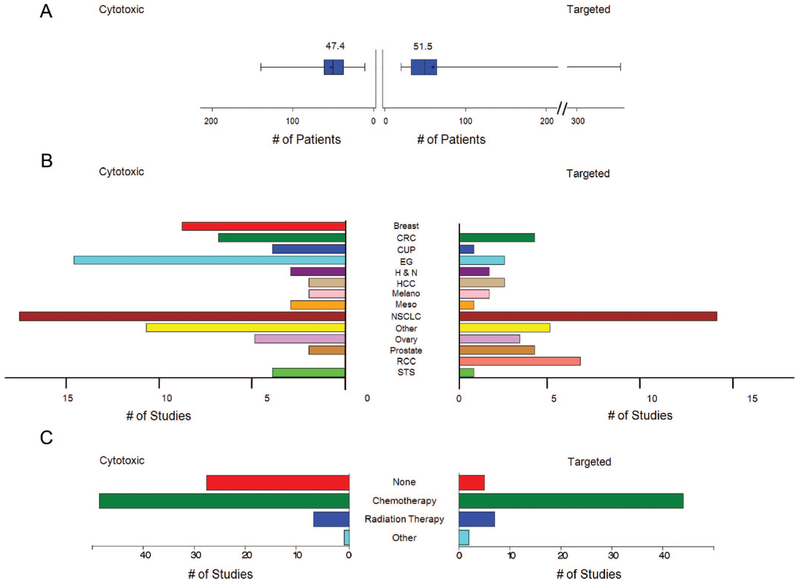
Eighty-five of the studies used only CTX therapies and 58 used only TAR. As shown in Figure 1, the 2 groups were comparable in several ways. The median number of patients per study was 45.5 and 42.5 for studies administering CTX and TAR, respectively (mean 47.4 and 51.5). Both groups had a similar distribution of histologies, with the exception of breast or gastro-esophageal histologies, which were more prevalent in studies administering CTX therapies and renal cell carcinoma (RCC), which was over-represented in TAR. The previous therapies allowed were grouped into 1 of 4 categories (none, chemotherapy, radiation therapy, and other) and, as shown in Figure 1, the distribution was similar although more studies with CTX agents had no previous therapy required, a difference that did not impact the subsequent analysis.
FIGURE 1.
Comparisons between studies where patients received cytotoxic therapy (left) or targeted therapy (right) (A) box plot of the mean number of patients per study, (B) bar chart of the total number of studies by cancer type, (C) bar chart of the total number of studies by prior therapy category. All differences were found nonsignificant except for the following pairs within each panel: panel B, CTX/esophagogastric versus TAR/esophagogastric (P = 0.0047), and CTX/breast versus TAR/breast (P = 0.0027); panel C, CTX/none versus TAR/none (P = 0.001). CRC indicates colorectal cancer; CUP, carcinoma of unknown primary; EG, esophagogastric; H&N, head and neck; Melano, melanoma; Meso, mesothelioma; STS, soft tissue sarcoma.
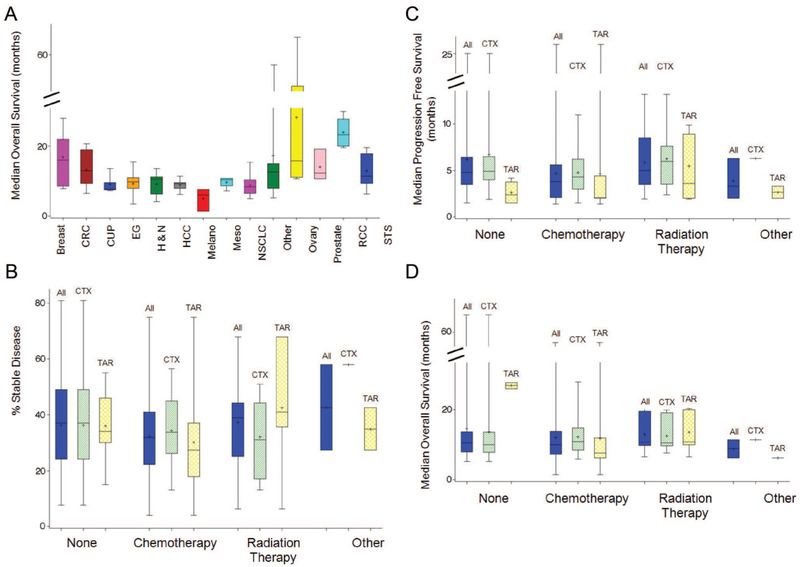
We next evaluated the PFS and OS for the 2 groups. The PFS (mean 5.6, median 4.8) and OS (mean 12.8, median 10.9) with CTX agents were similar to the PFS (mean 4.5, median 2.35) and OS (mean 12.6, median 9.15) with TAR. As shown in Figure 2, the OS of the various histologies overlapped and were not significantly different, suggesting patients with solid tumors who enroll in phase II clinical trials present a relatively homogenous group. Similarly, the percent SD, PFS, and OS were similar across the “prior therapy” groups whether they had enrolled on a clinical trial administering CTX or TAR. These similarities allowed us to explore response and prognostic correlations using patients with tumors comprising a broad histologic profile. Also note here the similar rates of SD across the different previous therapies categories.
FIGURE 2.
A, Box plots of median OS by 14 histologies. B-D, Box plots of percent SD (B), median PFS (C), and median OS (D) for 4 categories of prior treatment: none, other, radiation therapy, and chemotherapy. Within each category of prior treatment, groups are calculated; All refers to all patients from both the cytotoxic and targeted therapies groups, CTX refers to patients from the cytotoxic therapies group and TAR refers to patients from the targeted therapies group. All differences were found nonsignificant except for the following pairs within each panel: panel A, RCC versus all other cancers (P < 0.05); ovarian versus all other cancers (P < 0.05); breast cancer versus EG (P = 0.0494), breast cancer versus melanoma (P = 0.0472), and breast cancer versus NSCLC (P = 0.0254). Panel B, none/CTX versus chemotherapy/All (P = 0.0351). Panel C, radiation therapy/TAR versus chemotherapy/TAR (P = 0.0476); Panel D, none/TAR versus radiation therapy/All (P = 0.0361), none/TAR versus radiation therapy/CTX (P = 0.0406), and none/TAR versus radiation therapy/TAR (P = 0.0359). CRC indicates colorectal cancer; CUP, carcinoma of unknown primary; EG, esophagogastric; H&N, head and neck; Melano, melanoma; Meso, mesothelioma; STS, soft tissue sarcoma.
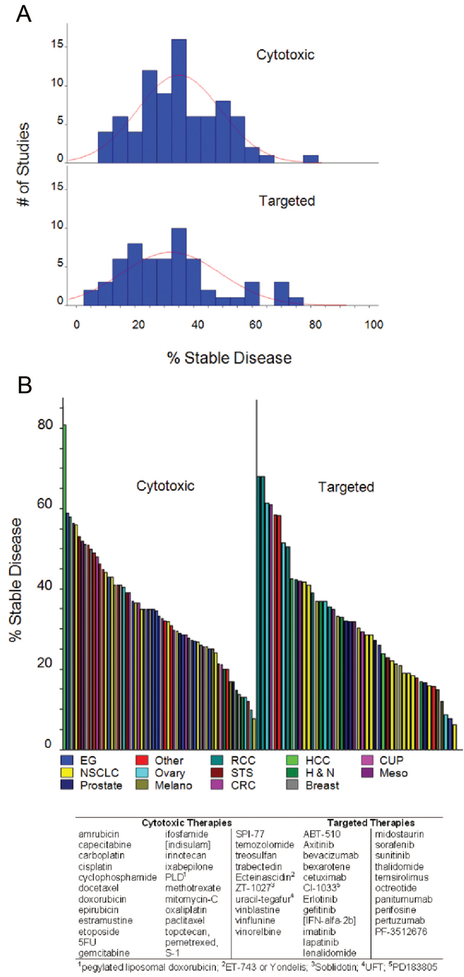
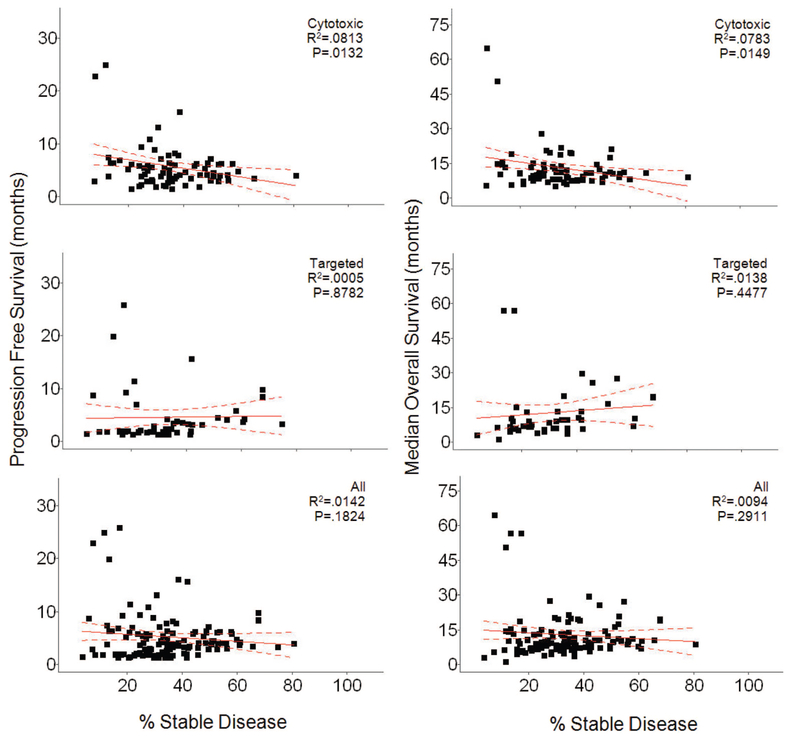
Remarkably, although all studies scored SD, in fact the duration of SD was defined in only 28.6% (41/143) of studies. The definitions varied, requiring lack of progression for a median of 10 weeks (range 4 weeks to 6 months) with medians of 11 and 9 weeks for studies employing CTX and TAR, respectively. The rates of SD were nearly identical for the 2 groups—medians of 34.7% and 31.05% for CTX and TAR, respectively (mean 35% versus 32.34%). If patients in all studies were individually counted, the rates of SD were also similar, 34% (1356/3982) and 32.8% (982/2992) for CTX and TAR, respectively. Furthermore, as shown in Figure 3A, the distribution of percent SD was similar. Also similar was their distribution by histology (Fig. 3B). All of this suggests properties other than therapy determine SD. As shown in Figure 4, we found no real relationships between the percent SD observed with any therapy and PFS or OS. The apparent correlations seen between SD and PFS or OS with CTX therapies (P = 0.0132 and P = 0.0144) are anomalous “negative correlations” that actually reflect the correlation of PFS and OS with CR + PR.
FIGURE 3.
A, Histograms of percent SD within studies where patients received cytotoxic (top) and targeted therapies (bottom). Each bar represents a 5% increment. B, Plots of percent SD, color-coded by cancer type, reported for studies where patients received cytotoxic (left) and targeted therapies (right). For visual symmetry, each bar on the right is approximately 45% wider. CRC indicates colorectal cancer; CUP, carcinoma of unknown primary; EG, esophagogastric; H&N, head and neck; Melano, melanoma; Meso, mesothelioma; STS, soft tissue sarcoma.
FIGURE 4.
Plots of median PFS (left) and median OS (right) as a function of percent SD. Within each comparison, 3 groups are plotted. Cytotoxic refers to the group of studies where patients received cytotoxic therapy, Targeted therapies refers to the group of studies where patients received targeted, and All refers to patients from both the cytotoxic and targeted therapies groups combined. The only significant correlations found were anomalous “negative correlations” within the cytotoxic group for percent SD with median PFS (P = 0.0132) and with median OS (P = 0.0144) (see text for details).
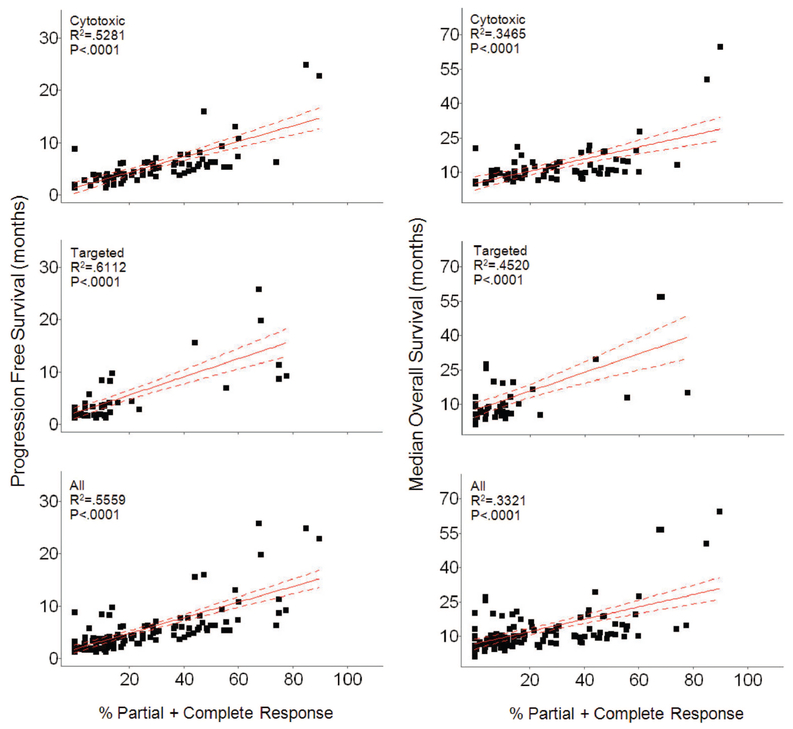
In contrast to the similarity in values for SD, the overall response rate (ORR) (CR + PR) was higher with CTX than with TAR (28% versus 13.1%) and as shown in Figure 5 demonstrated a strong correlation (P < 0.0001 for all variables) with PFS and OS for all therapies.
FIGURE 5.
Plots of median PFS (left) and median OS (right) as a function of percent PR + CR. Within each comparison, 3 groups are plotted. Cytotoxic refers to the group of studies where patients received cytotoxic therapy, targeted therapies refers to the group of studies where patients received targeted therapies and All refers to patients from both the cytotoxic and targeted therapies groups combined. In all plots, Percent PR + CR is significantly correlated (P < 0.0001) with both median PFS and median OS.
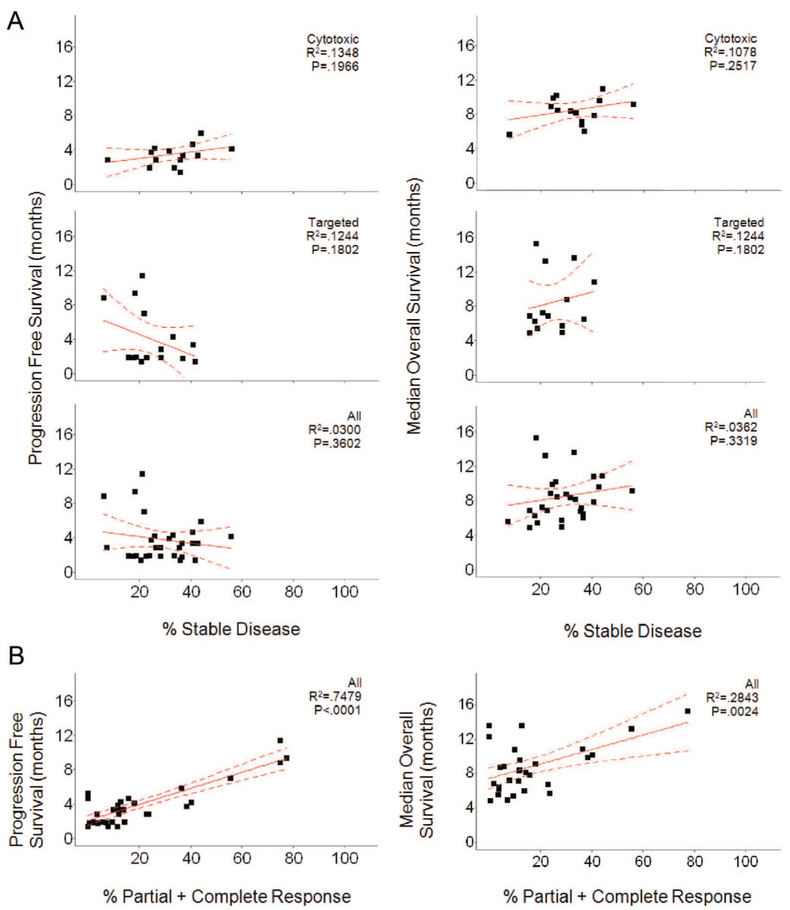
Although the similarities allowed us to compare results across a range of histologies, we were also able to examine a single histology, nonsmall cell lung cancer (NSCLC), in more detail because 35 NSCLC studies (18 CTX therapies/17 TAR) were part of the studies evaluated. In this subset, as in the group as a whole, there were no differences between the rate of SD reported for regimens using CTX (median 34.9%; 269/882 = 30.4%) and those using TAR (median 22.2%; 224/883 = 25.3%). Similarly, as shown in Figure 6, in NSCLC there was no correlation between the rate of SD and PFS or OS, although as shown in the lower panels, there was a correlation between CR + PR with both PFS and OS for all the NSCLC data.
FIGURE 6.
NSCLC analysis: (A) plots of median PFS (left) and median OS (right) as a function of percent SD. Within each comparison, 3 groups are plotted. Cytotoxic (top) refers to the group of studies where patients received cytotoxic therapy, targeted therapies (middle) refers to the group of studies where patients received targeted therapies, and All (bottom) refers to patients from both the cytotoxic and targeted therapies combined. B, Plot of median PFS (left) and median OS (right) as a function of Percent PR + CR. For each, 1 comparison is plotted, All, which refers to patients from both the cytotoxic and targeted groups. Percent PR + CR is significantly correlated with median PFS (P = 0.0001) and median OS (P = 0.0024).
Finally, to examine an additional histology in depth we expanded the survey to cover the period of 1/04 to 12/08 for phase II studies in breast cancer. In this period of time, we identified in the same 5 journals a total of 46 breast cancer studies including 30 that used CTX and 16 that employed TAR. In breast cancer, as in the group as a whole and the NSCLC subset, there were no differences between the rates of SD reported for regimens using CTX (median 34.9%; 570/1569 = 36.3%) or those using TAR (median 22.5%; 257/900 = 28.5%). Again, as in all the foregoing analyses, SD was not correlated with either PFS or OS, whereas CR + PR was strongly correlated (data not shown).
DISCUSSION
The era of TAR has included both successes and disappointments.4-8 Some have argued the disappointments are due in part to difficulties evaluating TAR in phase II clinical trials because SD and not OR were expected, a consequence of the “cytostatic” properties these agents have been said to possess. In its extreme, this has led to “cancer as a chronic disease” proposals. As noted in one publication, a “major challenge … is the lack of impressive response rates for many of the novel agents. Response rates may not be helpful at all in evaluating targeted agents that have growth inhibition as their primary effect (ie, cytostatic agents).”9 Assertions that TAR are primarily growth inhibitory or “cytostatic” have usually not been referenced, however, because scientific support for the concept of targeted agents as “cytostatic” especially compared with “traditional” CTX therapies has been generally lacking.
SD as a valid endpoint was assigned to antiangiogenic agents since they would “starve tumors.” Investigators wrote “it may be difficult to demonstrate a conventional antitumor response (ie, objective response) with antiangiogenic therapies in cohorts of patients with advanced disease.”10 Thus, they argued, “phase II trials designed to demonstrate the clinical activity (including durable stable disease) … would be ideal.” Subsequently, SD as a measure of activity was advanced for numerous other targeted agents. For example, investigators reporting early results with erlotinib concluded “disease stabilization with a median duration of 16.1 weeks … in 38% of patients” demonstrated “the static effects of erlotinib against refractory HNSCC.”11 Although those who reported early experience with lapatinib noted “twelve patients … had SD and 8 of 14 patients with clinical activity remained on lapatinib therapy for >3 months,” whereas “twenty-two patients with various tumors, most expressing either ErbB1 or ErbB2, experienced SD with a median duration of 4 months . . .. Together, these studies indicate the potential clinical activity of lapatinib in patients with a variety of solid tumors.”12 Numerous other examples can be cited.13-15
To be sure while some entertained, the possibility of SD as a measure of activity they did so with skepticism and advocated the need to test this concept using randomized control groups and novel trial designs.16,17 Unfortunately, as the studies tabulated in this analysis demonstrate, despite the recognized need for randomized trial designs or novel paradigms for interpretation,1 the design of choice has remained a “traditional” phase II design often with an emphasis on SD as a “signal of clinical activity.”
Remarkably, although all studies reported the percent of patients scored as having SD, in fact the duration of what constitutes SD was defined in only 28.6% (41/143) of studies. We would note that in the initial description of response evaluation criteria in solid tumor (RECIST) the authors wrote, “The clinical relevance of the duration of stable disease varies for different tumor types and grades. Therefore, it is highly recommended that the protocol specify the minimal time interval required between 2 measurements for determination of stable disease. This time interval should take into account the expected clinical benefit that such a status may bring to the population under study.”18 Among the studies reporting a definition, the median was 10 weeks—a value that many oncologists and most patients would not consider meaningful, especially, without impact on PFS or OS. Indeed, periods as short as 4 to 6 weeks have been scored as SD in reporting phase III trials, a value many find unsatisfactory. (Sorafenib in advanced RCC, “Table 2: Stable disease was defined as disease that remained unchanged for 28 days”; and Sorafenib in RCC first line: “disease control rate (DCR); ie, stable disease [SD] for ≥6 weeks . . ..”)19,20
The lack of a definition in >2/3 of studies is especially disappointing because it is used in the context of precise RECIST-driven response measurements. As others have previously noted, “Standardized response criteria are essential for the conduct of clinical research. They facilitate interpretation of data, comparisons of the results among various clinical trials, and identification of new agents with promising activity, and provide a framework on which to evaluate new biologic and immunologic insights into the diseases being studied. The availability of uniform guidelines ensures a reliable analysis of comparable patient groups among studies and acquisition of similar data”.21 The lack of such definitions in most studies means the information provided—the rate of SD—is of no value because it has not been defined and those reading a report cannot assess its import. Although seasoned investigators, like Supreme Court Justice Potter Stewart, may argue, “they know SD when they see it” lacking a definition or better yet a randomized trial, such information is merely anecdotal. (From the opinion of Potter Stewart (January 23, 1915 to December 7, 1985), Associate Justice of the United States Supreme Court, in the obscenity case of Jacobellis V. Ohio (1964). Stewart wrote in his short concurrence that “hard-core pornography” was hard to define, but that “I know it when I see it.”) Similarly, an experienced clinician might argue that a patient with documented disease progression who enrolls on a study and has modest regression has had “clinical benefit.” However, this type of data has seldom been gathered before study enrollment, and we do not know whether such an observation, if true, would translate to PFS or OS. In this regard, we would note again that the reported SD values had no correlation with PFS or OS. This is further evidence of the limitations of current SD designations. One would expect it would be correlated at a minimum with PFS because both measures are based on TTP. Although a positive correlation of SD with PFS or OS would not unequivocally establish that SD measured antitumor effect, the lack of correlation raises serious questions about the current definition and measurement of SD.
It is not certain that defining SD would add much value to that currently provided by PFS or TTP; these are values that are currently reported in a majority of studies, including 90.9% (130/143) of those surveyed for this analysis. It is rather clear that PFS results cannot be interpreted in terms of therapeutic effect without a control group. Reporting SD tends to obscure this fact. Furthermore, as has been previously noted, “we should not rush to falsely define drugs as active on the basis of stable disease, since stable disease is a composite outcome consisting of inherent tumor growth kinetics and potential drug effect.”22
The nearly identical SD rates for the 2 therapy groups and their similar distribution and median durations suggests properties other than therapy are responsible for SD. Indeed, the near identity of the profiles with a median duration of PFS of 4.05 months suggests this duration of SD is likely to be similar across many refractory solid tumors.
In contrast to the values for SD, the ORR (CR + PR) was higher with CTX than with TAR (mean 28% versus 13.1%; median 25% versus 5.3%) and demonstrated a strong correlation (P < 0.0001) with PFS and OS for both CTX and TAR. Although one could argue this suggests these measures of drug activity are more meaningful and should be sought in all clinical trials, we cannot be confident that trials with higher ORR and longer PFS and OS did not contain more prognostically favorable patients than the other trials.
Our results are consistent with and extend a recent review of phase II trial designs used in studies of TAR, which concluded that “even relatively low rates of objective response may signal that an agent has potential for achieving regulatory approval” and inferred “that agents affecting targets that are meaningful in one or more cancer types should reasonably be expected to cause tumor shrinkage in at least some patients.”23 The authors concluded, “Failing to see any evidence of response at all suggests that the drug is likely to fail in subsequent development.” Similarly, in a recent review of CTX agents the authors reported a relationship between phase II response rate and eventual regulatory approval—with approval more likely the higher the response rate.24 Although our data in general agree with these conclusions we would caution against redefining the level of shrinkage needed to qualify as a response to a value that is much less than current RECIST standards. Using a reduced level of shrinkage, as the response threshold can be problematic with regard to measurement error unless more accurate imaging is used.
Thus, we conclude that SD as currently defined and measured, occurs as frequently with CTX as with TAR and likely often reflects the natural course of the disease, not a therapeutic effect of the drug regimen. Responses are observed with TAR as with CTX, and this analysis suggests that even for TAR it is a measure of activity that should be sought. Assertions that targeted agents are generally cytostatic should be discouraged. Indeed given that there will likely never be a targeted agent more specific than any of our “cytotoxic” microtubule-targeting agents, and few agents more CTX than sunitinib in renal cell carcinoma or flavopiridol in CLL, 2 TAR, we would argue that this artificial divide should be ended.6,25,26 Finally, whether a clinically meaningful definition of SD can be identified remains to be determined. Generally, if one wishes to reliably evaluate the potential cytostatic effect of a treatment, then a randomized phase II trial using PFS as an end point is recommended.
Supplementary Material
REFERENCES
- 1.Gelmon KA, Eisenhauer EA, Harris AL, et al. Anticancer agents targeting signaling molecules and cancer cell environment: challenges for drug development? J Natl Cancer Inst. 1999;91:1281–1287. [DOI] [PubMed] [Google Scholar]
- 2.Korn EL, Arbuck SG, Pluda JM, et al. Clinical trial designs for cytostatic agents: are new approaches needed? J Clin Oncol. 2001;19:265–272. [DOI] [PubMed] [Google Scholar]
- 3.Eisenhauer EA. Phase I and II trials of novel anti-cancer agents: endpoints, efficacy and existentialism. Ann Oncol. 1998;10:1047–1052. [DOI] [PubMed] [Google Scholar]
- 4.Druker BJ, Guilhot F, O’Brien SG, et al. ; IRIS Investigators. Five-year follow-up of patients receiving imatinib for chronic myeloid leukemia. N Engl J Med. 2006;355:2408–2417. [DOI] [PubMed] [Google Scholar]
- 5.Blanke CD, Rankin C, Demetri GD, et al. Phase III randomized, intergroup trial assessing imatinib mesylate at two dose levels in patients with unresectable or metastatic gastrointestinal stromal tumors expressing the kit receptor tyrosine kinase: S0033. J Clin Oncol. 2008;26:626–632. [DOI] [PubMed] [Google Scholar]
- 6.Motzer RJ, Hutson TE, Tomczak P, et al. Sunitinib versus interferon alfa in metastatic renal-cell carcinoma. N Engl J Med. 2007;356:115–124. [DOI] [PubMed] [Google Scholar]
- 7.Tol J, Koopman M, Cats A, et al. Chemotherapy, bevacizumab, and cetuximab in metastatic colorectal cancer. N Engl J Med. 2009;360:563–572. [DOI] [PubMed] [Google Scholar]
- 8.Hecht JR, Mitchell E, Chidiac T, et al. A randomized phase IIIB trial of chemotherapy, bevacizumab, and panitumumab compared with chemotherapy and bevacizumab alone for metastatic colorectal cancer. J Clin Oncol. 2009;27:672–680. [DOI] [PubMed] [Google Scholar]
- 9.Roberts TG Jr, Lynch TJ Jr, Chabner BA. The phase III trial in the era of targeted therapiesgeted therapy: unraveling the “go or no go” decision. J Clin Oncol. 2003;21:3683–3695. [DOI] [PubMed] [Google Scholar]
- 10.Gasparini G, Longo R, Fanelli M, et al. Combination of antiangiogenic therapy with other anticancer therapies: results, challenges, and open questions. J Clin Oncol. 2005;23:1295–1311. [DOI] [PubMed] [Google Scholar]
- 11.Soulieres D, Senzer NN, Vokes EE, et al. Multicenter phase II study of erlotinib, an oral epidermal growth factor receptor tyrosine kinase inhibitor, in patients with recurrent or metastatic squamous cell cancer of the head and neck. J Clin Oncol. 2004;22:77–85. [DOI] [PubMed] [Google Scholar]
- 12.Burris HA III, Hurwitz HI, Dees EC, et al. Phase I safety, pharmacokinetics, and clinical activity study of lapatinib (GW572016), a reversible dual inhibitor of epidermal growth factor receptor tyrosine kinases, in heavily pretreated patients with metastatic carcinomas. J Clin Oncol. 2005;23:5305–5313. [DOI] [PubMed] [Google Scholar]
- 13.Wolf M, Swaisland H, Averbuch S. Development of the novel biologically targeted anticancer agent gefitinib: determining the optimum dose for clinical efficacy. Clin Cancer Res. 2004;10:4607–4613. [DOI] [PubMed] [Google Scholar]
- 14.Brachmann S, Fritsch C, Maira SM, et al. PI3K and mTOR inhibitors: a new generation of targeted anticancer agents. Curr Opin Cell Biol. 2009;21:194–198. [DOI] [PubMed] [Google Scholar]
- 15.Strumberg D, Clark JW, Awada A, et al. Safety, pharmacokinetics, and preliminary antitumor activity of sorafenib: a review of four phase I trials in patients with advanced refractory solid tumors. Oncologist. 2007;12:426–437. [DOI] [PubMed] [Google Scholar]
- 16.Stadler WM, Ratain MJ. Development of target-based antineoplastic agents. Invest New Drugs. 2000;18:7–16. [DOI] [PubMed] [Google Scholar]
- 17.Ratain MJ, Stadler WM. Clinical trial designs for cytostatic agents. J Clin Oncol. 2001;19:3154–3155. [DOI] [PubMed] [Google Scholar]
- 18.Therasse P, Arbuck SG, Eisenhauer EA, et al. New guidelines to evaluate the response to treatment in solid tumors. European Organization for Research and Treatment of Cancer, National Cancer Institute of the United States, National Cancer Institute of Canada. J Natl Cancer Inst. 2000;92:205–216. [DOI] [PubMed] [Google Scholar]
- 19.Escudier B, Eisen T, Stadler WM, et al. ; TARGET Study Group. Sorafenib in advanced clear-cell renal-cell carcinoma. N Engl J Med. 2007;356:125–134. [DOI] [PubMed] [Google Scholar]
- 20.Escudier B, Szczylik C, Hutson TE, et al. Randomized phase II trial of first-line treatment with sorafenib versus interferon Alfa-2a in patients with metastatic renal cell carcinoma. J Clin Oncol. 2009;27:1280–1289. [DOI] [PubMed] [Google Scholar]
- 21.Cheson BD, Horning SJ, Coiffier B, et al. Report of an International Workshop to standardize response criteria for non-Hodgkin’s lymphomas. J Clin Oncol. 1999;17:1244–1253. [DOI] [PubMed] [Google Scholar]
- 22.Ratain MJ, Eckhardt SG. Phase II studies of modern drugs directed against new targets: if you are fazed, too, then resist RECIST. J Clin Oncol. 2004;22:4442–4425. [DOI] [PubMed] [Google Scholar]
- 23.El-Maraghi RH, Eisenhauer EA. Review of phase II trial designs used in studies ofmolecular targeted therapies: outcomes and predictors ofsuccess in phase III. JClin Oncol. 2008;26:1346–1354. [DOI] [PubMed] [Google Scholar]
- 24.Goffin J, Baral S, Tu D, et al. Objective responses in patients with malignant melanoma or renal cell cancer in early clinical studies do not predict regulatory approval. Clin Cancer Res. 2005;11:5928–5934. [DOI] [PubMed] [Google Scholar]
- 25.Byrd JC, Lin TS, Dalton JT, et al. Flavopiridol administered using a pharmacologically derived schedule is associated with marked clinical efficacy in refractory, genetically high-risk chronic lymphocytic leukemia. Blood. 2007;109:399–404. [DOI] [PMC free article] [PubMed] [Google Scholar]
- 26.Phelps MA, Lin TS, Johnson AJ, et al. Clinical response and pharmacokinetics from a phase I study of an active dosing schedule of flavopiridol in relapsed chronic lymphocytic leukemia. Blood. 2009;113:2637–2645. [DOI] [PMC free article] [PubMed] [Google Scholar]
Associated Data
This section collects any data citations, data availability statements, or supplementary materials included in this article.


