Abstract
Histologic assessment of stromal tumor infiltrating lymphocytes (sTIL) as a surrogate of the host immune response has been shown to be prognostic and potentially chemo-predictive in triple-negative and HER2-positive breast cancers. The current practice of manual assessment is prone to intra- and inter-observer variability. Furthermore, the inter-play of sTILs, tumor cells, other microenvironment mediators, their spatial relationships, quantity, and other image-based features have yet to be determined exhaustively and systemically. Towards analysis of these aspects, we developed a deep learning based method for joint region-level and nucleus-level segmentation and classification of breast cancer H&E tissue whole slide images. Our proposed method simultaneously identifies tumor, fibroblast, and lymphocyte nuclei, along with key histologic region compartments including tumor and stroma. We also show how the resultant segmentation masks can be combined with seeding approaches to yield accurate nucleus classifications. Furthermore, we outline a simple workflow for calibrating computational scores to human scores for consistency. The pipeline identifies key compartments with high accuracy (Dice= overall: 0.78, tumor: 0.83, and fibroblasts: 0.77). ROC AUC for nucleus classification is high at 0.89 (micro-average), 0.89 (lymphocytes), 0.90 (tumor), and 0.78 (fibroblasts). Spearman correlation between computational sTIL and pathologist consensus is high (R=0.73, p<0.001) and is higher than inter-pathologist correlation (R=0.66, p<0.001). Both manual and computational sTIL scores successfully stratify patients by clinical progression outcomes.
Keywords: Tumor infiltrating lymphocytes, convolutional networks, deep learning, computational pathology
1. INTRODUCTION
Tumor Infiltrating Lymphocytes (TiL’s) have seen increasing interest in recent years as important surrogate markers of immune response and cancer prognosis in multiple tumor types 1. In breast cancer, and specifically in the Her2+ and triple-negative subtypes (lacking markers for estrogen, progesterone, and Her2), they are known to have strong prognostic value, and have recently been incorporated into clinical guidelines 2. The most important metric used in clinical practice is sTIL, stromal TILs, which is defined as the fraction of intra-tumoral stroma occupied by lymphocytes. Unlike many histopathology workflows, however, the manual quantification of sTIL (m-sTIL) is particularly well-known for its subjectivity and inter-observer variability, given the difficulty of accurate gauging of which regions to include, and how to accurately estimate the area occupied by lymphocytes 2. To address this challenge, we developed a streamlined pipeline for integrated, joint region- and cell-level semantic segmentation of Whole-Slide histopathology Images (WSI’s). Specifically, we quantified lymphocytic infiltration of the tumor microenvironment in triple-negative breast cancer (TNBC) (Figure 1).
Figure 1.
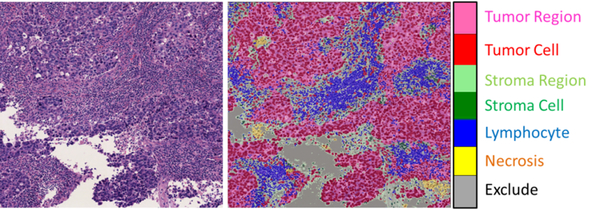
Problem setting. Quantification of tumor infiltrating lymphocytes is a complex task involving segmentation of diverse histological structures. (Left) A representative tile from a testing set slide containing dense sTIL infiltration. (Right) Segmentation output from our model, trained to jointly segment region and cell-level information. Necrotic regions and excluded areas (white spaces, artifacts, etc) are important to segment so that they do not skew the sTIL score calculations.
Whereas traditional approaches rely on feature engineering, we exploited fully-convolutional neural networks (FCN-8), using ImageNet-pretrained VGG16 architecture, for an unbiased approach that outputs pixel-wise class probability maps 3. Moreover, we avoided step-wise “classical” computational pathology approaches, where nuclei are segmented, postprocessed, and then used to infer region types 4. Instead, we encoded both the cell- and region- level information in the ground truth itself, hence ensuring that biologically-infeasible (or irrelevant) region-cell combinations are excluded during training; for example, fibroblasts cannot be found in tumor regions. This combined approach helps focus the training process in an integrated fashion, with reduced or minimized expert review or post-processing. Combining this deep-learning workflow with traditional seeding methods results in accurate segmentation and cell classification results, which are used to obtain computational sTIL scores (c-sTIL) that correlate well with pathologist consensus.
2. METHODS
The overall workflow used to obtain segmentation and classification result is illustrated in Figure 2.
Figure 2.
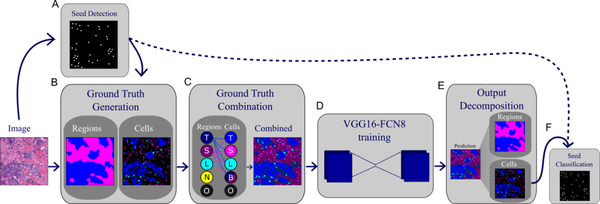
Overall workflow used to obtain region and nucleus classification, as well as seed classification from tiled slides. A. Seeds are extracted from RGB images after deconvolution. B. Region-level ground truth is annotated and semi-automated nucleus segmentation ground truth is vetted by a pathologist. C. Region and nucleus-level ground truth is combined into one common mask to be used for training. This process ensures consistency and excludes biologically-infeasible combinations. D. A fully-convolutional network is trained to output a combined mask. E. Output is decomposed into region and nucleus segmentation masks. F. Seed classifications are obtained from the cell segmentation mask.
2.1. Dataset used and ground truth generation
The cohort used in this study consists of 120 anonymized H&E stained slides, which were obtained from the Cleveland Clinic Foundation, and scanned using a single Aperio scanner at 20× magnification. The slides had m-sTIL scores from two practicing pathologists, who resolved inconsistent scores via consensus. 14 slides had available ground truth, 5 of which were held-out to measure segmentation and classification generalization accuracy. Two models were trained: 1. A model to calculate segmentation and classification testing set accuracies (trained on 9 slides); and 2. A model to calculate sTIL scores over the entire dataset (trained on all 14 slides with available ground truth). The 14 slides with available annotations were divided into overlapping tiles of size 1024×1024. The annotated slides were chosen to represent as many of the histological structures as possible within the dataset. Note that the ground truthing process is extremely labor-intensive, and the regions chosen for annotation are fairly large (on the order of ~5K pixels squared) to ensure adequate training and trustable accuracy metrics. Two types of segmentation ground truth were obtained:
Region level ground truth: this was manually annotated by drawing polygon boundaries at tissue interfaces.
Cell-level segmentation ground truth: this was obtained in a semi-automatic manner. Traditional methods based on radial symmetry were used to extract seeds and segment nuclei, whose class was then determined using size and shape heuristics to provide a first-cut approximation of nucleus classification 5.
The results were overlooked and corrected by a senior pathologist.
2.2. Combining region and nucleus ground truths
Region and nucleus segmentation masks were combined such that pixel value encodes both region and nucleus membership information; essentially the fully-convolutional model was trained to classify pixels into 12 different classes (Table 1). Combining different classification problems in the same framework had two advantages. First, it reduces reliance on postprocessing heuristics, such as ensemble learning or parameter tuning approaches, to combine the two sets of results. Second, it utilizes a priori biological knowledge to generate consistent results. For example this framework disallows any cell classifications within necrotic regions (nuclear debris and dead cells are counted as part of the necrotic region and not delineated individually). It also disallows stromal cells (fibroblasts) within non-stromal regions. To incorporate non-nuclear components of a histologic region, including cell cytoplasm, extracellular matrix and other structural elements, we also included region categories that correspond to non-nuclear elements.
Table 1.
Combined mask code and corresponding region and cell information encoding.
| Code | Region | Nucleus | Code | Region | Nucleus |
|---|---|---|---|---|---|
| 1 | Background | N/A | 7 | Stroma | Lymphocyte |
| 2 | Tumor | Tumor | 8 | Lymphocyte | Lymphocyte |
| 3 | Stroma | Tumor | 9 | Tumor | N/A |
| 4 | Lymphocyte | Tumor | 10 | Stroma | N/A |
| 5 | Stroma | Stroma | 11 | Necrosis | N/A |
| 6 | Tumor | Lymphocyte | 12 | Lymphocyte | N/A |
2.3. Fully Convolutional model training and inference
We tried two architectures for training: VGG16-FCN8 and FC-DensNet103 3,6 (Figure 3). VGG16-FCN8 showed better training and convergence properties and was hence chosen.
Figure 3.
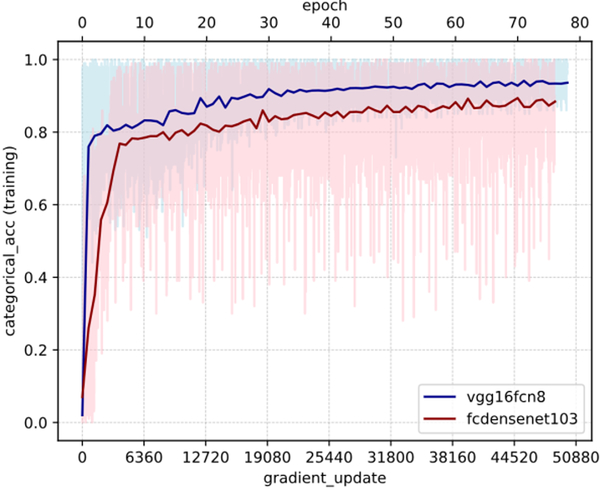
Effect of architecture on training categorical accuracy (model fitting). Light colors represent the batch-level accuracy, while darker colors represent epoch-level accuracies. Pre-trained VGG16-FCN8 has better model fitting properties than the deeper and more complex fully-connected DenseNet-103 for this problem setting. Also note the remarkably higher batch-tobatch variability in FC-DenseNet compared to VGG. Both networks were trained on the same set of slides with exactly the same set of hyperparameters, including batch size, optimizer type and learning rate, for comparability.
Our model that has been pre-trained on ImageNet in tensorflow, but we only used pre-training as a weight initialization strategy, and allowed the full 16 layer weights to be optimized during the training process. We used Adam optimizer and learning rate of 1e-5 3,7. Single machine, 4-GPU data parallelism with gradient averaging was used. The main model was instantiated on each of GPUs with weight sharing. A batch of 4 images is sent to each of the GPUs for gradient calculation. These are sent back to the CPU and averaged to get the overall gradient update 8. Weighted categorical cross entropy loss was used to train the model, with the class-specific weights being determined as:
| (1) |
Where Nc is the number of pixels belonging to class c in the training dataset. This helps handle class imbalance during training by assigning higher weight to less abundant classes. Categorical accuracies reported are defined as the argmax of soft class prediction probabilities. Two methods of data augmentation were used to improve robustness of the training process: 1. Tiles were generated with an a shift overlap of 250 pixels; 2. A random FOV of size 768×768 was cropped on the fly and is what is actually input to train the model. After the network has been trained, the tile size used for inference ranged from 1024×1024 to 2048×2048. Note that the trained convolutional weights in a fully-convolutional network can be applied to any tile size as long as it fits in GPU memory. The combined prediction mask from the trained network is then decomposed back into region and cell-specific masks by reverse-mapping the coding scheme in Table 1. Note, however, that the “background in lymphocyte region” (i.e. pixel does not belong to a cell, but region was annotated as lymphocyte-rich) was mapped to stromal regions. It is important to note that, technically-speaking there is no “lymphocyte region”, and that while lymphocytes may tend to aggregate there is no clear threshold for the density at which lymphocytic aggregates are considered to be a region. The lymphocyte region class, therefore, was just used to facilitate ground-truthing (create a single boundary rather than click on hundreds of cells) and to train the model to detect these aggregates. For all slides (training/testing), a hard threshold of 220 (for all R, G, B channels) was used to map all white regions to the exclude class. Segmentation accuracy was quantified using the DICE coefficient (2× intersection over bag union).
2.4. Seed classification by pixel class majority
The soft scores for seed class membership are obtained by counting the proportion of a circle of radius r pixels that belongs to the class of interest. The final classification of a seed is therefore determined by the equation:
| (2) |
Where nc is the number of pixels belonging to class c within a radius r of the nucleus seed. This helps de-noise some of the segmentation inaccuracies. A radius of 5 pixels was used in our experiments.
2.5. c-sTIL scoring and progression outcomes analysis
We focused on sTILs, as opposed to intra-tumoral TILs (tTILs) to faithfully adhere to the clinical scoring guidelines. The guidelines mention a set of rules that determine which regions are suitable for calculating sTIL scores, most notably 2:
Do not focus on “hot spots” too much: This rule was set to facilitate manual scoring, but is not very relevant to computational quantification, since we calculate the statistics globally across all included tiles without the inherent biases of manual scoring.
Do not include cells in necrotic regions: we segment necrotic regions and exclude them in the calculation.
- Focus on stromal areas proximal to the tumor: we addressed this by discarding the bottom x percentile of tiles by tumor fraction, where x is determined by supervised hyperparameter tuning. The slides used to train the segmentation algorithm were combined with 16 others (randomly chosen) to construct a new training set. The process was repeated 30 times (Monte-Carlo cross validation). During each “trial”, the training set was used to:
- Find the optimal exclusion threshold which maximizes correlation with pathologist sTIL scores on the training set; and b. Learn the linear calibration bias to map absolute algorithmic scores to manual scores.
A threshold value of 10% (based on clinical guidelines), was used to dichotomize the sTIL scores for outcome correlative analysis 2. A “progression” event was defined as the earliest occurrence of local, regional, or distant metastasis events.
3. RESULTS AND DISCUSSION
Model predictions on the held-out testing set are accurate and correspond well to ground truth and underlying tissue boundaries (Figure 4). Discrepancies between the model and ground truth arise from inaccuracies in either the prediction or the ground truth itself. Ground truth may be inaccurate for a number of reasons:
Figure 4.
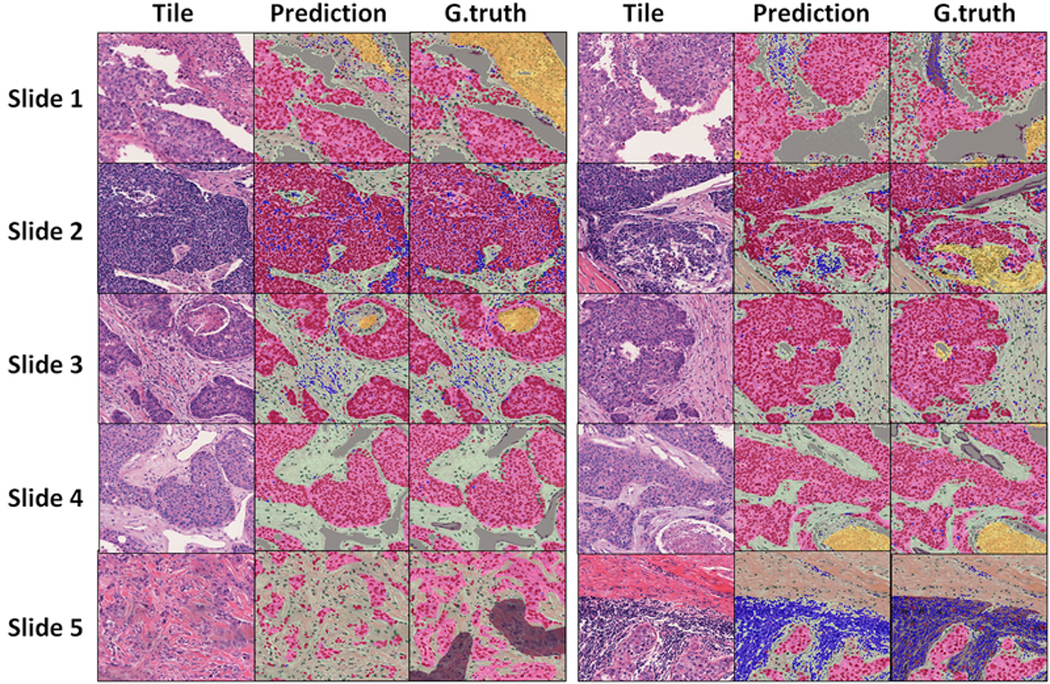
Qualitative examination of segmentation results on the testing set. Representative tiles from each the testing set. Slide 1 (right) and Slide 5 (right): Non-cellular components of “lymphocyte regions” (grey) were present in ground truth (for training) but were mapped to stroma in output. Slide 2 (left): enclosed stromal region within a tumor nest is missed in ground truth but is picked up by trained model. Slide 2 (right) and Slide 3 (right) algorithm misclassified small necrotic region as stroma. Slide 5 (left): Ground truth connects small, scattered tumor nests under one tumor “region”, whereas the model learns to more accurately delineate region boundaries.
Human limitations. Human annotators tend to prefer smooth contours and connected regions, even when the true underlying tissue structures have jagged edges and are composed of multiple scattered regions. Moreover, there is considerable difficulty in noticing and segmenting every lymphocyte in the dataset, whether manually or through vetting of moderately accurate H&E radial symmetry segmentation algorithms. Essentially, the model is learning the latent representation within a noisy ground truth, resulting in predictions that oftentimes surpass the limitations of ground truth 9.
Limitations related to the accuracy of deconvolution, seeding and segmentation used to generate the cell-level ground truth.
The accuracy of region segmentation, as measured using the Dice coefficient, was: 0.78 (overall), 0.83 (tumor) and 0.77 (stroma). Seed classification area under receiver-operator characteristics curve was 0.89 (micro-average), 0.89 (lymphocytes), 0.90 (tumor), and 0.78 (fibroblasts) (Figure 5).
Figure 5.
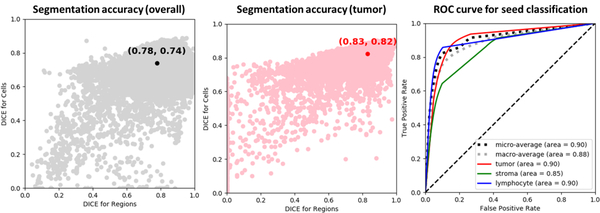
Accuracy of segmentation and classification. (Left) Overall semantic segmentation accuracy, measured by the DICE coefficient. The accuracy was calculated after decomposition of the model output into separate region and nucleus segmentation masks. Every point represents the accuracy over one tile in the testing set. Note the general correspondence between segmentation accuracy for regions and for nuclei. (Middle) Segmentation accuracy for tumor classification. (Right) Receiver-Operator Characteristics curve for final seed classification by pixel class majority.
Computational sTIL scores were strongly and significantly correlated with consensus pathologist scores (Figure 6). Spearman Correlation between computational sTIL and pathologist consensus is high (R=0.73, p<0.001) and is higher than inter-pathologist correlation (R=0.66, p<0.001), though smaller in magnitude (hence the rationale for learning the linear calibration). We believe this magnitude difference is related to the inherent biases and ambiguity in estimating area by human observers.
Figure 6.
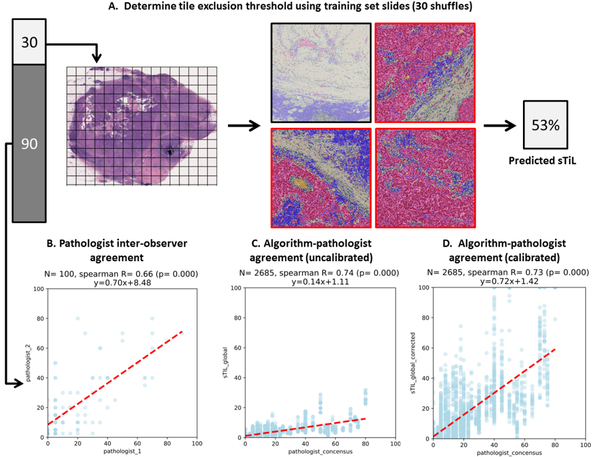
Calculating sTIL scores and correlating with consensus manual pathologist scores. A. Supervised tile selection process using the training set. The 30 training slides are used to learn a threshold for excluding irrelevant tiles by tumor fraction and to learn a linear calibration to map true c-sTIL fraction to what would be perceived as the sTIL fraction by a practicing pathologist. B. Agreement between the two pathologists. C. Agreement between algorithmic TiL scores and pathologist consensus. Each point represents one testing set slide from one of the 30 shuffles. D. Same as C, but after linear calibration.
The dichotomized sTIL score is 85% accurate in identifying low sTIL slides. This low sTIL group is characterized by poor survival outcomes, both using m-sTIL and c-sTIL scoring, consistent with existing literature and providing an additional layer of validation to the computational pipeline described here (Figure 7).
Figure 7.
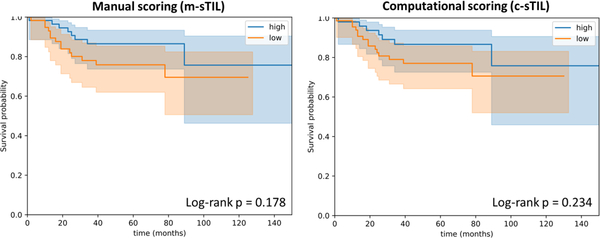
Kaplan-Meier curves for dichotomized human and computational sTIL scores. A threshold of 10% was used to distinguish low- from moderate or high infiltrates, consistent with the published guidelines.
4. LIMITATIONS AND CONCLUSIONS
This work, like most others in the current computational pathology space, is limited by the lack of large-scale validated ground truth for segmentation of salient tissue components in breast cancer H&E images. Nonetheless, the limited dataset we have illustrates the validity of methods presented, both analytically (segmentation and classification accuracy) and clinically (TIL score and disease outcomes). The rarity of TNBC resulted in a relative scarcity of progression events, causing the Kaplan-Meier analysis to be slightly under-powered. Nevertheless, the trends are in the right direction and are almost indistinguishable for m-sTIL and c-sTIL scoring. Future work will investigate generalization of this algorithm to independent datasets derived from institutions not included in the model training and optimization process.
Our results illustrate how an end-to-end framework enables accurate and consistent estimation of tumor infiltrating lymphocytes in breast cancer. The results are highly concordant with consensus scores from pathologists and successfully stratify patients by clinical progression outcomes. In the future we intend to extract various spatial sTIL metrics for correlation with clinical and genomic variables.
REFERENCES
- [1].Hendry S, Salgado R, Gevaert T, Russell PA, John T, Thapa B, Christie M, van de Vijver K, Estrada MV, Gonzalez-Ericsson PI, Sanders M, Solomon B, Solinas C, Van den Eynden GGGM, Allory Y, Preusser M, Hainfellner J, Pruneri G, Vingiani A, et al. , “Assessing Tumor-Infiltrating Lymphocytes in Solid Tumors: A Practical Review for Pathologists and Proposal for a Standardized Method from the International Immuno-Oncology Biomarkers Working Group: Part 2: TILs in Melanoma, Gastrointestinal Tract Carcinom,” Adv. Anat. Pathol. 24(6), 311–335 (2017). [DOI] [PMC free article] [PubMed] [Google Scholar]
- [2].Salgado R, Denkert C, Demaria S, Sirtaine N, Klauschen F, Pruneri G, Wienert S, Van den Eynden G, Baehner FL, Penault-Llorca F, Perez EA, Thompson EA, Symmans WF, Richardson AL, Brock J, Criscitiello C, Bailey H, Ignatiadis M, Floris G, et al. , “The evaluation of tumor-infiltrating lymphocytes (TILs) in breast cancer: recommendations by an International TILs Working Group 2014.,” Ann. Oncol. Off. J. Eur. Soc. Med. Oncol. 26(2), 259–271 (2015). [DOI] [PMC free article] [PubMed] [Google Scholar]
- [3].Long J, Shelhamer E and Darrell T, “Fully Convolutional Networks for Semantic Segmentation” (2014). [DOI] [PubMed] [Google Scholar]
- [4].AP R, Khan SS, Anubhav K and Paul A, “Gland Segmentation in Histopathology Images Using Random Forest Guided Boundary Construction” (2017). [Google Scholar]
- [5].Xing F and Yang L, “Robust Nucleus/Cell Detection and Segmentation in Digital Pathology and Microscopy Images: A Comprehensive Review.,” IEEE Rev. Biomed. Eng. 9, 234–263 (2016). [DOI] [PMC free article] [PubMed] [Google Scholar]
- [6].Jégou S, Drozdzal M, Vazquez D, Romero A and Bengio Y, “The One Hundred Layers Tiramisu: Fully Convolutional DenseNets for Semantic Segmentation” (2016). [Google Scholar]
- [7].Kingma DP and Ba J, “Adam: A Method for Stochastic Optimization” (2014). [Google Scholar]
- [8].Tensorflow., “Cifar 10 multi-GPU training tutorial” (2018). [Google Scholar]
- [9].Khoreva A, Benenson R, Hosang J, Hein M and Schiele B, “Simple Does It: Weakly Supervised Instance and Semantic Segmentation” (2016). [Google Scholar]


