

ABSTRACT
The ability to quantify fecundity is critically important to a wide range of experimental applications, particularly in widely-used model organisms such as Drosophila melanogaster. However, the standard method of manually counting eggs is time consuming and limits the feasibility of large-scale experiments. We develop a predictive model to automate the counting of eggs from images of eggs removed from the media surface and washed onto dark filter paper. Our method uses the simple relationship between the white area in an image and the number of eggs present to create a predictive model that performs well even at high egg densities where clumping can complicate the individual identification of eggs. A cross-validation approach demonstrates our method performs well, with a correlation between predicted and manually counted values of 0.88. We show how this method can be applied to a large data set where egg densities vary widely.
KEYWORDS: Image analysis, fecundity, Drosophila melanogaster, quantitative biological imaging, cross-validation
Introduction
Reproductive output, with its close tie to Darwinian fitness, is potentially the most important of an individual’s phenotypes and thus a critical phenotype to be able measure in many different experiments. While counting the number of eggs or offspring produced by an individual is simple in concept, in practice it is often quite challenging. In many insect systems, including the widely used model organism Drosophila melanogaster (D. melanogaster), females produce a large number of eggs over their lifetime, and the most common method of quantifying lifetime fecundity is by manually counting eggs soon after they are laid. This manual counting is often achieved by visualizing the media surface under a dissecting scope and counting each egg on the surface, often using a grid to keep track of already counted areas and using tools such as a hand-held tally counter to keep an accurate count. Alternatively, the media itself may be digitally imaged or eggs may be washed onto a dark surface and then imaged, with the number of eggs in the image counted by looking at a zoomed in image and tallying each egg. These features limit the ability to quantify lifetime fecundity for large numbers of experimental replicates. Thus, the development of methods that allow the automation of egg counting while maintaining accuracy have the potential to expand the set of biological questions that can be investigated.
As image analysis techniques in general have gotten more sophisticated, there is a growing interest in applying these techniques to different types of biological data.1 There are several challenges associated with applying image analysis methods to fecundity data in D. melanogaster. Female flies lay eggs on the food media, which for most standard recipes2 is close in color to the eggs and does not provide a high contrast background. This challenge has been addressed in the past by providing egg laying media that is higher contrast (e.g., transparent media3 or the addition of charcoal to the media),4 or by washing the eggs off of the surface of the food and filtering them through black filter paper.5–7 Irregularities on the surface of the food, the presence of dust or other particulate matter, and the clumping of many eggs together are all issues that have the potential to affect any automated image analysis. Existing methods for automating egg counting in Drosophila have developed methods to identify individual eggs on the food surface and then quantify the total number present.3,4 While these methods perform well for some applications, their performance declines when eggs are at high densities with a lot of clumping, or when there are many other similarly sized non-egg objects in the image. In addition, because both rely on images of the food surface, for recipes that produce lightly colored food, which may be necessary in studies with a specific diet manipulation, it becomes more difficult to accurately quantify eggs with these methods.
We sought to develop a method for robustly predicting egg counts applicable to a wide range of applications, with a minimal impact of the challenges described above. Our method first produces images with a high contrast between eggs and the background and then takes advantage of the simple relationship between the area of light-colored pixels and the number of eggs present to develop a predictive model that can be applied to a large set of images. This method has the flexibility to be applied to a wide range of egg densities and can be applied to many experimental contexts.
Materials and methods
Fecundity samples
The set of samples used to develop and validate our egg counting method were part of a quantitative genetic study employing a half-sibling, split family design, with families split over three different dietary conditions using flies derived from the Drosophila Synthetic Population Resource, described in detail elsewhere.8 All vials began with 15–24 female flies and six male flies with fecundity estimated once per week over a 24-hour oviposition period for the entire lifetime of the flies. This method generated 3,768 observations. Females were provided with fresh media each Monday and following a 24-hour egg laying period, these egg vials were collected the following Tuesday and stored, unmodified, at −20°C until processing. We continued this process each week until all females within a vial had died. To visualize eggs, we modified a protocol developed by Rose and colleagues.5–7 We added 2.5 ml of bleach (1 volume distilled water/1 volume concentrated regular bleach containing 8.25% sodium hypochlorite, distributed by HY-VEE.INC) to each vial (frozen or thawed) and gently swirled at 20 orbits per minute for about 2 min 50 s on an ORBITRON Rotator 1 (Boekel Scientific, USA) to separate eggs from the media. Eggs were flushed from each vial onto a black filter disc fit into a custom-built vacuum apparatus with a brief spray of embryo solution (12% Triton X-100, SIGMA-ALDRICH, USA) followed by a spray of water to rinse. As a quality check, flask filtrate was re-filtered to a new disc periodically, and processed vials inspected under a dissecting microscope. The filter discs were prepared from black landscape fabric (DEWITT Weed Barrier Pro, www.dewittcompany.com) to a radius of 3.65 cm.
Discs bearing eggs were photographed using a Canon EOS Rebel T5i (Canon Inc., Japan) camera vertically attached to a steel clamp using the following settings: exposure time 1/25 seconds, aperture F5.6, and ISO 100. Egg-bearing discs were mounted on a black stage placed within a cubical photo studio 35cm x 35cm x 35cm constructed with a PVC frame and enclosed by a white fabric. The entire setup was placed in a dark room lit by two facing white light lamps, 23W, 1200 lumens (model # LBP23PAR2/5K, UTILITECH, China) clamped to the stage outside the studio box to allow for soft uniform lighting across the imaging platform. Image files were immediately inspected for quality with ImageJ9 and re-imaged if an image was severely blurry. We manually counted any images that had obvious imaging problems, such as relatively dark images, images with light highlights, or images with a large amount of food debris. These images represent avoidable errors made by the person performing the imaging, represented less than 10% of images, and the frequency of these images occurring decreased during the development and refinement of this method.
Estimation of egg counts
We developed a predictive model to estimate the counts of eggs from the images of the filter discs. Figure 1 gives a graphical overview of our methods for acquiring and processing images (Figure 1a) and the development of the model (Figure 1b) described below. To create the model and assess its performance, eggs on 345 discs were manually counted from the images of the discs using the Multi-point tool in ImageJ9 to generate a training dataset. This tool allows the user to mark each egg in an image by clicking on its position and automatically keeps a tally of the total number marked in an image. We manually counted 22 images twice and showed this manual counting is highly repeatable, with an intraclass correlation of 0.996. To ensure that all possible imaging conditions were available for model training, discs selected for manual egg counting were selected across the whole lifespan of flies and across all three diet treatments. Some background reflectivity of the discs and small debris present meant that some non-zero white area was present in almost all images, so our training set includes an over-representation of images with relatively few eggs, to prevent upward bias in the fecundity predictions.
Figure 1.

Graphical overview of the fecundity prediction method. a) Image acquisition and processing steps. After discs are imaged, they are cropped, thresholded, and the total area of white pixels on each image is calculated. b) Model fitting and optimization steps. The set of hand counted images are split into a train and test set. The train set is used to fit a linear model. This model is then used to predict egg counts in the test set and the resulting average error between the predicted count and manual count for the test set is calculated. This process is repeated 1,000 times for each parameter combination.
Each image was manually cropped to be square at the edges of the disc, and the background outside the disc was set to black to eliminate any reflectivity or debris occurring outside of the disc using GNU Image Manipulation Program.10 This process removed any dust or particles on the background the discs were placed on to be photographed but did not remove any eggs. All eggs were on the discs rather than the background. Subsequently, the image was binarized by thresholding 8-bit grayscale values using the OpenCV package11 in Python12 (v. 3.6; https://github.com/EGKingLab/fecundity_estimation). From this thresholded image, the area of white pixels was summed (https://github.com/EGKingLab/fecundity_estimation). Because images were not all the same size due to slight variations in camera zoom, we included size of the image as a covariate in the linear model predicting egg count from white pixel area and image dimension:
where Area is the sum of the white pixels, Image Size is the linear dimension of one edge of the image in pixels, β0 is the estimated y intercept, and β1 and β2 are the estimated coefficients for and Image Size, respectively. We use because pixel area is predicted to scale as a square of egg count. After this model is fit to any training set and the β’s estimated, a predicted egg count can be calculated from a given white pixel area and image size directly from the equation and β coefficients.
The optimal grayscale threshold value was determined by cross-validation13 using R14 (v. 3.5 https://github.com/EGKingLab/fecundity_estimation). We tested threshold grayscale values between 30 and 150 (for 8-bit images with 256 grayscale levels), across a range of training/testing data splits (0.5 to 0.9) and a range of proportions of data (0.5 to 1.0). Thresholding will convert each pixel to be black or white, and different threshold values will determine how a pixel of a given brightness will be counted. Thus, at high threshold values, more pixels will be converted to black, eliminating background noise but at extreme values, also eliminating real eggs. Conversely, low threshold values will overestimate egg counts.
In cross-validation, a dataset is split into training and test sets. The training set is a portion of the data used to create the predictive model. In this case, the training set is used to fit the linear model described above. The test set is used to assess the ability of the model to predict new data (i.e., data not included to produce the predictive model). In this case, the model fit with the training set would produce a set of predicted egg counts for the test set from white area and image size. That predicted count is compared to the manual count to quantify the error in prediction for the test set. We also varied the proportion of the total set of manually-counted images we used to develop the model in order to test whether we were using a large enough set of manually counted images to appropriately train the model. Each model was fit 1,000 times at each combination of threshold, train/test split, and data proportion, with the root mean squared difference between predicted count and manual count (RMSd) retained for each iteration (https://github.com/EGKingLab/fecundity_estimation). The optimal set of parameters was determined from the mean RMSd of these 1,000 iterations (Figure 2). The optimal threshold was a grayscale value of 53 for the training set, using 90% of the data each iteration for training, and only required using 50% of the total data in any one iteration. The resulting predictive model performed well for our training set (Figure 3a). The trained model was then used to predict egg counts for all 3,768 images that were part of this dataset (Figure 3b). Images with negative predicted egg counts were set to 0. Egg counts in our hand counted dataset ranged from 0–2073, and ranged from 0–1556 in our predicted set. The pattern of fecundity in each diet over time is discussed in detail in Ng’oma et al.8 All images were also visually inspected, and those determined to be of poor quality, with excessive background reflectivity, were counted manually and were not included in the training or prediction set.
Figure 2.
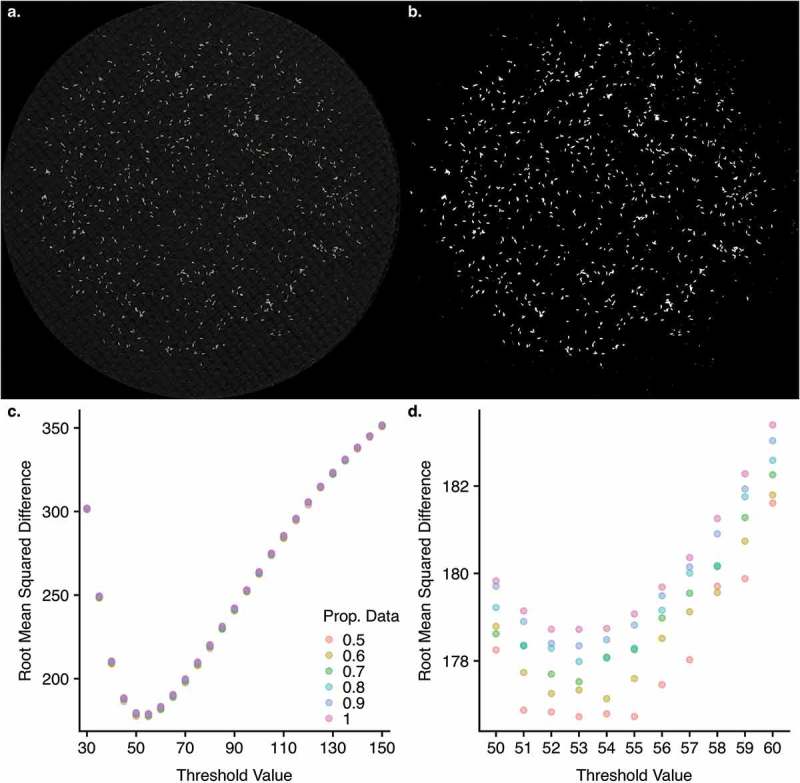
Performance of the model predicting egg counts from images. a) A representative raw image of eggs separated from fly media and filtered onto black filter fabric. b) The same image thresholded at the optimal threshold level identified by the model. Due to the time required for optimization of threshold value, we carried this process out in two steps. c) Coarse optimization was carried out for every 5 grayscale values between 30 and 150, which revealed a single minimum in that range, falling between 50 and 60. d) Fine optimization was then carried for integer values between 50 and 60, resulting in a single optimal value of 53. Colors represent the proportion of data used for each model fit. Even at the optimal value, the difference in minimum (at 50% of data) and maximum (at 100% of data) in root mean squared difference was ~2 eggs.
Figure 3.

The performance of the optimized predictive model. a) The square root of image area is on the x-axis and the egg count is on the y-axis. Manually counted values are shown in red and the predicted values from the model are shown in blue. Pairs of values (manually counted and predicted) for individual images are connected by a red line. b) Distribution of predicted values for all images in the data set. Inflated zero counts results from assigning a value of 0 to any predicted values <0.
Data and software availability
Our raw data, including our fecundity estimates, and all egg image files, have been uploaded to Zenodo and may be retrieved at http://doi.org/10.5281/zenodo.1285237. All scripts to reproduce all of our analyses are available at GitHub: https://github.com/EGKingLab/fecundity_estimation. Code is available to directly download egg image files from Zenodo and reproduce our analyses.
Results
We developed a high throughput method for obtaining egg counts by creating a predictive model to obtain estimated egg counts from images of eggs that were washed off the food surface and filtered onto a dark fabric disc by exploiting the simple linear relationship between the number of eggs present and the amount of white area on a thresholded image of a disc containing D. melanogaster eggs (Figure 2a). We used a set of manually counted images to optimize the model and show that it performs well (Figure 3a).
We tested several parameters to produce an optimal prediction model. First, by using different proportions of our total dataset of manually counted images, we showed our manually counted set was sufficiently large to train the predictive model and achieve a high predictive ability. Using only 50% of the manually counted data, we achieved similar error rates in the resulting model, demonstrating our dataset was sufficiently large to saturate the model (Figure 2c, d). We also tested a range of thresholds to identify the value that would remove the most background noise without obscuring actual eggs (Figure 2c, d). To assess the robusticity of our model across different parameters, we employed cross-validation to ensure we tested the ability of the model to predict egg counts for the test set (i.e., data not included to produce the predictive model). For each iteration, 90% of the data was used to train the model and we assessed the ability of this model to predict the values of the remaining 10% of the data. Our best performing model was able to predict the test set (i.e., data not included to produce the predictive model) well, with a mean absolute error of ~177 eggs and a high correlation (r = 0.89) between the predicted egg count and the manual egg counts. We note that with a 24-hour egg laying period for a vial with several females, this error rate, with predicted counts deviating from manual counts by an average of 177 eggs, represents a relatively small number of eggs. After identifying the optimal threshold value, we fit a model using our full dataset and found similar error rates when comparing the predicted values from this model to the manually counted images (r = 0.88, mean absolute error = 128 eggs; Figure 3a). We were then able to use this model to predict egg counts for our entire dataset of 3,768 images (Figure 3b).
Discussion
The method of washing eggs from the surface of the food onto black filter paper has been used previously in studies quantifying fecundity in D. melanogaster.5–7 While this is more time consuming than imaging the surface of the food directly, this approach has several advantages. First, removing eggs from the surface of the food typically results in less clumped eggs and removes surface irregularities such as bubbles in the food. Second, it allows for eggs to be imaged on a high contrast background no matter what food recipe is used. This feature is particularly important when diet is a manipulated variable in an experiment and/or it is undesirable to add charcoal or some other darkening agent to the food. Finally, any imaging (including on the food surface) provides a permanent record of the phenotype while manually counting and discarding vials does not allow for validation of the phenotyping or later error checking. In previous work using this method, eggs washed onto black filter paper were still manually counted. Here, we have shown how this process can be automated, providing a significant time saving, e.g., avoiding manual counts of ~84,000 eggs in this study.
Other automated egg counting methods rely on identifying individual objects in an image as eggs, including those of Waithe et al.3 and Nouhaud et al.4 For both methods, performance declines when egg densities are high and multiple eggs clump together. A major advantage of the method we have developed is the ability to handle a wide range of densities because the egg count is estimated directly from the area of white pixels, removing the need to identify eggs as individual objects. Waithe et al.3 developed a machine learning method implemented as a software tool called QuantiFly. They use cross-validation and manually counted images to assess the correspondence between their model’s predicted counts and manual counts of images in their test set, in much the same way we have assessed our model’s performance. Their method’s performance, as measured by the correlation between the predicted count and the manual digital count, exceeds ours (r > 0.95) when densities are low (<100 eggs per vial) but is worse than ours (r < 0.75) when densities are high (~200–400 per vial). Nouhaud et al.4 use an image-J plug-in to count objects in images of eggs on a high contrast food surface. They then use a custom R script to subset identified objects in the correct size range to be categorized as eggs. Similar to Waithe et al.3 the performance of their method declines with increasing egg density. The performance of their method within their dataset is high with a high correlation between counts from predicted and manually counted images (r > 0.93), however no estimate of the method’s ability to predict out of sample (e.g., for images that were not included in the original set used to set the specific parameters) is given, making it difficult to directly compare the performance of this method to the one described here.
Several challenges remain for the development of automated assays of reproductive output in Drosophila. There are several potential sources of error for our method, and for similar methods that have been developed. First, for all methods, there is some error associated with manually counting eggs, which limits the accuracy of the “ground truth” data to validate any model for automated counts. With careful manual counting from a digital image, this source of error can be minimized to near zero but likely never fully eliminated. Second, as noted above, high egg densities are problematic for methods that rely on identifying individual eggs.3,4 While our method is better able to deal with this issue because it relies only on the area of white pixels, our method is susceptible to debris on the filter paper surface (e.g., food particles, etc.), because any lightly colored object will be included in the total thresholded area. We included a large number of low egg count discs to help calibrate the average amount of background debris on our discs. Nevertheless, it is important when applying this method to make sure minimal amounts of debris are present. This may be achieved either by careful egg-washing and/or pre-cleaning discs before imaging (and recording eggs that lie on the debris being removed). Eliminating all debris is not feasible, so this source or error will always limit the predictive ability of the approach described here. Future technological developments that could remove eggs from debris during the separation process, or the development of an image analysis that could distinguish all eggs from other debris would improve the ability to estimate egg counts and move the field closer to the ultimate goal of near perfect automated egg counts.
Lastly, fecundity, like all fitness proxies, is an imperfect measure of fitness. In some cases, a better measure would be the number of adult offspring produced by a female, which would require allowing the eggs laid to develop to adulthood. Of course, the successful development of an egg will likely depend on the rearing conditions of the lab and the specific conditions in the vial, thus this measure of fitness will not necessarily generalize to other situations. In general, obtaining comprehensive measures of fitness is extremely challenging.15 However, this challenge could also be eased by employing automated image analysis to count adult flies in much the same way as the method described here.
Overall, we present an approach to automating egg counting that can be optimized and tailored to a wide variety of situations and applications. We use a cross-validation, train/test approach to identify the model parameters that allow us to optimally predict new egg count values. The cross-validation approach shows a high correspondence between predicted and manually counted egg counts for the test set (i.e., data not included to produce the predictive model), showing our high performance is not inflated due to overfitting to our manually counted set. This approach could potentially be applied to any images with enough contrast to threshold the background from the objects of interest and may be especially applicable to situations where it is challenging to separate individual objects.
Funding Statement
This work was supported by NIH grant R01 GM117135 to Elizabeth G. King, The University of Missouri, and a University of Missouri Research Board Grant.
Declaration of Potential Conflict of Interest
Authors declare there are no material or financial interests relating to the work described in this paper.
Acknowledgments
Larry Cabral provided with valuable ideas through personal communication to establish our fecundity protocol. Elizabeth Lopresti, Michael Reed, Osvaldo Enriquez, Anna Perinchery, and Kyla Winford helped with fly husbandry, time-intensive experimental set-ups, collection and entry of data.
References
- 1.Nketia TA, Sailem H, Rohde G, Machiraju R, Rittscher J.. Analysis of live cell images: methods, tools and opportunities. Methods. 2017;115:65–79. doi: 10.1016/j.ymeth.2017.02.007. [DOI] [PubMed] [Google Scholar]
- 2.Bloomington Drosophila Stock Center Fly food recipes [Internet]. 2017. [accessed 2018 August1] https://bdsc.indiana.edu/information/recipes/index.html.
- 3.Waithe D, Rennert P, Brostow G, Piper MDW. QuantiFly: robust trainable software for automated drosophila egg counting. PLoS One. 2015;10:e0127659. doi: 10.1371/journal.pone.0127659. [DOI] [PMC free article] [PubMed] [Google Scholar]
- 4.Nouhaud P, Mallard F, Poupardin R, Barghi N, Schlötterer C. High-throughput fecundity measurements in Drosophila. Sci Rep [Internet]. 2018. [accessed 2018 July25]; 8 https://www.ncbi.nlm.nih.gov/pmc/articles/PMC5849729/. [DOI] [PMC free article] [PubMed] [Google Scholar]
- 5.Rose Lab Data . Fecundity: animated Introduction [Internet]. 2012. https://www.youtube.com/watch?v=xrEBNB8bUwo&sns=em.
- 6.Rose Lab Data Fecundity: live Demonstration [Internet]. 2012. https://www.youtube.com/watch?v=uqFZ4ZTC6ZY&sns=em.
- 7.Burke MK, Barter TT, Cabral LG, Kezos JN, Phillips MA, Rutledge GA, Phung KH, Chen RH, Nguyen HD, Mueller LD, et al. Rapid divergence and convergence of life-history in experimentally evolved Drosophila melanogaster. Evolution. 2016;70:2085–2098. doi: 10.1111/evo.13006. [DOI] [PubMed] [Google Scholar]
- 8.Ng’oma E, Fidelis W, Middleton K, King EG. The evolutionary potential of diet-dependent effects on lifespan and fecundity in a multi-parental population of Drosophila melanogaster. Heredity. 2018. doi: 10.1038/s41437-018-0154-2. [DOI] [PMC free article] [PubMed] [Google Scholar]
- 9.Rueden CT, Schindelin J, Hiner MC, DeZonia BE, Walter AE, Arena ET, Eliceiri KW. ImageJ2: imageJ for the next generation of scientific image data. BMC Bioinfo. 2017;18:529. doi: 10.1186/s12859-017-1934-z. [DOI] [PMC free article] [PubMed] [Google Scholar]
- 10.The GIMP Team GNU image manipulation program [Internet]. 2015. http://www.gimp.org.
- 11.Bradski G. The OpenCV Library. Dr Dobb’s J Software Tools. 2000. [Google Scholar]
- 12.Python Software Foundation Python language reference [Internet]. http://www.python.org/.
- 13.James G, Witten D, Hastie T, Tibshirani R, eds. An introduction to statistical learning: with applications in R. New York: Springer; 2013. [Google Scholar]
- 14.R Core Team R: A language and environment for statistical computing. R Foundation for Statistical Computing [Internet]. Vienna (Austria) 2018. http://www.R-project.org/. [Google Scholar]
- 15.Chippindale AK, Gibson JR, Rice WR. Negative genetic correlation for adult fitness between sexes reveals ontogenetic conflict in Drosophila. Pnas. 2001;98:1671–1675. doi: 10.1073/pnas.98.4.1671. [DOI] [PMC free article] [PubMed] [Google Scholar]
Associated Data
This section collects any data citations, data availability statements, or supplementary materials included in this article.
Data Availability Statement
Our raw data, including our fecundity estimates, and all egg image files, have been uploaded to Zenodo and may be retrieved at http://doi.org/10.5281/zenodo.1285237. All scripts to reproduce all of our analyses are available at GitHub: https://github.com/EGKingLab/fecundity_estimation. Code is available to directly download egg image files from Zenodo and reproduce our analyses.