

Abstract
Objective
To investigate the contribution of Alzheimer disease (AD) vs non-AD neuropathologies to hippocampal atrophy.
Methods
The Religious Orders Study and Rush Memory and Aging Project are clinicopathologic cohort studies of aging. The current study included 547 participants who had undergone brain autopsy and postmortem hippocampal volume measurement by November 1, 2018. Hippocampal volume was measured with postmortem MRI via a 3D region of interest applied to the hippocampal formation. Neuropathologies were measured via uniform structured evaluations. Linear regression analyses estimated the proportion of variance of hippocampal volume attributable to AD and non-AD neuropathologies.
Results
The average age at death was 90 years, and the average hippocampal volume was 2.1 mL. AD, transactive response DNA-binding protein 43 (TDP), hippocampal sclerosis (HS), and atherosclerosis were associated with hippocampal volume. After demographics and total hemisphere volume were controlled for, 7.0% of the variance (95% bootstrapped confidence interval [CI] 4.3%–10.5%) of hippocampal volume was attributable to AD pathology. TDP/HS explained an additional 4.5% (95% CI 2.2%–7.6%). Among individuals with Alzheimer dementia (n = 232), 3.1% (95% CI 0.6%–7.7%) of the variance was attributable to AD pathology, and TDP/HS explained an additional 6.1% (95% CI 2.2%–11.6%). Among those without Alzheimer dementia (n = 307), 3.2% (95% CI 0.9%–7.3%) of the variance was attributable to AD pathology, and TDP/HS explained an additional 1.1%, which did not reach statistical significance. Lewy bodies and vascular diseases had modest contribution to the variance of hippocampal volume.
Conclusions
Both AD and TDP/HS contribute to hippocampal volume loss in older-old persons, with TDP/HS more strongly associated with hippocampal volume than AD in Alzheimer dementia.
Converging evidence has shown that Alzheimer disease (AD) is implicated in hippocampal neuronal loss and atrophy.1 β-Amyloid and paired helical filament (PHF) tau tangles, the 2 defining neuropathologic features of AD, contribute to hippocampal atrophy.2–4 In addition, a significant overlap exists between common genetic risk variants for hippocampal volume and those for Alzheimer dementia.4 APOE, the strongest risk loci for late-onset AD, affects hippocampal volume such that ε4 carriers tend to have accelerated hippocampal atrophy.5 Clinically, hippocampal atrophy is associated with increased risks for incident cognitive impairment, incident Alzheimer dementia, and a faster rate of memory decline.6
Built on these strong associations, the use of structural MRI measures of hippocampal atrophy as surrogate biomarkers or diagnostic tools for identifying persons with AD or at risk of the disease has been proposed.7,8 However, hippocampal atrophy is not specific to AD, and the region is vulnerable to other neurodegenerative or cerebrovascular conditions that are common in aging.9–12 We are not aware of prior studies that have systematically assessed the extent to which AD vs other common non-AD neuropathologies contributes to hippocampal atrophy. Of particular interest is the contribution of hyperphosphorylated transactive response DNA-binding protein 43 (TDP) and hippocampal sclerosis (HS) pathologies, which have previously been implicated in hippocampal degeneration. Both pathologies are mesial temporal predominant and known to be associated with amnestic disorders.
In this study, we interrogated AD and 8 other common age-related neuropathologic indices (i.e., TDP, HS, Lewy bodies, macroscopic infarcts, microinfarcts, cerebral amyloid angiopathy, atherosclerosis, and arteriolosclerosis) in relation to hippocampal volume. After identifying neuropathologic indices that were associated with hippocampal volume, we quantified the proportions of variance of hippocampal volume attributable to individual neuropathologic indices and compared them with that of AD.
Methods
Study participants
Data came from 2 ongoing cohort studies of aging that are run out of the Rush Alzheimer's Disease Center, the Religious Orders Study and Rush Memory and Aging Project (ROSMAP).13 In support of integrated combined analyses, the 2 studies share nearly identical design, operations, protocols, and staff. All participants enroll without known dementia and agree to annual clinical evaluations and brain donation after death.
At the time of the analyses on November 1, 2018, a total of 3,485 ROSMAP participants have enrolled and completed a baseline evaluation; of these, 1,804 had died and 1,569 had undergone brain autopsy with an autopsy rate of 87%. Postmortem hippocampal volume measure was available in 552 of 1,539 individuals who had neuropathology assessment approved by a board-certified neuropathologist. Primary analyses were conducted in 547 individuals after the exclusion of 5 cases with incomplete neuropathology data.
Clinical diagnosis of Alzheimer dementia
Annual clinical evaluations included medical history, an in-person neurologic examination, and comprehensive cognitive performance testing. After a review of relevant clinical information from the annual evaluation, an experienced clinician provides a judgment for each participant regarding the presence of dementia and its likely etiology. The general diagnosis of dementia requires a history of cognitive decline with impairment in at least 2 cognitive domains. The more specific diagnosis of Alzheimer dementia requires a history of cognitive decline with impairment in memory and at least 1 other cognitive domain. After a participant died, all available clinical data were reviewed by a neurologist with expertise in dementia, and a final summary diagnostic opinion was provided blinded to the postmortem pathology and imaging data. The final summary diagnosis of Alzheimer dementia was used in the stratified analysis.
Postmortem MRI acquisition and hippocampal volume measure
Postmortem MRI acquisition methods have been previously described.14,15 The brain was hemisected at autopsy, and the hemisphere with visible gross pathology was selected for MRI and neuropathologic evaluation. Hemispheres were immersed in 4% paraformaldehyde solution at 4°C. MRI was conducted on average 1 month postmortem after the specimen was warmed to room temperature. Scans occurred over a period of 12 years, and during that time, we used 4 different MRI scanners, each with a nominal field strength of 3T. For all 4 scanners, the protocol included a multiecho fast spin-echo sequence with resolution of 1.5 × 0.625 × 0.625 mm3 and a scan time of ≈30 minutes.
We created a template from postmortem MRI scans of 30 of the cerebral hemispheres.15 Briefly, the slice order of left hemispheres was first reversed to appear as right. We then carried out an initial rigid-body registration (i.e., rotation and translation only, no deformations) of 29 hemispheres to the remaining 1 hemisphere using the FSL flirt tool.16 We averaged those images together to form an intermediate average. This intermediate average image served as a target for high-dimensional spatial registration of all 30 original images with the Automated Registration Toolbox.17 A new average image was created, and the process was repeated until there was no further change in the resulting average, which became the template.18 We manually drew a hippocampal mask on the template by outlining the hippocampal formation on successive slices.19 We also created a whole-hemisphere mask by thresholding the template image so as to exclude nontissue voxels.
We used the Automated Registration Toolbox to warp each of the 547 images to the template. We then inverted these deformations and applied them to the hippocampal and whole-hemisphere masks. This warping captures local expansion or contraction of the image of each specimen relative to the template, meaning that the masks may appear larger or smaller once they have been warped to the space of each individual specimen. Thus, the volumes of the warped masks (number of voxels included in each mask multiplied by the voxel volume) can serve as estimates of whole-hemisphere and hippocampal volume. The automated results were visually inspected (figure 1). Because the MRI scans in this study were obtained with 4 scanners, both hemisphere and hippocampal volumes were standardized within each group of hemispheres imaged on a given MRI scanner.
Figure 1. Automated hippocampal segmentations.

Representative hippocampal segmentations (red) resulting from the automated technique used in this work are shown. Gray-scale backgrounds are sagittal slices of the shortest echo-time images from the fast spin-echo sequence. Left column contains 3 separate cases, each of which had hippocampal volumes below the 10th percentile; the middle column contains 3 cases at or near the median; and the right column contains 3 cases at or above the 90th percentile.
Neuropathology measures
Neuropathologic dissection and sampling were performed immediately after the postmortem MRI scans. The same hemisphere was cut into 1-cm slabs for a uniform structured neuropathologic evaluation, which assesses burdens of AD and other common neuropathologies.20 Multiple AD pathology measures were collected. A modified Bielschowsky silver stain protocol was used for National Institute on Aging (NIA)–Reagan pathologic diagnosis of AD. Molecule-specific measures of β-amyloid and PHFtau tangles were quantified with immunohistochemistry in 8 regions. Briefly, 6-μm sections were immunostained for β-amyloid (4G8; 1:9,000; Covance Laboratories, Madison, WI; dilution, 6F/3D; 1:50, Dako North America Inc, Carpinteria, CA; and 10D5; 1:600, Elan Pharmaceuticals, San Francisco, CA) and phosphorylated tau (AT8; 1:2,000, Thermo Fisher Scientific, Rockford, IL). Amyloid load (percentage area positive for β-amyloid) was determined by image analysis of amyloid immunostained sections and stereologic sampling, and PHFtau tangle density per 1 mm2 was determined from phosphorylated tau immunostained sections and stereologic sampling. Because both measures were right skewed, they were square root transformed and averaged across regions to obtain mean amyloid load and tangle density.
Other non-AD neurodegeneration was assessed. The presence of Lewy bodies in amygdala, substantia nigra, limbic, or neocortical regions was identified with antibodies to α-synuclein. TDP pathology was performed on 6-μm sections immunostained with antibodies to a phosphorylated monoclonal TAR5P-1D3 (pS409/410; 1:100, Ascenion, Munich, Germany). Severity was assessed with a semiquantitative score, with 0 = no inclusion, 1 = inclusion limited to amygdala, 2 = inclusion extended to other limbic regions, and 3 = inclusion extended to neocortical regions. HS, the presence of severe neuronal loss and gliosis in CA1 and/or subiculum, was visualized on 6-μm sections of the mid-hippocampus stained with hematoxylin & eosin.
Measures of cerebrovascular conditions include old macroscopic and microinfarcts, amyloid angiopathy, atherosclerosis, and arteriolosclerosis. Macroscopic infarcts were identified during gross examination of both hemispheres and confirmed histologically. The presence of microinfarcts was determined on 6-μm hematoxylin & eosin–stained sections from a minimum of 9 regions. Meningeal and parenchymal vessels in 4 neocortical regions were assessed for amyloid angiopathy. For each region, 6-μm sections were immunostained with antibodies to β-amyloid, and amyloid deposition was scored. Scores were then averaged across the regions and summarized into a 4-level severity rating of none, mild, moderate, or severe. Anterior, middle, and posterior cerebral arteries of the circle of Willis were visually examined for atherosclerosis, and small vessels of the anterior basal ganglia were assessed for arteriolosclerosis. The severity of atherosclerosis and arteriolosclerosis was also graded on the 4-level scale (none, mild, moderate, or severe).
Statistical analysis
A multivariable linear regression model was used to identify neuropathology measures that are associated with hippocampal volume. In this model, postmortem hippocampal volume was the continuous outcome, and the predictors included AD pathologic indices of amyloid load and tangle density, macroscopic infarcts and microinfarcts, Lewy bodies, TDP, HS, amyloid angiopathy, atherosclerosis, and arteriolosclerosis. We adjusted for age, sex, education, and total hemisphere volume. Neuropathologies shown to have significant associations were selected for further examination of their contributions to postmortem hippocampal volume.
We chose R2 to quantify the contribution of neuropathologies to hippocampal volume. In linear regression, R2 can be interpreted as the proportion of variance of a continuous outcome that is explained by model predictors. We fit a series of linear regression models with hippocampal volume as the outcome. The reference model included terms for demographics and total hemisphere volume. We added AD pathologies of amyloid load and tangle density to the reference model. Notably, the difference in R2 between these 2 nested models captured the contribution due to AD. Next, we augmented the model by including a term for non-AD neuropathology. Similarly, the difference in R2 between the last 2 models captured the contribution due to the non-AD neuropathology above and beyond AD. We repeated the analysis for each of the non-AD neuropathologies associated with hippocampal volume.
The statistical inference for the R2 statistic was derived from bootstrapping. Briefly, 10,000 datasets, each with a sample size of 547, were randomly generated by sampling with replacement cases from the original dataset, and we repeated the regression analyses and estimated the R2 10,000 times. The 95% confidence intervals (CIs) for the R2 statistics were obtained by taking the 2.5 and 97.5 percentiles of the corresponding sampling distributions. In all the analyses, we used adjusted R2 to account for the inflation due to an increase in the number of predictors. Regression models were fit by use of SAS/STAT version 9.4 (SAS Institute, Cary, NC), and statistical significance was determined at nominal level of p < 0.05.
Standard protocol approvals, registrations, and patient consents
The studies were approved by institutional review board of the Rush University Medical Center, and each participant provided written informed consent and the Anatomical Gift Act.
Data availability
Data used in this work are available by request via the Rush Alzheimer's Disease Center Research Resource Sharing Hub (radc.rush.edu).
Results
Characteristics of the study participants
The study included a total of 547 autopsied ROSMAP participants (table 1). The average age at death was 90.4 years (SD 6.0 years), and average education was 15.8 years (SD 3.6 years). Of the 547, 71.1% (n = 389) were female, and >95% were non-Latino whites. The average hippocampal volume was 2.1 mL (SD 0.4 mL). At death, 232 (42.4%) were diagnosed with Alzheimer dementia, and 375 (68.6%) met NIA-Reagan criteria for pathologic diagnosis of AD. We found that 84.5% of the individuals with Alzheimer dementia, separately 56.0% of the individuals without Alzheimer dementia, had pathologic diagnosis of AD. Mixed pathologies were common (figure 2), and nearly 80% of the participants had multiple neuropathologies at autopsy. In particular, AD rarely occurred in isolation. Of the participants diagnosed with pathologic AD (n = 375), only 8.5% had pure AD without other comorbid conditions.
Table 1.
Characteristics of study participants


Figure 2. Pattern of mixed pathologies in older persons.
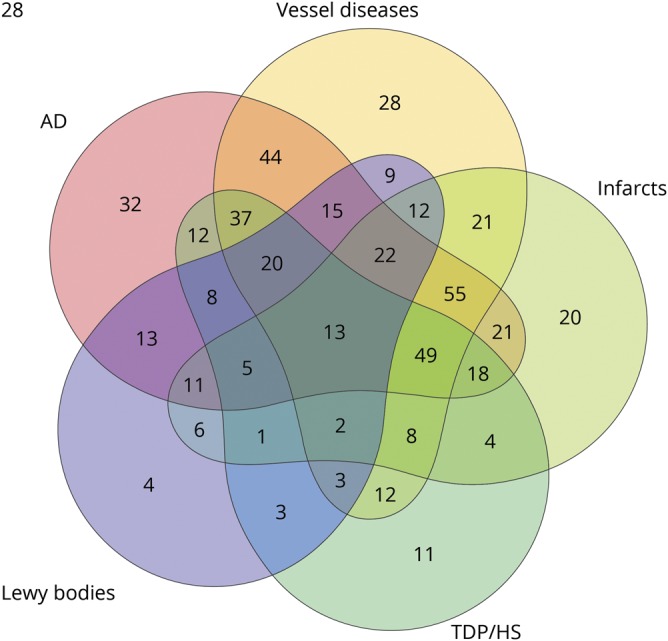
Venn diagram illustrates the concomitant occurrence of pathologic Alzheimer disease (AD) diagnosis according to modified National Institute on Aging–Reagan criteria, chronic macroscopic or microinfarcts, vessel diseases (moderate or severe amyloid angiopathy, atherosclerosis or arteriolosclerosis), Lewy bodies, and transactive response DNA-binding protein 43/hippocampal sclerosis (TDP/HS; TDP inclusion extended beyond the amygdala or presence of HS). Each number in the Venn diagram represents the number of cases with a unique combination of these neuropathologic conditions. The numbers in intersections represent the number of cases with multiple conditions. The shape of the circles is chosen by the R program to best accommodate all possible combinations.
Neuropathologies and postmortem hippocampal volume
We examined the associations of common neuropathologies with hippocampal volume in a single linear regression model adjusted for demographics and total hemisphere volume (table 2 and model 1). AD pathology was associated with smaller hippocampal volume. The association of amyloid load was not significant with tangle density included in the model, suggesting that PHFtau tangles are downstream of β-amyloid in the pathway connecting AD and the atrophic process. In addition to AD, other neurodegenerative conditions, including TDP and HS, were associated with smaller hippocampal volume. The association of Lewy bodies did not reach the cutoff for statistical significance. Furthermore, of the 4 vascular pathologies examined in the study, only atherosclerosis was associated with smaller hippocampal volume.
Table 2.
Association of neuropathologies with hippocampal volume

Because neuropathologies were measured in different scales, with some having greater precision than others, we dichotomized the continuous and semiquantitative neuropathologic measures and re-examined their associations with hippocampal volume. The results were overall consistent (table 2 and model 2).
Hippocampal volumes between different pathology groups were compared. We focused on 3 conditions that were significantly associated with hippocampal volume (i.e., AD, TDP/HS, and vessel diseases), which gives a total of 8 different groups. Figure 3 illustrates hippocampal volume for the individual groups. For comparison, we conducted analyses of covariance with 3 main effects representing each of the 3 pathologic conditions, as well as three 2-way interactions (i.e., AD by TDP/HS, AD by vessel diseases, TDP/HS by vessel diseases) and one 3-way interaction (AD by TDP/HS by vessel diseases). None of the interactions between the pathologic conditions were significant (all p > 0.1), suggesting that their effects on hippocampal volume are additive rather than synergistic.
Figure 3. Hippocampal volume (standardized) for individuals with different combinations of 3 pathologic conditions.
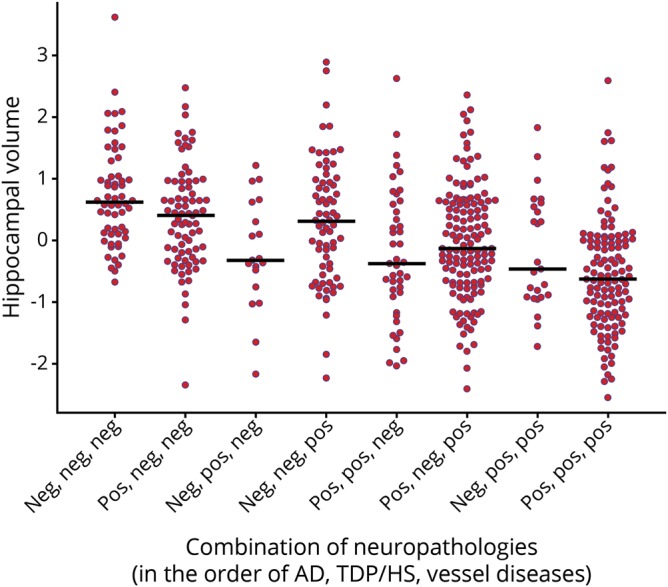
The 3 neuropathologic conditions shown are (1) pathologic diagnosis of Alzheimer disease (AD) according to modified National Institute on Aging–Reagan criteria; (2) transactive response DNA-binding protein 43/hippocampal sclerosis (TDP/HS), defined as TDP inclusion that was extended beyond the amygdala or the presence of HS; and (3) vessel diseases, defined as moderate to severe amyloid angiopathy, atherosclerosis, or arteriolosclerosis. Each dot represents an individual, and the horizontal bars represent the median hippocampal volume of each group.
A sensitivity analysis was conducted to control for both time interval between death and tissue preservation and time interval between death and postmortem imaging. We found no significant effect of postmortem intervals on hippocampal volume (both p > 0.05), and the associations of common neuropathologies with hippocampal volume were essentially unchanged. This is consistent with our previous work that shows no discernible increase or decrease in the volumes of subcortical regions (i.e., including the hippocampus) over a span of ≈6 months postmortem.21
The genetic risk factor of APOE ε4 is implicated in multiple neuropathologies and hippocampal volume. We examined the role of APOE ε4 in the neuropathologic associations with hippocampal volume. The ε4 allele was associated with smaller hippocampal volume (β = −0.227, standard error 0.069, p = 0.001), but this association was attenuated and no longer significant after neuropathologies were added to the model (p = 0.915). Because APOE ε4 is upstream of neuropathologies with its association mediated primarily by neuropathologies, we conclude that it has little impact on hippocampal volume loss.
Contributions of AD vs non-AD pathologies to hippocampal volume
We estimated the contribution of AD, TDP, HS, and atherosclerosis to hippocampal volume by comparing the adjusted R2 (table 3). Age, sex, education, and hemisphere volume explained >48% of the variance of hippocampal volume (adjusted R2 = 0.483, 95% bootstrap CI 0.420–0.548). The R2 increased by 0.070 (95% bootstrap CI 0.043–0.105) after amyloid load and tangle density were added to the model, suggesting that AD alone explained 7% of the variance above and beyond demographics and hemisphere volume (table 3 and model 2).
Table 3.
Adjusted R2 of hippocampal volume due to neuropathologies

Next, we augmented the model by including terms for TDP stage and subsequently HS. The inclusion of TDP stage increased the R2 by 0.026 (95% bootstrapped CI 0.010–0.048), suggesting that TDP alone explained ≈3% of the variance of hippocampal volume. After HS was added, the R2 further increased by another 0.019 (95% bootstrapped CI 0.005–0.040) such that HS contributed an additional 2% to the variance of hippocampal volume. Our prior work and work from others show that almost all participants with HS had TDP pathology22 and that TDP is likely pathogenically upstream of HS.23,24 Furthermore, in a recent consensus working group report, both TDP and HS are proposed as key features of a single neuropathologic entity called limbic-predominant age-related TDP-43 encephalopathy.25 Therefore, we focused on assessing the combined contribution of TDP and HS (TDP/HS). With TDP and HS included in the model (table 3 and model 3), the R2 increased by 0.045 (95% bootstrapped CI 0.022–0.076). Notably, this increase in R2 was above and beyond the effect of AD and was comparable to AD in terms of magnitude. Finally, the model for atherosclerosis (table 3 and model 4) showed only a minimal increase in R2 above and beyond the effect of AD and was not significant based on bootstrapped confidence interval.
We repeated the analyses by replacing continuous measures of amyloid load and PHFtau tangles density with 2 semiquantitative staging measures, that is, the Consortium to Establish a Registry for Alzheimer's Disease (CERAD)26 score for neuritic plaques and the Braak score27 for neurofibrillary tangles. The CERAD and Braak scores together explained 3.4% of the variance of hippocampal volume, and TDP/HS explained an additional 5.6%. This result further strengthened our finding that both AD and TDP/HS contribute to hippocampal volume loss in old age.
Contributions of neuropathologies to hippocampal volume in Alzheimer dementia
Neuropathologic burden differs between persons with and without Alzheimer dementia. Furthermore, hippocampal atrophy is thought to provide evidence of a likely etiology of dementia and is often used to support a diagnosis of Alzheimer dementia. Therefore, we assessed the relative contribution of TDP/HS to hippocampal volume by Alzheimer dementia status. Among participants with Alzheimer dementia (n = 232), ≈3% of the variance of hippocampal volume was explained by AD (increase in R2 0.031, 95% bootstrapped CI 0.006–0.077), and TDP/HS explained an additional 6% (increase in R2 0.061, 95% bootstrapped CI 0.022–0.116), double the variance explained by AD alone. In contrast, among participants without Alzheimer dementia (n = 307), AD explained 3.2% of the variance of hippocampal volume (increase in R2 0.032, 95% bootstrapped CI 0.009–0.073), and TDP/HS contributed to a smaller proportion and was not significant (increase in R2 0.011, 95% bootstrapped CI −0.002 to 0.046).
Discussion
Substantial neuronal loss and atrophy are observed in the hippocampi of older adults with AD pathology, and structural MRI measures of hippocampal atrophy have been used as surrogate biomarkers for the disease. More recent studies, recognizing the lack of specificity of hippocampal volume loss, suggest this measure as an indicator of disease progression in persons with amyloid-positive PET scans.28 In this study, we investigated the associations of common age-related neuropathologies with hippocampal volume as measured by postmortem MRI and quantified the variance of hippocampal volume explained by non-AD neuropathologies above and beyond AD. We are specifically interested in the contribution of TDP/HS because these pathologies are observed predominantly in mesial temporal regions and share similar amnestic syndromes with AD. Several observations are highlighted that provide further understanding of neuropathologic basis of structural MRI changes in hippocampi.
First, we reconfirm that hippocampal atrophy is nonspecific to AD and is implicated in other non-AD neuropathologic conditions. Data from a number of genetic and clinicopathologic studies have provided strong evidence that AD leads to hippocampal volume loss. However, studies have also shown the relationship of hippocampal volume with other pathologies even in the presence of AD.9 Several challenges remain in evaluating structural MRI measures of hippocampal atrophy in the context of AD, and these have not been adequately addressed in the prior literature. Most studies that examined the effect of AD on hippocampal atrophy did not account for other concomitant neuropathologies. It is now widely recognized that AD rarely occurs in isolation in the aging brain, and a majority of older persons have mixed pathologies at autopsy. Indeed, data from this study show that >90% of all pathologically diagnosed AD cases had at least 1 coexisting non-AD neuropathology. In the assessment of a potential AD biomarker, it is important to disentangle the effect of non-AD neuropathologies from that of AD, and failure to do so may lead to biased conclusions. Hippocampal atrophy has been reported in vascular and Lewy body dementia.29,30 Yet, many of these studies rely on clinical data, and the extent to which these associations are attributable to coexisting AD pathology could not be determined. In this study, we interrogated a total of 9 neuropathologies (4 neurodegenerative and 5 vascular) in the same regression model. Three of 4 neurodegenerative pathologies but only 1 of 5 vascular pathologies was independently associated with hippocampal volume. Furthermore, our results suggest that the contribution of Lewy bodies and vascular diseases to hippocampal atrophy is modest.
Separately, many studies tend to rely on the strength of an association as a metric for prediction. There is little research on predictive performance of hippocampal volume measures in detecting AD, and results have been inconsistent. Using postmortem data from 56 nuns, an early study reported that postmortem hippocampal volume is able to predict autopsy-confirmed AD with high sensitivity and specificity.8 Another study concluded that MRI-defined hippocampal atrophy may be a sensitive marker of progression of AD, but it is not specific for AD.31 By showing that both AD and TDP/HS simultaneously explain significant proportions of the variance of our hippocampal volume measure, the current study provides new evidence in support of the latter statement.
Second, we show that TDP/HS pathology is an important factor that contributes to hippocampal volume loss. TDP/HS has recently emerged as common pathologies that are distinct from AD but have similar associations with late-life cognitive decline, episodic memory in particular. Consistent with the prior report,9 we found in this study that, like AD, TDP/HS leads to hippocampal volume loss. Furthermore, we estimated that overall the proportion of the variance of hippocampal volume explained by TDP/HS is similar to that of AD (5% vs 7%), while among individuals with Alzheimer dementia, the variance explained by TDP/HS is almost twice as much as that explained by AD (6% vs 3%). These results indicate that, in addition to the overlapping cognitive profiles for TDP/HS and AD, their contributions to hippocampal volume loss are comparable and the contribution of TDP/HS is even larger than that of AD in Alzheimer dementia. The public health implication of these findings is 2-fold. On the one hand, using hippocampal atrophy as an AD biomarker or even as an indicator of progression of AD pathology, without properly accounting for contributions due to TDP/HS, is likely to bias the impact of therapeutic agents and to undermine the development of effective therapies for AD. This is particularly relevant given that neurodegeneration biomarkers (N) have been incorporated, together with amyloid (A) and tau (T), into the latest AD research framework of AT(N). While a marker for the progression of AD pathology, it is equally or even more likely that neurodegeneration is reflective of coexistent TDP/HS, especially in persons with Alzheimer dementia. On the other hand, prior reports highlight a marked impact of TDP/HS on dementia,22,32 which creates a great sense of urgency for developing biomarkers or diagnostic criteria for TDP/HS. Notably, lack of specificity for hippocampal volume does not preclude other indices that can be used to distinguish TDP/HS from AD. A recent study reported that an inward hippocampal deformity is associated with PHFtau tangle pathology but not with β-amyloid or TDP pathology,33 suggesting that shape analysis of hippocampi may hold potential for capturing profiles for distinct neuropathologies.
Our study is unique in many aspects. The ROSMAP participants were enrolled without known dementia and followed up annually, and all agreed to brain donation after death. Over decades of follow-up, some developed cognitive impairment or dementia, and some died without impairment. This design provides brain specimens from a cohort of persons that span the spectrum of cognition from normality to dementia and have a range of age-related neuropathologies. This greatly extends the clinicopathologic work that can be done. Uniform structured neuropathologic evaluations provide rich measures of various neuropathologies that are common in aging. These neuropathology data, in combination with available postmortem MRI structural measure, allowed us to systematically interrogate individual neuropathologies in association with hippocampal volume and to quantify the contributions of non-AD neuropathologies relative to that of AD. We previously reported independent associations of AD and HS with smaller hippocampal volume.12,19 Here, we extended our prior findings in 2 ways. First, with a much larger sample size, the statistical results from our current study are more robust. Our analyses revealed that in addition to AD and HS, TDP and atherosclerosis are associated with smaller hippocampal volume. Second, we quantified the contributions to hippocampal volume by other neuropathologies above and beyond AD.
Limitations are noted. The ROSMAP participants are volunteers, which limits the generalization of our findings. Enrollment requires that participants agree to annual in-home evaluations and brain donation; thus, the cohorts are selected. On the other hand, home visits facilitate high follow-up rates among survivors by reducing participation burden, and agreement to brain donation at study entry promotes a high autopsy rate. Both reduce the biases that may have occurred either due to dropout or when autopsy is not obtained. Participants on average are older-old, and the majority are non-Hispanic whites. Future studies in cohorts of younger-old persons and racial ethnic minorities are needed to further address the generalizability of study findings. In addition, our single-template method of extracting volumes may be less accurate than more advanced, multiatlas segmentation approaches that are under development for postmortem MRI. Nevertheless, the resultant segmentations capture the local expansion or contraction of the transformation field in the vicinity of the medial temporal lobe and can therefore serve as a reasonable proxy for hippocampal atrophy. It is possible that postmortem deformation of brain hemisphere and hippocampus may affect the quality of registrations to the template, although our observations suggest otherwise. Because intracranial volume is not available from postmortem MRI, we included the measure of total hemisphere volume to control for between-person differences in overall brain volume. As a result, the neuropathologic associations with hippocampal atrophy detected in our analysis may be limited to those that are over and above more generalized brain atrophy. In a model without controlling for total hemisphere volume, the overall results for the associations of neuropathologies with hippocampal volume were similar. Pathologically, our indices for AD (e.g., amyloid load and tangle density) were measured with much greater precision, which may have resulted in underestimation of the contribution of the coexisting pathologies. Nonetheless, we note that such underestimation further strengthens our conclusion in comparing AD and TDP/HS. The finding that TDP/HS (measured with less precision) contributes importantly to hippocampal volume loss after controlling for AD pathology (measured with greater precision) suggests that this is a relatively conservative estimate of the impact of TDP/HS on hippocampal volume loss relative to AD. Separately, our current neuropathologic protocol does not have the precision to investigate the role of vascular or other injuries specific to the hippocampus, and we may underestimate the role of vascular disease in specific cases.
Acknowledgment
The authors are indebted to all the participants in ROSMAP who donated their data and biospecimen. They also thank the investigators and staff of the Rush Alzheimer's Disease Center.
Glossary
- AD
Alzheimer disease
- CERAD
Consortium to Establish a Registry for Alzheimer's Disease
- CI
confidence interval
- HS
hippocampal sclerosis
- NIA
National Institute on Aging
- PHF
paired helical filament
- ROSMAP
Religious Orders Study and Rush Memory and Aging Project
- TDP
transactive response DNA-binding protein 43
Appendix. Authors
Study funding
The study was supported by NIA grants P30AG10161, R01AG15819, R01AG17917, R01AG34374, and R01AG042210.
Disclosure
L. Yu, P. Boyle, R. Dawe, D. Bennett, and K. Arfanakis report no disclosures relevant to the manuscript. J. Schneider serves as a consultant for Grifols, AVID Radiopharmaceuticals, the National Hockey League, and the National Football League. Go to Neurology.org/N for full disclosures.
References
- 1.West MJ, Coleman PD, Flood DG, Troncoso JC. Differences in the pattern of hippocampal neuronal loss in normal ageing and Alzheimer's disease. Lancet 1994;344:769–772. [DOI] [PubMed] [Google Scholar]
- 2.Whitwell JL, Josephs KA, Murray ME, et al. MRI correlates of neurofibrillary tangle pathology at autopsy: a voxel-based morphometry study. Neurology 2008;71:743–749. [DOI] [PMC free article] [PubMed] [Google Scholar]
- 3.Chetelat G, Villemagne VL, Bourgeat P, et al. Relationship between atrophy and beta-amyloid deposition in Alzheimer disease. Ann Neurol 2010;67:317–324. [DOI] [PubMed] [Google Scholar]
- 4.Hibar DP, Adams HHH, Jahanshad N, et al. Novel genetic loci associated with hippocampal volume. Nat Commun 2017;8:13624. [DOI] [PMC free article] [PubMed] [Google Scholar]
- 5.Pievani M, Galluzzi S, Thompson PM, Rasser PE, Bonetti M, Frisoni GB. APOE4 is associated with greater atrophy of the hippocampal formation in Alzheimer's disease. Neuroimage 2011;55:909–919. [DOI] [PubMed] [Google Scholar]
- 6.Mormino EC, Kluth JT, Madison CM, et al. Episodic memory loss is related to hippocampal-mediated beta-amyloid deposition in elderly subjects. Brain 2009;132:1310–1323. [DOI] [PMC free article] [PubMed] [Google Scholar]
- 7.Fox NC, Freeborough PA, Rossor MN. Visualisation and quantification of rates of atrophy in Alzheimer's disease. Lancet 1996;348:94–97. [DOI] [PubMed] [Google Scholar]
- 8.Gosche K, Mortimer J, Smith C, Markesbery W, Snowdon D. Hippocampal volume as an index of Alzheimer neuropathology findings from the Nun Study. Neurology 2002;58:1476–1482. [DOI] [PubMed] [Google Scholar]
- 9.Josephs KA, Dickson DW, Tosakulwong N, et al. Rates of hippocampal atrophy and presence of post-mortem TDP-43 in patients with Alzheimer's disease: a longitudinal retrospective study. Lancet Neurol 2017;16:917–924. [DOI] [PMC free article] [PubMed] [Google Scholar]
- 10.Mak E, Su L, Williams GB, et al. Differential atrophy of hippocampal subfields: a comparative study of dementia with Lewy bodies and Alzheimer disease. Am J Geriatr Psychiatry 2016;24:136–143. [DOI] [PubMed] [Google Scholar]
- 11.Fiford CM, Manning EN, Bartlett JW, et al. White matter hyperintensities are associated with disproportionate progressive hippocampal atrophy. Hippocampus 2017;27:249–262. [DOI] [PMC free article] [PubMed] [Google Scholar]
- 12.Kotrotsou A, Schneider JA, Bennett DA, et al. Neuropathologic correlates of regional brain volumes in a community cohort of older adults. Neurobiol Aging 2015;36:2798–2805. [DOI] [PMC free article] [PubMed] [Google Scholar]
- 13.Bennett DA, Buchman AS, Boyle PA, Barnes LL, Wilson RS, Schneider JA. Religious Orders Study and Rush Memory and Aging Project. J Alzheimers Dis 2018;64:S161–S89. [DOI] [PMC free article] [PubMed] [Google Scholar]
- 14.Dawe RJ, Bennett DA, Schneider JA, Vasireddi SK, Arfanakis K. Postmortem MRI of human brain hemispheres: T2 relaxation times during formaldehyde fixation. Magn Reson Med 2009;61:810–818. [DOI] [PMC free article] [PubMed] [Google Scholar]
- 15.Dawe RJ, Bennett DA, Schneider JA, et al. Ex vivo T2 relaxation: associations with age-related neuropathology and cognition. Neurobiol Aging 2014;35:1549–1561. [DOI] [PMC free article] [PubMed] [Google Scholar]
- 16.Jenkinson M, Smith S. A global optimisation method for robust affine registration of brain images. Med Image Anal 2001;5:143–156. [DOI] [PubMed] [Google Scholar]
- 17.Ardekani BA, Guckemus S, Bachman A, Hoptman MJ, Wojtaszek M, Nierenberg J. Quantitative comparison of algorithms for inter-subject registration of 3D volumetric brain MRI scans. J Neurosci Methods 2005;142:67–76. [DOI] [PubMed] [Google Scholar]
- 18.Joshi S, Davis B, Jomier M, Gerig G. Unbiased diffeomorphic atlas construction for computational anatomy. Neuroimage 2004;23:S151–S160. [DOI] [PubMed] [Google Scholar]
- 19.Dawe RJ, Bennett DA, Schneider JA, Arfanakis K. Neuropathologic correlates of hippocampal atrophy in the elderly: a clinical, pathologic, postmortem MRI study. PLoS One 2011;6:e26286. [DOI] [PMC free article] [PubMed] [Google Scholar]
- 20.Schneider JA, Arvanitakis Z, Bang W, Bennett DA. Mixed brain pathologies account for most dementia cases in community-dwelling older persons. Neurology 2007;69:2197–2204. [DOI] [PubMed] [Google Scholar]
- 21.Kotrotsou A, Bennett DA, Schneider JA, et al. Ex vivo MR volumetry of human brain hemispheres. Magn Reson Med 2014;71:364–374. [DOI] [PMC free article] [PubMed] [Google Scholar]
- 22.Nag S, Yu L, Capuano AW, et al. Hippocampal sclerosis and TDP-43 pathology in aging and Alzheimer disease. Ann Neurol 2015;77:942–952. [DOI] [PMC free article] [PubMed] [Google Scholar]
- 23.Yang HS, Yu L, White CC, et al. Evaluation of TDP-43 proteinopathy and hippocampal sclerosis in relation to APOE epsilon4 haplotype status: a community-based cohort study. Lancet Neurology 2018;17:773–781. [DOI] [PMC free article] [PubMed] [Google Scholar]
- 24.Power MC, Mormino E, Soldan A, et al. Combined neuropathological pathways account for age-related risk of dementia. Ann Neurol 2018;84:10–22. [DOI] [PMC free article] [PubMed] [Google Scholar]
- 25.Nelson PT, Dickson DW, Trojanowski JQ, et al. Limbic-predominant age-related TDP-43 encephalopathy (LATE): consensus working group report. Brain 2019;142:1503–1527. [DOI] [PMC free article] [PubMed] [Google Scholar]
- 26.Mirra SS, Heyman A, McKeel D, et al. The Consortium to Establish a Registry for Alzheimer's Disease (CERAD), part II: standardization of the neuropathologic assessment of Alzheimer's disease. Neurology 1991;41:479–486. [DOI] [PubMed] [Google Scholar]
- 27.Braak H, Braak E. Neuropathological stageing of Alzheimer-related changes. Acta Neuropathol 1991;82:239–259. [DOI] [PubMed] [Google Scholar]
- 28.Jack CR, Jr, Bennett DA, Blennow K, et al. NIA-AA research framework: toward a biological definition of Alzheimer's disease. Alzheimers Dement 2018;14:535–562. [DOI] [PMC free article] [PubMed] [Google Scholar]
- 29.Barber R, Ballard C, McKeith IG, Gholkar A, O'Brien JT. MRI volumetric study of dementia with Lewy bodies: a comparison with AD and vascular dementia. Neurology 2000;54:1304–1309. [DOI] [PubMed] [Google Scholar]
- 30.van de Pol L, Gertz HJ, Scheltens P, Wolf H. Hippocampal atrophy in subcortical vascular dementia. Neurodegener Dis 2011;8:465–469. [DOI] [PubMed] [Google Scholar]
- 31.Jack CR Jr, Dickson DW, Parisi JE, et al. Antemortem MRI findings correlate with hippocampal neuropathology in typical aging and dementia. Neurology 2002;58:750–757. [DOI] [PMC free article] [PubMed] [Google Scholar]
- 32.Josephs KA, Whitwell JL, Weigand SD, et al. TDP-43 is a key player in the clinical features associated with Alzheimer's disease. Acta Neuropathol 2014;127:811–824. [DOI] [PMC free article] [PubMed] [Google Scholar]
- 33.Hanko V, Apple AC, Alpert KI, et al. In-Vivo hippocampal subfield shape related to TDP-43, amyloid beta, and tau pathologies. Neurobiol Aging 2018;74:171–181. [DOI] [PMC free article] [PubMed] [Google Scholar]
Associated Data
This section collects any data citations, data availability statements, or supplementary materials included in this article.
Data Availability Statement
Data used in this work are available by request via the Rush Alzheimer's Disease Center Research Resource Sharing Hub (radc.rush.edu).