

Abstract
Zika virus (ZIKV) infection during pregnancy has been causally linked to a constellation of neurodevelopmental deformities in the fetus resulting in a disease termed congenital Zika syndrome (CZS). Here we detail how ZIKV infection produces extensive neuropathology in the developing mouse brain and spinal cord of both sexes. Surprisingly, neuropathology differs depending on viral strain with a French Polynesian isolate producing primarily excitotoxicity and a Brazilian isolate being almost exclusively apoptotic but occurring over a prolonged period that is more likely to produce severe hypoplasia. We also show exposure can produce a characteristic pattern of infection that mirrors neuropathology and ultimately results in gross morphological deformities strikingly similar to CZS. This research provides a valuable mouse model mirroring the clinical course of disease that can be used to test potential therapies to improve treatment and gain a better understanding of the disabilities associated with CZS.
SIGNIFICANCE STATEMENT Zika virus (ZIKV) infection during pregnancy has been causally linked to a constellation of neurodevelopmental deformities in the fetus resulting in a disease termed congenital Zika syndrome. Despite its devastating effects, very little is known about how ZIKV infection produces fetal neuropathology. Here we detail the temporal progression of ZIKV infection in the mouse brain and spinal cord resulting in massive neurodegeneration of infected regions. We also report a ZIKV strain from a region of Brazil with high levels of microcephaly (abnormally small head circumference) produces particularly devastating neuropathology.
Keywords: apoptosis, congenital Zika syndrome, excitotoxicity, microcephaly, microencephaly, Zika virus
Introduction
First discovered in the Ugandan Zika forest in 1947, the Zika virus (ZIKV) initially produced sporadic outbreaks throughout Africa and Asia before causing major epidemics in Micronesia and French Polynesia where there was concern human infection was producing Guillain–Barre syndrome (Cao-Lormeau et al., 2016; Lazear et al., 2016). In 2015, interest increased dramatically once ZIKV infection was correlated with a dramatic increase in microcephaly resulting in at least 1950 confirmed cases in Brazil alone. Although definitions vary, microcephaly is a medical condition in which a baby is born with an abnormally small head circumference. The Centers for Disease Control has subsequently established a causal relationship between ZIKV infection and microcephaly (Rasmussen et al., 2016), which was followed by their most difficult emergency health response ever undertaken (Beck, 2016). Although research initially focused on microcephaly, clinicians now use the term congenital Zika syndrome (CZS) to highlight the constellation of symptoms ZIKV infection can produce during neurodevelopment. Symptoms of CZS include microcephaly, calcifications, epileptic seizures, arthrogryposis, and neuromotor deficits (Saad et al., 2018). Additionally, although estimates suggest hundreds of thousands of women were infected during their pregnancy (Adams Waldorf et al., 2018), it is unknown whether undetected fetal pathology occurred that will manifest later with age. Because CZS is a newly discovered disease, its long-term effects are unknown but will undeniably lead to a lifetime of severe intellectual disability for many affected. With a lifetime price of care estimated at $10 million per effected individual (Frieden et al., 2016), the total financial cost for these children will likely be enormous.
Despite the devastating effects of this disease, we still know little about how infection leads to neuropathology or whether virulence differs between strains. Although current research suggests that ZIKV infection can destroy neural progenitor cells and reduce neurogenesis, this would not explain why microcephaly can occur following third trimester infection (Brasil et al., 2016) or develop postnatally after normocephalic birth (van der Linden et al., 2016b) when almost all cerebral neurogenesis is complete (de Graaf-Peters and Hadders-Algra, 2006). Another mystery is why the ZIKV was only associated with microcephaly following the 2015 Brazilian outbreak despite its discovery in 1947. One reason may be an adaptive mutation that increased infectivity in neural progenitor cells (NPCs) resulting in more significant microcephaly (Yuan et al., 2017). This mutation occurred just before the 2013 French Polynesian outbreak and has remained unaltered in subsequent epidemics as the virus spread to Brazil and the rest of the Americas. However, there are differences in microcephaly rates after this time. The 2015 Brazilian outbreak resulted in infections throughout the country, yet 83.3% of all microcephalic cases were concentrated in a small northeastern region of the country (de Oliveira et al., 2017b). As a result, important epidemiological questions remain as to whether differences in neuropathology between strains may be responsible for drastically differing microcephaly rates. Others have reported infection of juveniles or adults with African strains produce more severe pathology than Asian strains (Duggal et al., 2017; Tripathi et al., 2017). Additionally, direct intracerebral infection of newborns pups with a more contemporary Venezuelan strain has been reported to produce more severe microcephaly than an ancestral Cambodian strain. However, we are unaware of studies that directly compare differences between the Brazilian strain and others that may explain the high rates of microcephaly following the 2015 Brazilian outbreak. Based on this information, we examined the neuropathology produced in the developing rodent brain following infection with clinical isolates from French Polynesia or Paraiba, the northeastern Brazilian state where microcephaly rates were highest (Jaenisch et al., 2017). Our findings reveal that exposure produces a characteristic pattern of infection resulting in extensive neuropathology, which results in gross morphological changes strikingly similar to CZS. We further discovered that different strains produce different types of pathology, with the Brazilian strain being far more virulent and more likely to produce gross morphological changes consistent with microcephaly.
Materials and Methods
Experimental design and statistical analysis.
We examined the ability of two ZIKV strains to induce neuropathology in wild-type C57BL/6J developing mice. All experiments included both male and female mice, but this was not tracked for statistical analysis. Animals were first examined for neuropathology using silver staining (detects all types of degeneration) and activated caspase-3 (AC3; detects only apoptosis). For each strain and days postinfection (DPI) time point, at least two litters were examined to ensure consistent results. This information was then used to further examine infection pattern and type of neuropathology using a variety of methods. Histology and assessments were done blind to treatment. All procedures were approved by the Washington University in St. Louis Institutional Animal Care and Use Committee in accordance with the Guide for the Care and Use of Laboratory Animals (Anon, 2011). Sample sizes were based on experience using similar analysis in previous studies (Noguchi et al., 2008; Cabrera et al., 2017) to gain enough power to detect statistically significant differences if present. Because quantification is performed in several brain regions, it can be argued we need to control for multiple comparisons. We therefore applied a Bonferroni correction for multiple comparisons by dividing the α level (α = 0.05) by the number of comparisons for AC3 (α < 0.0071), silver staining (α < 0.0071), and area measurements (α < 0.013). Statistical tests that would become nonsignificant following correction are indicated in Table 1. It should be noted this correction is very conservative and increases the chance of false-negatives (an error in which significant result becomes nonsignificant; Lindquist and Mejia, 2015). More detailed descriptions of experimental design and statistical analysis can be found in the following subsections.
Table 1.
Statistical results from ANOVAs in Figure 1
| Region | Marker | Treatment | DPI | Interaction |
|---|---|---|---|---|
| Hippocampus | AC3 | F(2,40) = 05.30, p = 0.0091* | F(2,40) = 12.40, p < 0.0001 | F(4,40) = 04.36, p = 0.0051 |
| Motor cortex | AC3 | F(2,51) = 16.65, p < 0.0001 | F(2,51) = 51.87, p < 0.0001 | F(4,51) = 18.74, p < 0.0001 |
| Visual cortex | AC3 | F(2,50) = 13.44, p < 0.0001 | F(2,50) = 54.07, p < 0.0001 | F(4,50) = 21.13, p < 0.0001 |
| Striatum | AC3 | F(2,51) = 36.11, p < 0.0001 | F(2,51) = 97.88, p < 0.0001 | F(4,51) = 31.70, p < 0.0001 |
| Thalamus | AC3 | F(2,40) = 15.91, p < 0.0001 | F(2,40) = 23.75, p < 0.0001 | F(4,40) = 08.51, p < 0.0001 |
| Cerebellum | AC3 | F(2,39) = 13.32, p < 0.0001 | F(2,39) = 16.67, p < 0.0001 | F(4,39) = 09.22, p < 0.0001 |
| Septum | AC3 | F(2,40) = 01.54, p = 0.2227 | F(2,40) = 05.03, p = 0.0113* | F(4,40) = 01.54, p = 0.2096 |
| Hippocampus | Silver stain | F(2,42) = 09.29, p = 0.0005 | F(2,42) = 23.93, p < 0.0001 | F(4,42) = 07.96, p < 0.0001 |
| Motor cortex | Silver stain | F(2,42) = 19.55, p < 0.0001 | F(2,42) = 49.65, p < 0.0001 | F(4,42) = 18.59, p < 0.0001 |
| Visual cortex | Silver stain | F(2,41) = 14.15, p < 0.0001 | F(2,41) = 34.46, p < 0.0001 | F(4,41) = 07.85, p < 0.0001 |
| Striatum | Silver stain | F(2,42) = 13.31, p < 0.0001 | F(2,42) = 26.44, p < 0.0001 | F(4,42) = 10.38, p < 0.0001 |
| Thalamus | Silver stain | F(2,41) = 14.75, p < 0.0001 | F(2,41) = 21.77, p < 0.0001 | F(4,41) = 05.19, p = 0.0018 |
| Cerebellum | Silver stain | F(2,41) = 30.81, p < 0.0001 | F(2,41) = 22.43, p < 0.0001 | F(4,41) = 11.29, p < 0.0001 |
| Septum | Silver stain | F(2,42) = 04.81, p = 0.0132* | F(2,42) = 20.97, p < 0.0001 | F(4,42) = 05.67, p = 0.0010 |
| Dorsal cortex | Nissl stain | F(2,21) = 06.48, p = 0.0064 | N/A | N/A |
| Hippocampus | Nissl stain | F(2,19) = 15.41, p < 0.0001 | N/A | N/A |
| Cerebellum | Nissl stain | F(2,19) = 62.60, p < 0.0001 | N/A | N/A |
| Lateral ventricle | Nissl stain | F(2,19) = 01.78, p = 0.1965 | N/A | N/A |
| Brain weight | N/A | F(2,19) = 20.58, p < 0.0001 | N/A | N/A |
Main effects, interactions, F values, and p values for one- and two-ANOVAs graphed in Figure 1.
*Indicates value would be nonsignificant following Bonferroni correction for multiple comparisons.
Zika virus.
The H/PF/2013 (French Polynesia, 2013; FP/2013) and Paraiba (Brazil, 2015; Paraiba/2015) ZIKV strains were a kind gift from the laboratory of Michael Diamond who obtained them from the Arbovirus Branch of the Centers for Disease Control and Prevention or Steve Whitehead (NIH), respectively. Virus was propagated and maintained as described previously (Miner et al., 2016a) by propagating in Vero cells, titrating using a focus-forming assay, and storing in aliquots at −80°C. Neonatal mice were intraperitoneally inoculated with 103 focus forming units (FFU) in a volume of 25 μl and immediately returned to dams. Mock infection was performed by injecting an equal volume of vehicle alone. All neonates within a litter received the same treatment (infected or mock infected) to eliminate the possibility of cross infection between pups.
Silver staining.
The de Olmos cupric silver staining procedure is a sensitive method for staining degenerating cells (DeOlmos and Ingram, 1971; Noguchi et al., 2005; Creeley et al., 2013). For silver staining and immunohistochemistry, treated animals were killed at different DPI by deep anesthesia before transcardial perfusion with 4% paraformaldehyde in TRIS buffer, pH 7.4, and, after postfixation, brains were sectioned on a vibratome (DSK Microslicer DTK-1000N) at 75 μm in the coronal (cerebrum) or sagittal (cerebellum) plane. Silver staining was performed in free-floating sections as described previously (DeOlmos and Ingram, 1971; Noguchi et al., 2005) by washing sections in distilled deionized water, pre-incubating in a cupric-silver solution overnight after heating to 33°C, washing in acetone, incubating for 35 min in a silver diamine solution, reduction using formaldehyde/citric acid, washing with distilled water, bleaching with 0.3% K3Fe(CN)6, and stabilizing using Na2S2O3.
Immunohistochemistry.
Immunolabeling with polyclonal antibodies was performed by quenching sections in 3% hydrogen peroxide/methanol, blocking in 2% BSA/0.2% milk/0.1% Triton X-100 mixture in PBS, and incubation in primary antibody overnight. The next day, sections were then reacted with ABC reagents (Vectastain ABC Elite Kit, Vector Laboratories) before chromogen labeling with VIP (Vectastain ABC Elite Kit). All primary antibodies used were rabbit polyclonal: AC3 (Cell Signaling Technology, catalog #9661L; 1:1000); Iba1 (Wako Chemicals, catalog #1919741; 1:15,000; RRID:AB_839504). It should be noted that viral infection can increase endogenous Fc receptor binding resulting in false-positive labeling during immunohistochemistry. We examined this possibility in a pilot study and found ZIKV infection does indeed produce false-positive labeling of microglia when mouse monoclonal antibodies were used even in the absence of primary antibodies. Interestingly, rabbit polyclonal antibodies raised against different epitopes labeled unique populations of cells indicating they do not produce false-positive labeling. This makes sense in that the mouse Fc receptor would selectively bind to mouse antibodies and not those from other species. Based on this information we avoided using mouse monoclonal antibodies in these studies.
Kaplan–Meier curves.
Animal survival was tracked in mice (n = 137) to produce Kaplan–Meier Curves (Goel et al., 2010; Rich et al., 2010) following P1 infection by noting the DPI when death (or kill due to suffering) or censorship (planned kill to perform histology) occurred until 30 DPI. Results were entered into Prism statistical software v5.0a and analyzed using the Gehan–Breslow–Wilcoxon test and log rank (Mantel–Cox) test for survival analysis.
Semiquantitative analysis.
Stereological analysis was impossible following some treatments because pathology became so intense that heavy degeneration occurred throughout entire regions preventing discrimination of individual cells. We therefore had a rater, blind to treatment, semiquantitatively rate the amount of degeneration on slides stained with either AC3 or silver staining at either 7, 13, or 30 DPI following either mock (n = 23), FP/2013 (n = 16), or Paraiba/2015 (n = 22) infection. For each animal, both stains were performed in three coronal sections corresponding to +0.02 mm bregma, −1.755 mm bregma, and −2.98 mm bregma, respectively, in addition to one midsagittal section (0.0 mm lateral) of the cerebellum (Lein et al., 2007). The amount of degeneration was then semiquantitatively evaluated in the hippocampus, motor cortex, visual cortex, striatum, thalamus, cerebellum, and septum based on a 5-point Likert scale using the following criteria: 1, slight to no degeneration; 2, moderate degeneration; 3, significant degeneration; 4, high amounts of degeneration; and 5, intense degeneration (continuous regions of degeneration where individual cells are not discernible).
Quantification of brain regions and weight.
Quantification of brain weight and brain regional areas were performed in animals exposed to the FP/2013 (n = 4), Paraiba/2015 (n = 7), or mock (n = 11) infection and killed on 30 DPI. Whole-brain weights were measured following removal from the skull before sectioning. Brains were then vibratome cut at 75 μm and regional area quantified on four Nissl-stained sections (0.1% cresyl violet acetate in 0.3% v/v glacial acetic acid) corresponding to the same regions used for semiquantitative analysis. Areas were calculated by tracing regions using Stereo Investigator Software v2019 (MBF Bioscience) connected to a QImaging 200R camera on a Nikon Labophot-2 microscope using a 4× objective. The dorsal cortex, hippocampus, and lateral ventricles were traced on coronal sections and the cerebellum from the sagittal section. The dorsal cortex included all cortex dorsal to the piriform/entorhinal cortex and was chosen due to the isolated degeneration in this region. Regions occurring in multiple sections had areas summed before statistical analysis. All quantification was analyzed using one- or two-way ANOVAs and Bonferroni post hoc using Prism statistical software v5.0a.
In situ hybridization.
Animals were perfused with 4% paraformaldehyde in TRIS buffer, pH 7.4, and dissected to remove brain and spinal cord. Tissue was postfixed overnight, dehydrated with graded alcohols, stored in 70% ethanol, embedded in paraffin, cut at 5 μm, dried overnight, and de-paraffinized. ZIKV RNA labeling was performed using an Advanced Cell Diagnostics HybEZ II Oven with ZIKV probe (catalog #468361) and visualized with an RNAscope 2.5 HD Red Assay (catalog #322360) and hematoxylin counterstaining. For in situ hybridization (ISH)/immunolabeling combined technique, ISH for ZIKV RNA was performed first followed by immunolabeling with antibodies for neurons (NeuN; 1:100, Millipore; catalog #ABN78; RRID:AB_10807945), microglia (Iba1; 1:15,000, Wako Chemicals, catalog #1919741; 1:15,000; RRID:AB_839504), or astrocytes (GFAP; 1:400, Sigma-Aldrich, catalog #G9269; RRID:AB_477035) before coverslipping. The ISH red assay used for bright-field images also fluoresces in the red channel without bleeding into the other channels.
Plastic embedding and electron microscopy.
Animals were first transcardially perfused with 1.5% glutaraldehyde/1% paraformaldehyde following deep anesthesia. Brains were then removed, cut into 1 mm slabs in the coronal plane, osmicated with 1% osmium tetroxide overnight, placed in graded alcohol to dehydrate, cleared in toluene, and finally plastic embedded in Araldite. For semi-thin sections, tissue was then cut using a Leica Ultracut UCT ultramicrotome at 1 μm and stained with Azure II/methylene blue. For electron microscopy, sections were suspended over a Formvar-coated slot grid before staining with uranyl acetate/lead citrate and visualized using a JOEL JEM1400 transmission electron microscope.
Alizarin staining.
Alizarin is a standard chemical dye for the detection of calcifications in the brain. A 2% Alizarin Red S (Sigma-Aldrich) solution was prepared by mixing in 0.1 m borate buffer, filtering a 0.45 μm, and adjusting pH to 6.7. Slide mounted sections were then immersed in alizarin solution for 1 h, rinsed by dipping in tap water for 20 dips, and cleared in 70% ethanol for 20 dips. Tissue was then dehydrated for 2 min in 95, 95, 100, and 100% ethanol baths followed by immersion in three changes of citri-solve for 5 min before coverslipping.
Imaging.
Bright-field and fluorescent photo composites were taken on Leica DM400B microscope with a Leica DFC310FX camera using Surveyor software V7.0.0.6 MT (Objective Imaging) to photo-merge images. For fluorescent images, each channel was imaged individually and merged in Adobe Photoshop V 12.0 after adjustment of channel levels.
Viral sequences.
Viral sequences for FP/2013 (KJ776791.2) and Paraiba/2015 (KX280026.1) were obtained from the National Institutes of Health's GenBank (https://www.ncbi.nlm.nih.gov/genbank/) for comparison (Baronti et al., 2014; Tsetsarkin et al., 2016). Missense and untranslated region mutations are discussed; however, although there were numerous synonymous mutations, they were not mentioned because they are more likely to be silent.
Results
Infection and behavior
To examine the time course of neuropathology following infection, neonatal wild-type C57BL/6 mice of both sexes were inoculated with 103 FFU of clinical isolates from the 2013 French Polynesian (H/PF/2013; FP/2015) or 2015 Paraiba Brazilian outbreaks (Paraiba/2015) as described previously (Miner et al., 2016a,b). Injections were administered between postnatal days 1–4 as a single intraperitoneal injection (van den Pol et al., 2017). It is important to note that because the mouse is born neurodevelopmentally immature compared with the human, a newborn pup brain is the equivalent of a human fetus in the early second trimester of gestation (Clancy et al., 2007; Workman et al., 2013). Mock infected control mice were intraperitoneally injected with only vehicle at an equal volume. Behaviorally, some animals displayed motor deficits, which, if present, resulted in an unsteady gait or falling during ambulation and an inability or difficulty to perform a righting reflex once placed in a supine position at ∼10 DPI. Ataxia progressively worsened afterward and was followed by flaccid paralysis of hindlimbs as animals became moribund by ∼P14.
FP/2013 and Paraiba/2015 produce different Kaplan–Meier curves
We first generated Kaplan–Meier curves for the FP/2013 and Paraiba/2015 strains following P1 infection until 30 DPI (Fig. 1A). Although both strains were almost equally lethal, most deaths occurred between 10 and 17 DPI for FP/2013 but this period was more evenly distributed and expanded between 8 and 24 DPI for Paraiba/2015. Survival curves are typically analyzed by the Gehan–Breslow–Wilcoxon test or the log rank Mantel–Cox test. The former is sensitive to deaths early in the survival curve, whereas the latter is more powerful if the chance of death is the same at all time points. Interestingly, the Gehan–Breslow–Wilcoxon test was statistically significant (χ2 = 10.33, p < 0.001) but the log rank Mantel–Cox test was not (χ2 = 2.366, p > 0.05). This suggests lethality following FP/2013 exposure is heightened during an early acute period compared with Paraiba/2015 that is less intense and occurs over a more prolonged period.
Figure 1.

Quantitative analysis reveals Paraiba/2015 infection results in prolonged lethality/degeneration and more severe hypoplasia. A, Kaplan–Meier curves reveal FP/2013 infection produces acute lethality occurring primarily between 10 and 17 DPI but Paraiba/2015 infection results in almost equal lethality with deaths occurring during an expanded period between 8 and 24 DPI. B–H, AC3-immunolabeled sections rated on our degeneration scale reveal no effect at 7 DPI, both viruses increasing apoptosis at 13 DPI, and only Paraiba/2015 increasing apoptosis at 30 DPI. I–O, Silver-stained (SS) sections rated with the same scale shows infection with FP/2013 increases degeneration between 7 and 13 DPI that as absent by 30 DPI. Alternatively, Paraiba/2015 infection results in delayed argyrophilia beginning at 13 DPI that leads to prolonged degeneration extending to at least 30 DPI in several regions. P, At 30 DPI, brains weights were significantly lighter for Paraiba/2015 only. Q–T, Nissl-stained sections had regions outlined revealing significant reductions in area for the dorsal cortex, hippocampus, and cerebellum following Paraibla/2015 infection only. Lateral ventricle area was not significantly different for any group. Group key and Bonferroni post hoc values located in bottom-right box. For ANOVAs and F values see Table 1.
French Polynesian strain
We first examined how neuropathology evolves over time by infecting mice with FP/2013 and sacrificing for histology at varying DPI. Neuropathology and infection were assessed using silver staining (detects all types of cellular degeneration), AC3 immunolabeling (detects only apoptosis), and ISH for ZIKV RNA (to measure the pattern of infection). Neuropathology was then quantified using a semiquantitative degeneration scale on 7, 13, and 30 DPI in sections labeled with AC3 (Fig. 1B–H) and silver staining (Fig. 1I–O). Finally, the long-term effects of infection on hypoplasia was quantified by determining brain weight (Fig. 1P) and outlining specific regions to determine or area at 30 DPI (Fig. 1Q–T). Data were then analyzed using one- or two-way ANOVAs followed by Bonferroni post hoc analysis (Fig. 1; Table 1).
FP/2013 infection: early stage, 7–13 DPI
Neuropathology began as early as 7 DPI but was more consistently seen by 13 DPI. In general, although AC3 and silver staining tended to overlap, only silver staining could detect degeneration at 7 DPI suggesting non-apoptotic degeneration was occurring during this early stage (Fig. 1B–O).
Dorsal cortex
Degeneration in the dorsal cortex included the motor, somatosensory, retrosplenial, and visual cortices. By 10–13 DPI, advanced degeneration involved all layers with heavier bilaminar degeneration in layer IV and the ventral portion of layer V that seemed particularly intense in the somatosensory cortex (Figs. 1B,C,I,J, 2A–D,G–J). The ventral cortex was relatively spared but degeneration could be seen in some animals at more advanced stages. ISH for ZIKV RNA revealed cortical infection mirroring argyrophilia (silver-positive degeneration) with a similar bilaminar appearance (Fig. 2, compare A,G with E,K) and often showed cellular profiles of soma that resembled pyramidal cells (Fig. 2F). Interestingly, clinical research has found a similar bilaminar pattern of infection in the dorsal cortex of ZIKV infected fetuses (Bhatnagar et al., 2017) suggesting a similar pattern of infection between species. No similar neuropathology was seen in mock infected controls (Fig. 2C,D,I,J).
Figure 2.

Histology reveals extensive degeneration that mirrors infection in the early stage (7–13 DPI). A–F, Frontal cortex. A, B, Silver staining reveals ZIKV exposure produces heavy degeneration 10 DPI in the frontal cortex, somatosensory (SS), caudate–putamen (C/P), and septum (SE) but (C, D) absent in mock (MOCK) infected controls. E, F, ISH for ZIKV RNA (red) reveals infection mirrors degeneration in which pyramidal shaped cells can be distinguished (yellow arrows). G–L, Hippocampus. G, H, Infection produces degeneration in visual cortex (VIS), LGN of the thalamus, superior colliculus (SC), and hippocampal formation including CA1, CA3, and dentate gyrus (DG). Degenerating microglia can also be seen in the dentate polymorph layer (PL), stratum oriens (SO), and stratum radiatum (SR) but is absent in controls (I, J), which have regions diagrammed. K–L, ISH labeling reveals infection mirrors degeneration including heavy infection in granule cells (blue arrows) and pyramidal cells in CA3/CA1 (yellow arrows) but less distinct staining in the PL, SO, and SR. M–R, Cerebellum. M, N, ZIKV inoculation produces heavy argyrophilia in the granule cell layer (GCL), Purkinje cell layer (PCL; red arrows), and their connections in the molecular layer (ML) but little toxicity in the white matter (WM). O, P, Mock infected controls exhibit no signs of toxicity, which has regions diagrammed. Q, R, ZIKV RNA was also detected in the cerebellar granule cell, Purkinje, and molecular layers mirroring toxicity in which large infected Purkinje cells (yellow arrows) could be seen. S–V, Spinal Cord. S, Degeneration was lighter in the gray matter but particularly heavy in the funiculus (white matter) including the corticospinal tract (red arrows). T, No similar toxicity was seen in mock infected controls. U, AC3 staining reveals intense apoptosis in the corticospinal tract (red arrows) along with lower levels in white and gray matter. V, ZIKV infection is especially heavy in the funiculus with lower levels in the spinal gray. Outlined regions in A, C, E, G, I, K, M, O, and Q are magnified in B, D, F, H, J, L, N, P, and R, respectively. Scale bars: A–R, 500 μm; S–V, 100 μm.
Visual regions
Consistent with our previous research suggesting the ZIKV can gain entry through visual pathways (Miner et al., 2016b), one of the first regions to show degeneration is the optic tract and lateral geniculate nucleus (LGN; visual relay center in the thalamus) ∼7 DPI (Figs. 2G–J, 3A,B). This complements previous research showing neonatal ZIKV inoculation produces infection in the retina first that spreads to the LGN (van den Pol et al., 2017). This is also consistent with the high incidence of retinal/optic nerve degeneration (Miner et al., 2016b) and visual impairment in CZS children (Ventura et al., 2018) suggesting viral infection occurs similarly between species. As infection progressed, other visual areas degenerate including the superior colliculus and visual cortex (Figs. 1C,J, 2G–J). Infection mirrored silver staining with early punctate ISH labeling in the optic tract (Fig. 3, compare A, C) followed by the LGN and visual cortex (Fig. 2K,L).
Figure 3.

Magnified views of silver staining and ISH labeling in the dentate gyrus, optic tract, and spinal cord. A–C, Argyrophilic fibers of the optic tract (arrows) could be seen degenerating in infected animals 7 DPI (A), but not in mock infected controls. B, C, ISH labeling for ZIKV RNA reveled punctate labeling of the optic tract (red arrows) resembling argyrophilia. D, E, At 10 DPI, D, degeneration can be seen in the dentate gyrus granule cell layer (GCL), molecular layer (ML) neuropil, and microglia in the polymorph layer (PL). E, Mock infected controls exhibit no degeneration. Diagram of synaptic connections is overlaid showing axons of the perforant path synapsing with dendrites of granule cells, which, in turn, send efferents through mossy fibers (MFs) to CA3. F, ISH labeling for ZIKV RNA reveals a pattern of infection that mirrors degeneration. G, The spinal cord exhibited early infection 7 DPI that exhibited punctate labeling in the cytoplasm surrounding the nucleus in the spinal lateral horn. Scale bars, 100 μm.
Hippocampal formation
Injury in the hippocampal formation was usually absent at 7 DPI but became severe at later stages suggesting this was not the primary site of infection (Fig. 1D,K). The most consistent degeneration was in the dentate gyrus where argyrophilia was seen in granule cells and the molecular layer neuropil connecting granule cell dendrites to perforant path axon terminals (Figs. 2G–J, 3D,E). Degeneration also occurred less frequently in CA3 and CA1 pyramidal cells (Fig. 2G–J). Interestingly, these structures form a trisynaptic circuit with granule cells sending afferents through the mossy fibers to CA3 and CA3 connecting to CA1 through Schaeffer collaterals (Fig. 3D,E). This may suggest the virus spreads trans-synaptically through connected regions. Closer examination revealed a large number of degenerating microglia in the dentate polymorph layer, stratum oriens, and stratum radiatum (Figs. 2G–J, 3D,E). Hippocampal infection also closely mirrored microglial and neuronal death (Figs. 2, compare G,H with K,L, and 3, compare D, F). Clearly ISH labeled granule cell and pyramidal cell neurons could be seen in the dentate gyrus and CA1/CA3, respectively (Fig. 2K,L). Although infection also occurred in regions with microglial degeneration in the polymorph layer, stratum oriens, and stratum radiatum, it was difficult to determine cell type.
Cerebellum
The cerebellum was one of the most heavily affected regions (Fig. 1E,L). It actually contains more neurons than the cerebrum with the vast majority being granule cell neurons that send axons to the superficial molecular layer where they bifurcate in opposite directions before synapsing with dendrites from multiple Purkinje cells. Extensive argyrophilia of both granule and Purkinje cells were seen along with degenerating neuropil of their synaptic connections in the molecular layer (Fig. 2M–P). The cerebellum also exhibited high ZIKV RNA in the molecular, Purkinje, and granule cell layers similar to argyrophilia (Fig. 2 compare M,N with Q,R). ISH-labeled Purkinje cells were identifiable due to their characteristic large size and position but it was difficult to definitively identify other infected cell types (Fig. 2R).
Spinal cord
Because layer V somatosensory cortex is injured and sends numerous afferents to the corticospinal tract (even more than the motor cortex in the mouse; Sengul and Watson, 2015) we next examined the spinal cord. Degeneration occurred in the gray matter but was more extensive in the funiculus (white matter). The most conspicuous degeneration was in the corticospinal tract, which is consistent with fetal CZS autopsies showing this pathway is often shrunken or missing (Fig. 2S,T; Chimelli and Avvad-Portari, 2018). AC3 immunolabeling revealed corticospinal toxicity was primarily apoptotic and encompassed large portions of this tract (Fig. 2U). Infection was also heavy in the funiculus, which contains numerous ascending and descending pathways such as the corticospinal, vestibulospinal, reticulospinal, and spinothalamic tracts (Fig. 2V). The spinal gray also exhibited infection to a lesser degree. The spinal cord was one of the earliest regions to show infection suggesting a secondary route of neuroinvasion. This could be seen as punctate labeling in the cytoplasm surrounding the nucleus of some cells in the spinal lateral horn ∼7 DPI (Fig. 3G). Interestingly, the herpes virus also gains entry to the brain through the visual and spinal (corticospinal) pathways suggesting a similar route of neuroinvasion (Lewis et al., 1989; Kidokoro et al., 2017).
Other regions
Neuropathology could also be seen in other regions including the thalamus, caudate/putamen, septum, and subiculum (Fig. 1F–H,M–O, 2A–D,G–J), which mirrored infection (Fig. 2E,F,K,L).
Early neurodegeneration is excitotoxic
Early neuropathology includes limited apoptosis
Once we established the pattern of degeneration/infection, we next examined differences in neuropathology. We first applied both silver staining and AC3 immunolabeling on sections from the same animal and region. AC3 was highly correlated with regional silver staining but exhibited far fewer cellular profiles in most regions (Fig. 4). Silver staining also marked some cell types not seen with AC3 staining such as microglia and Purkinje neurons. Both stains labeled the corticospinal tract that was more distinct with AC3 immunolabeling and often involved large portions of this pathway as it projected from the cortex ventrally as the internal capsule and continued into the spinal cord (Fig. 4C,D,G–J). From this comparison, we conclude ZIKV infection produces significant apoptosis but there is also extensive non-apoptotic death occurring.
Figure 4.

A comparison of AC3 and silver staining reveals both apoptotic and non-apoptotic degeneration is occurring. Silver and AC3 staining were performed in the same animal and region for comparison. Although there was a strong correlation between the two, silver staining revealed more extensive pathology. A, AC3 labeling in the cortex shows apoptotic pyramidal cells (arrows) extending their apical dendrites to more superficial layers along with debris from less distinct cells 9 DPI. B, Silver staining in the same region shows more extensive degeneration although it is difficult to distinguish cellular profiles. C, Apoptosis was seen in the pyramidal and granule cells in the hippocampus along with axons of the internal capsule (a part of the corticospinal tract) projecting ventrally to the spinal cord (arrows). D, Silver staining revealed neuronal along with heavy microglial degeneration in the hippocampus. Some fibers from the corticospinal tract can be seen in addition to degeneration in the LGN below the hippocampus. E, AC3 immunolabeling shows numerous apoptotic granule cells in the cerebellum but far more are present with silver staining (F), along with large Purkinje cells (arrows) and argyrophilic neuropil in the molecular layer. G, H, The corticospinal tract exhibited heavy and more distinct AC3 labeling compared with silver staining (I, J), however, more argyrophilic profiles were seen in other areas. Outlined regions in G and I are magnified in H and J, respectively. Scale bars: A–D, 500 μm; G, I, 250 μm; E, F, 100 μm.
Plastic embedding reveals vacuolization and apoptosis
To examine this non-apoptotic death further, we plastic embedded tissue (which preserves the fine micro- and ultra-structural morphology in greater detail) and stained with the nuclear stain Azure II/Methylene blue. The hippocampal formation exhibited heavy neuropathology including large regions of neuronal vacuolization (fluid-filled cavities within the cytoplasm) and abnormal nuclear chromatin condensation in the granule cells of the dentate gyrus (Fig. 5A). Similar vacuolization could be seen in the pyramidal cells of CA3/CA1 intermixed with lower amounts of apoptosis along with dendritic swelling in the stratum oriens dorsal to the CA region (Fig. 5B). Beyond the hippocampus, the cortex also exhibited large regions of heavy vacuolization interspersed with pyknotic apoptotic cells (Fig. 5C). None of this pathology could be seen in mock infected controls in the same regions (Fig. 5D–F, respectively).
Figure 5.

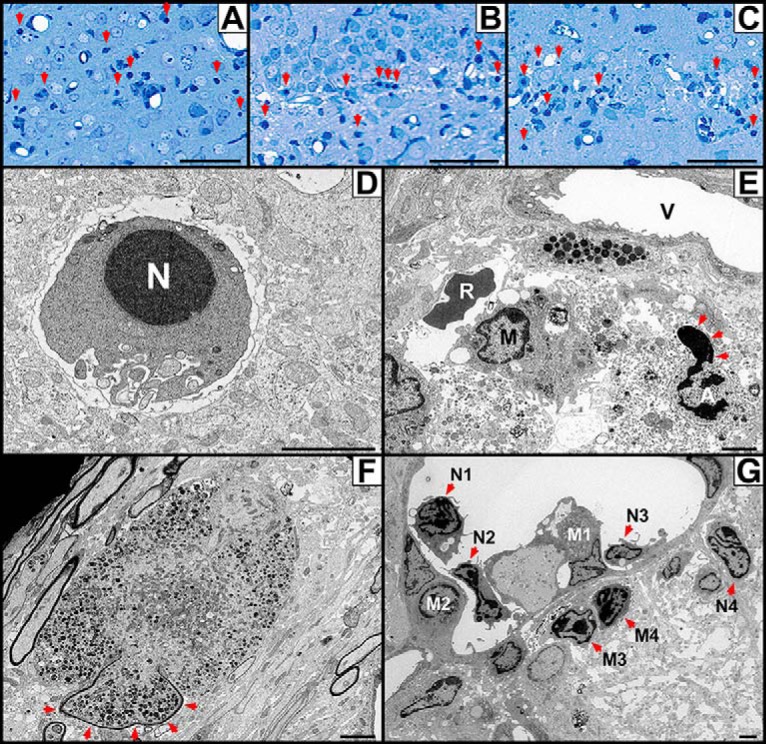
ZIKV infection produces excitotoxicity, apoptosis, and other signs of pathology. A–F, Plastic sections. At 13 DPI, brains from ZIKV (A–C) or mock (D–F) infected animals were plastic embedded and stained with Azure II/methylene blue. A, ZIKV infection produced heavy vacuolization (formation of fluid filled cavities within the cytoplasm) of dentate gyrus granule cells (yellow arrows) along with abnormal nuclear chromatin condensation (red arrows). B, Vacuolization (yellow arrows) could also be seen in the CA1 along with both dendritic swelling in the stratum oriens (red arrows) and apoptosis (black arrows). C, Similar vacuolization (yellow arrows) and apoptosis (black arrows) was seen in the dorsal cortex (retrosplenial pictured). Control animals displayed no pathology in the dentate gyrus (D), CA1 (E), or retrosplenial cortex (F). G–N, Electron Microscopy. G, Image of a normal cortical neuron exhibiting homogeneous nuclear chromatin (*), a single nucleolus (yellow arrow), and thin endoplasmic reticulum (ER; red arrow) within the cytoplasm. H, Image taken 13 DPI shows cortical neuron displaying cytoplasmic condensation and vacuolated segments of ER (yellow arrow). Nuclear margination (end clumping) of nuclear chromatin (white arrows) is seen in a “clock-face profile” along with the nuclear envelope expanding into a large vacuolar space (*). I, Cortical neuron in a late stage of degeneration exhibiting terminal nuclear degeneration and large cytoplasmic vacuoles (*). J, A healthy granule cell (red arrow) among four undergoing excitotoxicity (yellow arrows) in the dentate gyrus of the hippocampus. Degenerating neurons exhibit vacuolar swelling of ER (*) and terminal nuclear degeneration. K, CA1 pyramidal hippocampal neuron exhibiting signs of excitotoxicity including nuclear chromatin margination forming a clock-face profile and swelling of ER undergoing vacuolization (red arrow). L, Parenchymal hemorrhage could be seen in multiple areas of the brain with numerous red blood cells (R) lacking a nucleus interspersed among myelinated axons (yellow arrows). M, A single lymphocyte (L) can be seen next to a heavily vacuolated (V) degenerating neuron (N). N, A degenerating microglia (M) in the hippocampus presenting with a very condensed and shrunken cytoplasm, thin vacuolated processes, and nuclear dystrophy. Scale bars: A–F, 10 μm; G–N, 2 μm.
Neuronal excitotoxicity and microglial degeneration
Because we were approaching magnification limits of the microscope, we next examined plastic embedded tissue using electron microscopy. In the cortex, neurons in an early phase of degeneration exhibited cytoplasmic condensation, swelling of granulated endoplasmic reticulum, and nuclear margination where clumps of aggregated chromatin localize to the inner edge of the nuclear envelope (called a “clock-face” profile; Fig. 5, compare G,H). This is often accompanied by condensation of cytoplasm leading to compaction of organelles, vacuolization as the endoplasmic reticulum swells, and further vacuolization of the nuclear envelope (Fig. 5H,I). Similar pathologic changes could be seen in the dentate gyrus granule cells (Fig. 5J) and CA1 hippocampal pyramidal cells (Fig. 5K) consistent with Azure II/Methylene blue staining. Importantly, the dendritic swelling, nuclear margination, and vacuolization we see are all classical hallmarks of excitotoxicity, the pathological process by which neurons are damaged or killed by glutamatergic overstimulation (Ishimaru et al., 1999). Tissue ultrastructure also revealed other signs of an injured brain including parenchymal hemorrhage (Fig. 5L) where leaking red blood cells can be seen in extravascular space similar to clinical reports (Brasil et al., 2016). Whereas lymphocytes are rarely seen in the healthy brain, numerous could be seen in infected brains (Fig. 5M) suggesting an adaptive immune response following viral infection. Finally, we also found degenerating microglia (Fig. 5N) suggesting that infection is additionally toxic to this cell type consistent with our microscopic examination.
Infection produces microglial activation and fragmentation as microglia degenerate
Because silver staining and ultrastructural examination revealed microglial pathology, we next immunolabeled for the microglial marker Iba1 at different DPI. Uninfected controls displayed evenly distributed ramified (resting) microglia with thin extended processes (Fig. 6A,B) that became activated (thickened retracted processes connected to distended soma) following infection by 7 DPI (Fig. 6C,D). By 10 DPI, regions with high amounts of degeneration either displayed microglia fragmenting into cellular debris or were more sparsely populated (Fig. 6E,F) suggesting microglial pathology.
Figure 6.

Iba1 immunolabeling reveals microglia undergo initial activation followed by fragmentation. A, B, Microglia in the visual cortex (left) and hippocampus (right) after mock infection exhibit ramified microglia with thin elongated extensions with small soma indicative of an inactivated macrophage. C, D, At 7 DPI, microglia become activated with thickened retracted processes and distended cell bodies. E, F, By 10 DPI, microglia become less dense and begin to fragment in regions with high amounts of degeneration. Scale bars, 100 μm.
FP/2013 infection: late stage, 13–30 DPI
Neuropathology either clears or transitions to apoptosis ∼13 DPI
After ∼13 DPI, infection and degeneration will decrease into smaller focal regions before being eliminated completely for most animals. However, a small number of animals will have neuropathology increase dramatically and shift to heavy apoptosis ∼13 DPI. When cortical degeneration transitions to apoptosis, it expands to all layers but is still highly restricted dorsally (Fig. 7A–D). Hippocampal apoptosis was primarily restricted to large numbers of neurons in the dentate gyrus, CA1, and CA3 although microglial degeneration can also be seen with silver staining (Fig. 7E–H). Apoptosis in the cerebellum gradually became more dense until focal regions of degeneration were seen in large sections of the granule cell layer (Fig. 7I–L). Compared with earlier stages of pathology, degeneration transformed from more granular degeneration of individual cells to dense sections of apoptotic tissue dying en masse. This may suggest the virus can more easily spread in these regions to adjacent cells (regardless of cell type) rather than exclusively spreading trans-synaptically. By 30 DPI, animals exhibit no evidence of continuing degeneration (Fig. 1B–O). Some animals appear to show gross morphological changes including cortical thinning (Fig. 7M–O), hippocampal/cerebellar hypoplasia (Fig. 7N–P), and ventriculomegaly (Fig. 7M–O). However, brain weight and quantification of regional areas was not significantly decreased suggesting this transition to more severe pathology is uncommon (Fig. 1P–T).
Figure 7.

Pathology produced by French Polynesian ZIKV infection can transitions to pervasive apoptosis after ∼13 DPI. A small number of animals infected with FP/2013 had degeneration transition to pervasive apoptosis. A–D, Frontal Cortex. A, B, Silver staining in the anterior cerebrum ∼14 DPI shows degeneration in the caudate/putamen with intense pathology restricted to a thinning dorsal cortex. C, D, AC3 immunolabeling in the same animal reveals an identical pattern of extensive apoptosis. E–H, Anterior Hippocampus. E, Silver staining reveals heavy degeneration in the cortex with slight hippocampal atrophy and ventriculomegaly (*). F, Closer examination reveals degeneration is particularly heavy in the CA3 region of hippocampus. G, H, AC3 labeling mirrors silver staining indicating these cells die primarily through apoptosis. I–L, Cerebellum. I, J, Silver staining reveals heavy regions of degeneration isolated to the granule cell layer, which is mirrored by AC3 labeling (K, L). M–P, At 30 DPI, degeneration has ceased but gross morphological changes can be seen including ventriculomegaly (*) (M–O), and hippocampal/cerebellar atrophy (N–P). Outlined regions in A, C, E, G, I, K, M, and O are magnified in B, D, F, H, J, and L, respectively. Scale bars, 1 mm.
Paraiba/2015 strain primarily produces apoptosis and is much more virulent
Previous research suggests an adaptive mutation first seen in the 2013 French Polynesian outbreak increased infection of NPCs and the ability to produce microcephaly (Yuan et al., 2017). However, the subsequent Brazilian outbreak resulted in drastically different microcephaly rates with 83.3% restricted to a small northeastern region of Brazil despite ZIKV infections throughout the country. This may suggest subsequent ZIKV strains evolved to become even more neurotoxic during this outbreak. We therefore examined whether a ZIKV strain isolated from a region with high rates of microcephaly (Paraiba/2015 isolated from northeastern Brazil) produces neuropathology similar to the FP/2013.
Paraiba/2015 produces apoptosis and is more likely to produce microencephaly
Animals were infected at 103 FFU with the Paraiba/2015 and killed at different DPI. Quantification revealed no increase in degeneration at 7 DPI that increased dramatically by 13 DPI suggesting a more gradual progression to neurotoxicity compared with FP/2013 (Fig. 1B–O). Degeneration began ∼10 DPI with apoptosis being much more prevalent but occurring in the same set of regions (Fig. 8A–D). Apoptosis peaks by 10–13 DPI with AC3 labeling becoming extremely dense in many regions and most brains exhibiting gross morphological changes (Figs. 1B–O, 8E–H). Protracted degeneration frequently led to hippocampal hypoplasia resulting in its dorsal retraction (Fig. 8F,G) along with the beginning of cortical thinning (Fig. 8E–G). The cerebellum also revealed greater levels of granule cell apoptosis along with hypoplasia (Fig. 8H). By 30 DPI, increases in degeneration were frequently seen but occurred in more limited patches in the cortex, hippocampus, and cerebellum (Figs. 1B–O, 8I–P). Unlike FP/2013, quantification at 30 DPI revealed significant reductions in brain weight (22%) along with reduced area in the dorsal cortex (10%), hippocampus (37%), and cerebellum (57%; Fig. 1P–S). The cerebellar apoptosis was primarily isolated to the granule layer of certain lobes that were selectively atrophied and resulted in hypoplasia so severe it was often noticeable upon brain removal (Fig. 8L). Although lateral ventricular size was over twice the size of controls, this did not reach significance due to high variance (Fig. 1T). ISH labeling, like apoptosis, was more intense than FP/2013 infection but generally involved the same regions and mirrored argyrophilia (Fig. 9). More specifically, the sparser labeling with FP/2013 exhibited more granular infection of individual cells whereas Paraiba/2015 exposure could produce patches of dense ISH labeling that affected all cells within it. To investigate this further, we performed immunohistochemistry for different cell type markers on tissue labeled with ISH for ZIKV RNA at 10 DPI. In areas with high infection, there were a large number of neurons (NeuN) but more limited labeling of microglia (Iba1) and astrocytes (GFAP; Fig. 10). This suggests that neurons are the primary cell type infected.
Figure 8.

Pathology produced by Paraiba/2015 infection is more virulent and almost exclusively apoptotic. AC3 immunolabeling was performed at different DPI in the frontal cortex, anterior hippocampus (Ant Hippo), posterior hippocampus (Post Hippo), and cerebellum following infection with 103 FFU of the Brazilian ZIKV strain. A–D, Apoptosis first appeared ∼7–10 DPI with heavy degeneration in the dorsal cortex, hippocampus (CA1, CA3, and dentate gyrus), and cerebellar granule cell layer. E–H, Approximately 10–13 DPI, apoptosis peaks often producing gross morphological changes including, dorsal cortex atrophy, hippocampal retraction dorsally, and thinning of cerebellar lobes. I–L, At 20–30 DPI continuing degeneration produces microencephaly, ventriculomegaly, and atrophy of the dorsal cortex, hippocampus, and cerebellum. M–P, An age matched control brain (P30) is pictured for comparison to images I–L. All images in each column are at the same magnification for comparison. Scale bars, 1 mm.
Figure 9.

ISH labeling for ZIKV and silver staining 10–16 after Paraiba/2015 inoculation reveal intense infection and degeneration mirroring apoptosis. A–D, Frontal cortex. A, ISH labeling for ZIKV RNA in the frontal cerebrum reveals intense infection in the dorsal somatosensory/motor cortex and caudate/putamen. B, A close-up of outlined region shows almost continuous labeling throughout suggesting infection in all cell types. C, D, Silver staining reveals degeneration matching infection and AC3 labeling. E, F, The hippocampus was also heavily infected throughout the dentate gyrus, CA1, and CA3 regions with silver staining (G, H), mirroring the pattern of infection. I, J, ISH labeling in the cerebellum revealed dense infection within entire lobes but less severe in others. K, L, Silver staining was more severe and particularly intense in the granule cell layer of the cerebellum. Scale bars, 1 mm.
Figure 10.

Labeling reveals regions with high ZIKV infection contain numerous neurons but more limited microglia and astrocytes at 10 DPI. A–D, Tissue was immunolabeled with the neuronal nuclear marker NeuN (A), stained with the nuclear stain DAPI (B), and ISH labeled for ZIKV RNA. A merged image (D) revealed a large number of neurons located in infected regions. E–G, Similar staining with the microglial marker (Iba1, DAPI, and ISH for ZIKV RNA) or (I–L) astroglial marker (GFAP, DAPI, and ISH for ZIKV RNA) revealed more limited colabeling. Scale bar, 100 μm.
Plastic embedding, electron microscopy, alizarin staining, and immunolabeling
We next examined this pathology further by performing plastic embedding and Azure II/Methylene blue staining. Consistent with AC3 labeling, infection with Paraiba/2015 produced massive amounts of apoptosis with the cortex, dentate gyrus, and CA1 showing shrunken soma with nuclear chromatin condensation (Fig. 11A–C). Closer examination with electron microscopy confirmed a large number of neurons displaying the classic signs of apoptosis (Ishimaru et al., 1999). This included reductions in soma volume along with nuclear chromatin condensation into spherical electron-dense nuclear masses (Fig. 11D) consistent with Azure II/methylene blue staining. At later stages, the nuclear envelope lost integrity allowing the nucleoplasmic contents to spill into the cytoplasm as the cell was broken down further (Fig. 11E). Other ultrastructural signs of pathology/infection could be seen including parenchymal hemorrhage (Fig. 11E), microglial phagocytosis (11E), axonal pathology (11F), and neutrophil diapedesis indicating an adaptive immune response (11G). Interestingly, in the CA3 region, their seemed to be more argyrophilic cells than AC3-positive cells suggesting non-apoptotic death was occurring (Fig. 12A,B). Subsequent plastic embedding revealed cell pathology typical of both apoptosis and excitotoxicity (Fig. 12C). Therefore, although apoptosis dominates, limited excitotoxicity is additionally present. We next examined pathology using two other methods. Because cerebellar lobes with high apoptosis developed crystal precipitate, we also performed alizarin staining and confirmed the presence of calcification (Fig. 12D). We also performed Iba1 staining, which showed a reduced density of microglia or large patches devoid of these immune cells altogether (Fig. 12E,F). This may indicate that continued microglial degeneration can produce immunocompromised regions where virus can flourish.
Figure 11.
Plastic embedding and electron microscopy following infection with Paraiba/2015 reveals massive apoptosis, parenchymal hemorrhage, axonal pathology, and an adaptive immune response. A–C, Plastic sections. Mouse pups were infected with Paraiba/2015 at 103 FFU and killed 13 DPI for plastic embedding and staining with Azure II/Methylene blue. Histology revealed a large number of cells displaying characteristic signs of apoptosis with shrunken soma and nuclear chromatin condensation (red arrows) in the (A) cortex, (B) dentate gyrus, and (C) CA1 of the hippocampus. D–G, Electron microscopy. D, Apoptotic neuron undergoing somal shrinkage and condensation of chromatin in the nucleus (N). E, Perivascular area with hemorrhaged red blood cell (R) located outside the vascular lumen (V) is adjacent to an activated microglia (M). An additional apoptotic cell (A) in the late stage of apoptosis can also be seen. Its bilaminar nuclear envelope is primarily intact except for one portion where disruption allows the nucleoplasmic contents to spill into the surrounding dystrophic cytoplasm (arrows). F, Cross section of an axon undergoing massive swelling and organelle compaction following the breakdown of axoplasmic transport. Part of this swollen axon still retains its myelin sheath (arrows), whereas the rest is demyelinated and has expanded into the surrounding interstitial space. G, Neutrophils were frequently seen in post-capillary venules in preparation for diapedesis or in the extravascular space following extravasation. Neutrophils were observed adjacent to the endothelium (N1, N2), adhered to the endothelial wall (N3), or in the extravascular space (N4). Monocytes were also seen undergoing similar transmigration (M1, M2) or in the extravascular space (M3, M4). This reveals an adaptive immune response as leukocytes migrate to sites of injury/infection. Scale Bars: A–C, 50 μm; D–G, 2 μm.
Figure 12.
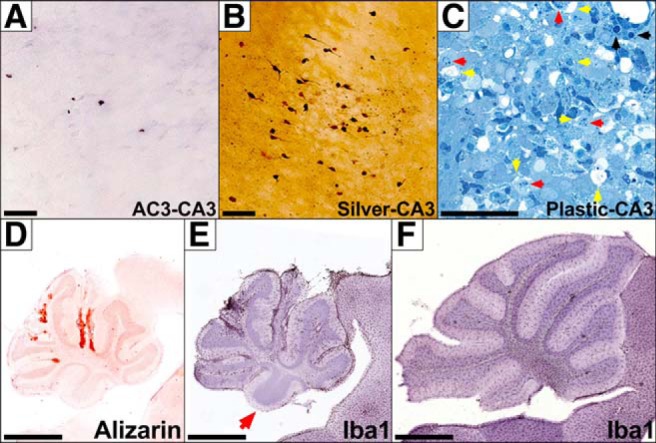
Infection with Paraiba/2015 produces CA3 excitotoxicity, cerebellar calcification, and reductions in microglia. Whereas AC3 labeling reveals little apoptosis in the hippocampal CA3 region (A), silver staining shows much more argyrophilia (B), suggesting non-apoptotic death is occurring. C, Semithin plastic sections with Azure II/methylene blue staining in CA3 show the classical signs of both apoptosis (black arrows) and excitotoxicity, which includes vacuolization (yellow arrows) and nuclear margination (red arrows). D, Alizarin staining shows calcification is localized to the granule cell layer and present in atrophied lobes. E, Iba1 labeling shows microglia are present at a much lower density or are almost entirely missing from a cerebellar lobe (red arrow). Note the adjacent brainstem contains a normal density of microglia. F, Iba1 labeling in an age matched control shows a normal density and distribution of microglia. Note severe cerebellar hypoplasia in images D and E compared with F, which is at the same magnification scale. Scale bars: A–C, 50 μm; D–F, 1 mm.
Discussion
Here we provide a detailed description of the neuropathology produced by two ZIKV strains in the developing mouse brain. This revealed that FP/2013 and Paraiba/2015 induce pathology in a similar set of structures while producing very different neuropathology. FP/2013-induced neuropathology occurs in two stages with early degeneration occurring through excitotoxicity followed by intense apoptosis in a smaller set of animals that resolves by 30 DPI. Alternatively, Paraiba/2015 progresses more slowly resulting in extensive apoptotic degeneration that reaches significance at 13 DPI and continues until at least 30 DPI. This prolonged, unrelenting degeneration is consistent with the extended lethality seen in our Kaplan–Meier curves and is the likely mechanism through which Paraiba/2015 can produce severe microencephaly/hypoplasia. Excitotoxicity can be seen following numerous types of insults including seizures, hypoxia/ischemia, traumatic brain injury, or other diseases that produce deficient cellular energy reserves. These conditions ultimately disrupt ionic gradients leading to the release of the excitatory neurotransmitter glutamate, which produces excessive stimulation and the postsynaptic influx of calcium ions that activate several enzymes such as proteases, endonucleases, and phospholipases that damage the cell (McDonald and Johnston, 1990). The vacuolization we see occurs when the neuron attempts to protect itself from excessive free intracellular calcium by sequestering it in the endoplasmic reticulum or other organelles (Noguchi, 2001). This, along with dendritic swelling and chromatin margination, are classical signs of excitotoxicity, which can produce degeneration distinct from apoptosis (Ishimaru et al., 1999). This suggests that as infected neurons become compromised, they release glutamate following dysregulation of neurotransmitter reserves. This is consistent with important research from two independent labs that found ZIKV infection in neuronal cell cultures results in glutamate release and excitotoxicity (Costa et al., 2017; Olmo et al., 2017; Gaburro et al., 2018). Because seizures primarily produce injury through excitotoxicity, it is also consistent with the high incidence of epilepsy in CZS (van der Linden et al., 2018). There are several potential reasons why ZIKV infection produces apoptosis. One possibility is that apoptosis is an innate immune response whereby cells commit suicide rather than host viral infection and replication. Viruses can also release proteins that inhibit apoptosis, which might explain why this type of degeneration is delayed following FP/2013 infection (Everett and McFadden, 1999). A second possibility is that neurons become so compromised, apoptosis is initiated to efficiently remove the cell using programmed cell death. Finally, apoptosis may also be initiated through transneuronal degeneration; the secondary degeneration in an uninjured neuron due to its disconnection from others (Fornito et al., 2015). Transneuronal degeneration is much more likely to arise in the developing brain and occurs because some neurons (such as those projecting through the corticospinal tract) die off following the loss of synaptic connectivity (Torvik, 1956; Trumpy, 1971).
We also describe a characteristic pattern of infection/neuropathology that models the clinical course of CZS. This includes frequently reported CZS abnormalities such as microencephaly, calcifications, parenchymal hemorrhage, and axonal pathology. The specific pattern of effected regions are also consistent with CZS including: (1) Degeneration in the retina, optic nerve (Miner et al., 2016b) and other visual areas consistent with clinical reports of pathology in these same structures and visual impairment in 84.6% of CZS children (Ventura et al., 2016, 2018; de Paula Freitas et al., 2016). (2) Infection and pathology in the spinal cord, which is consistent with spinal cord atrophy reported in 83.3% of children with CZS (Aragao et al., 2017). More specifically, we found that the corticospinal tract was especially affected, which is often atrophied or missing in CZS and may explain why ZIKV infection can produce arthrogryposis, a condition where weakness/paralysis of muscles in utero prevents movements that relieve joint pressure leading to joint deformities due to a fixed fetal position (van der Linden et al., 2016a; Aragao et al., 2017; Carod-Artal, 2018; Chimelli and Avvad-Portari, 2018). (3) Severe cerebellar hypoplasia, which occurs in 52% of CZS patients (Melo et al., 2016; Meneses et al., 2017). (4) A bilaminar pattern of infection in the cortex consistent with CZS autopsies (Bhatnagar et al., 2017).
This description of ZIKV-induced neuropathology is important for several reasons. First, because CZS was first recognized in 2015, current sufferers are still children and it is unknown what behavioral deficits will manifest with age. As a result, knowing what regions are vulnerable may provide important insight into possible long-term consequences of this disorder. Second, our research suggests it is clinically important to know the viral strain of infection because this may predict the virulence and help answer some epidemiological mysteries surrounding the ZIKV epidemic. The extensive hypoplasia produced by Paraiba/2015 is consistent with the high rates of microcephaly in the Brazilian region it was isolated from. Interestingly, others have infected neonatal mice (at 106 plaque forming units) with a ZIKV isolate from a region close to Paraiba and shown reduced dorsal brain area, prolonged infection, and long-term behavioral deficits (Nem de Oliveira Souza et al., 2018). This adds further evidence that strains isolated from Northeastern Brazil ∼2015 may be particularly likely to produce microencephaly. Why Paraiba/2015 produces prolonged infection and increased virulence is currently unknown but examination of its sequence reveals two missense (base pair positions 3534 and 8007) and one 3′ UTR (base pair position 10392) mutations compared with the FP/2013 strain. Because Paraiba/2015-induced neuropathology is prolonged, the flaviviral 3′UTR mutation may be particularly important because this region plays an important role in viral replication and evasion of the host immune response (Ng et al., 2017). Some theories additionally suggest evolution favors a biphasic pathogenic virulence that is initially high but decreases over time as the number of susceptible hosts decreases (Berngruber et al., 2013). This may explain why a second wave of infection in Brazil did not produce dramatic increases in microcephaly (de Oliveira et al., 2017a) and will be the focus of future research. Finally, our mouse model allows us to more fully characterize how the ZIKV induces neuropathology, which can be used to more accurately assess potential therapies. For instance, our research shows that microencephaly only occurs after prolonged and extensive degeneration. Therefore, animal models that only use this criterion may miss more subtle damage, which can have clinical relevance. Consistent with this idea, the Centers for Disease Control originally reported 6% of pregnancies with evidence of infection resulted in ZIKV-associated birth defects (Honein et al., 2017), however, a follow-up study of children >1 year of age found 14% had a birth defect and/or neurodevelopmental abnormalities possibly associated with CZS (Rice et al., 2018). This percentage may go up as children age because it is difficult to behaviorally test neurodevelopmental deficits in children this young (Davidson et al., 2016).
There are also at least two major limitations to this model. First, neonatal infection occurred during a rodent period equivalent to the human second/third trimester when infection can still produce CZS but most cerebral neurogenesis is complete (de Graaf-Peters and Hadders-Algra, 2006; Brasil et al., 2016; van der Linden et al., 2016b). Therefore, the limited population of cerebral NPCs during this time prevents us from examining their role in disease progression. Our findings may therefore only provide insight into exposures occurring after the first trimester or first trimester infections that persist into later gestational periods. Interestingly, we found no pathology in the large population of postnatal cerebellar NPCs suggesting they play no significant role in its subsequent hypoplasia. A second limitation of our model is that our infection during the postnatal period prevents us from modeling vertical transmission that may lead to different effects on neuropathology. For instance, this may lead to different routes of neuroinvasion or allow fetal infection with ZIKV strains that may not ordinarily cross the placenta. Regardless, it is clear the prolonged degeneration we found results in severe microencephaly that closely models CZS.
In summary, CZS is a devastating disease that produces a unique constellation of severe neurodevelopmental disabilities effecting thousands of children. Unfortunately, because of its recent discovery, many basic questions regarding this disease and its ultimate consequences still remain unanswered. Using the developing mouse animal model, we detail for the first time how the ZIKV can produce a characteristic pattern of infection that mirrors neuropathology resulting in gross morphological abnormalities striking similar to CZS. This toxicity is more complicated than originally thought with the type and degree of neuropathology dependent on viral strain. It is hoped this information can be used to provide insight into mechanisms of strain-dependent neurotoxicity, a better understanding of the disabilities associated with CZS, and an animal model to test potential treatment regimens that more accurately models disease progression.
Footnotes
This work was supported by Large Exploratory and Pilot Grants (K.K.N.) from the Intellectual and Developmental Disabilities Research Center (IDDRC) at Washington University (IDDRC@WUSTL Research Program) in addition to a NIH Grant (NICHD U54-HD087011) for the IDDRC at Washington University. We thank Dr. Michael Diamond and his laboratory (particularly Jen Govero) for their support and advice in the design and implementation of these studies. Electron microscopic imaging was performed at the Washington University Center for Cellular Imaging supported by the Washington University School of Medicine, The Children's Discovery Institute of Washington University, St. Louis Children's Hospital (CDI-CORE-2015-505), and the Foundation for Barnes-Jewish Hospital (3770).
The authors declare no competing financial interests.
References
- Adams Waldorf KM, Olson EM, Nelson BR, Little ME, Rajagopal L (2018) The aftermath of Zika: need for long-term monitoring of exposed children. Trends Microbiol 26:729–732. 10.1016/j.tim.2018.05.011 [DOI] [PMC free article] [PubMed] [Google Scholar]
- Anon (2011) Guide for the care and use of laboratory animals. Washington, DC: National Academy of Sciences. [Google Scholar]
- Aragao MF, Brainer-Lima AM, Holanda AC, van der Linden V, Vasco Aragão L, Silva Júnior MLM, Sarteschi C, Petribu NCL, Valença MM (2017) Spectrum of spinal cord, spinal root, and brain MRI abnormalities in congenital Zika syndrome with and without arthrogryposis. AJNR Am J Neuroradiol 38:1045–1053. 10.3174/ajnr.A5125 [DOI] [PMC free article] [PubMed] [Google Scholar]
- Baronti C, Piorkowski G, Charrel RN, Boubis L, Leparc-Goffart I, de Lamballerie X (2014) Complete coding sequence of Zika virus from a French polynesia outbreak in 2013. Genome Announc 2:e00500–14. 10.1128/genomeA.00500-14 [DOI] [PMC free article] [PubMed] [Google Scholar]
- Beck J. (2016) Zika is the 'most difficult' emergency health response ever, CDC official says. The Atlantic, June 24. [Google Scholar]
- Berngruber TW, Froissart R, Choisy M, Gandon S (2013) Evolution of virulence in emerging epidemics. PLoS Pathog 9:e1003209. 10.1371/journal.ppat.1003209 [DOI] [PMC free article] [PubMed] [Google Scholar]
- Bhatnagar J, Rabeneck DB, Martines RB, Reagan-Steiner S, Ermias Y, Estetter LB, Suzuki T, Ritter J, Keating MK, Hale G, Gary J, Muehlenbachs A, Lambert A, Lanciotti R, Oduyebo T, Meaney-Delman D, Bolaños F, Saad EA, Shieh WJ, Zaki SR (2017) Zika virus RNA replication and persistence in brain and placental tissue. Emerg Infect Dis 23:405–414. 10.3201/eid2303.161499 [DOI] [PMC free article] [PubMed] [Google Scholar]
- Brasil P, Pereira JP Jr, Moreira ME, Ribeiro Nogueira RM, Damasceno L, Wakimoto M, Rabello RS, Valderramos SG, Halai UA, Salles TS, Zin AA, Horovitz D, Daltro P, Boechat M, Raja Gabaglia C, Carvalho de Sequeira P, Pilotto JH, Medialdea-Carrera R, Cotrim da Cunha D, Abreu de Carvalho LM, et al. (2016) Zika virus infection in pregnant women in Rio De Janeiro. N Engl J Med 375:2321–2334. 10.1056/NEJMoa1602412 [DOI] [PMC free article] [PubMed] [Google Scholar]
- Cabrera OH, O'Connor SD, Swiney BS, Salinas-Contreras P, Manzella FM, Taylor GT, Noguchi KK (2017) Caffeine combined with sedative/anesthetic drugs triggers widespread neuroapoptosis in a mouse model of prematurity. J Matern Fetal Neonatal Med 30:2734–2741. 10.1080/14767058.2016.1261400 [DOI] [PMC free article] [PubMed] [Google Scholar]
- Cao-Lormeau VM, Blake A, Mons S, Lastère S, Roche C, Vanhomwegen J, Dub T, Baudouin L, Teissier A, Larre P, Vial AL, Decam C, Choumet V, Halstead SK, Willison HJ, Musset L, Manuguerra JC, Despres P, Fournier E, Mallet HP, et al. (2016) Guillain-Barré syndrome outbreak associated with Zika virus infection in French Polynesia: a case-control study. Lancet 387:1531–1539. 10.1016/S0140-6736(16)00562-6 [DOI] [PMC free article] [PubMed] [Google Scholar]
- Carod-Artal FJ. (2018) Neurological complications of Zika virus infection. Expert Rev Anti Infect Ther 16:399–410. 10.1080/14787210.2018.1466702 [DOI] [PubMed] [Google Scholar]
- Chimelli L, Avvad-Portari E (2018) Congenital Zika virus infection: a neuropathological review. Childs Nerv Syst 34:95–99. 10.1007/s00381-017-3651-3 [DOI] [PubMed] [Google Scholar]
- Clancy B, Kersh B, Hyde J, Darlington RB, Anand KJ, Finlay BL (2007) Web-based method for translating neurodevelopment from laboratory species to humans. Neuroinformatics 5:79–94. 10.1385/NI:5:1:79 [DOI] [PubMed] [Google Scholar]
- Costa VV, Del Sarto JL, Rocha RF, Silva FR, Doria JG, Olmo IG, Marques RE, Queiroz-Junior CM, Foureaux G, Araújo JMS, Cramer A, Real ALCV, Ribeiro LS, Sardi SI, Ferreira AJ, Machado FS, de Oliveira AC, Teixeira AL, Nakaya HI, Souza DG, et al. (2017) N-methyl-d-aspartate (NMDA) receptor blockade prevents neuronal death induced by Zika virus infection. MBio 8:e00350. 10.1128/mBio.00350-17 [DOI] [PMC free article] [PubMed] [Google Scholar]
- Creeley C, Dikranian K, Dissen G, Martin L, Olney J, Brambrink A (2013) Propofol-induced apoptosis of neurones and oligodendrocytes in fetal and neonatal rhesus macaque brain. Br J Anaesth 110:i29–38. 10.1093/bja/aet173 [DOI] [PMC free article] [PubMed] [Google Scholar]
- Davidson AJ, isma N, de Graaff JC, Withington DE, Dorris L, Bell G, Stargatt R, Bellinger DC, Schuster T, Arnup SJ, Hardy P, Hunt RW, Takagi MJ, Giribaldi G, Hartmann PL, Salvo I, Morton NS, von Ungern Sternberg BS, Locatelli BG, Wilton N, et al. (2016) Neurodevelopmental outcome at 2 years of age after general anaesthesia and awake-regional anaesthesia in infancy (GAS): an international multicentre, randomised controlled trial. Lancet 387:239–250. 10.1016/S0140-6736(15)00608-X [DOI] [PMC free article] [PubMed] [Google Scholar]
- de Paula Freitas B, de Oliveira Dias JR, Prazeres J, Sacramento GA, Ko AI, Maia M, Belfort R Jr (2016) Ocular findings in infants with microcephaly associated with presumed Zika virus congenital infection in Salvador, Brazil. JAMA Ophthalmol 134:529–535. 10.1001/jamaophthalmol.2016.0267 [DOI] [PMC free article] [PubMed] [Google Scholar]
- de Graaf-Peters VB, Hadders-Algra M (2006) Ontogeny of the human central nervous system: what is happening when? Early Hum Dev 82:257–266. 10.1016/j.earlhumdev.2005.10.013 [DOI] [PubMed] [Google Scholar]
- de Oliveira WK, Carmo EH, Henriques CM, Coelho G, Vazquez E, Cortez-Escalante J, Molina J, Aldighieri S, Espinal MA, Dye C (2017a) Zika virus infection and associated neurologic disorders in Brazil. N Engl J Med 376:1591–1593. 10.1056/NEJMc1608612 [DOI] [PMC free article] [PubMed] [Google Scholar]
- de Oliveira WK, de França GVA, Carmo EH, Duncan BB, de Souza Kuchenbecker R, Schmidt MI (2017b) Infection-related microcephaly after the 2015 and 2016 Zika virus outbreaks in Brazil: a surveillance-based analysis. Lancet 390:861–870. 10.1016/S0140-6736(17)31368-5 [DOI] [PubMed] [Google Scholar]
- DeOlmos JS, Ingram WR (1971) An improved cupric-silver method for impregnation of axonal and terminal degeneration. Brain Res 33:523–529. 10.1016/0006-8993(71)90130-2 [DOI] [PubMed] [Google Scholar]
- Duggal NK, Ritter JM, McDonald EM, Romo H, Guirakhoo F, Davis BS, Chang GJ, Brault AC (2017) Differential neurovirulence of African and Asian genotype Zika virus isolates in outbred immunocompetent mice. Am J Trop Med Hyg 97:1410–1417. 10.4269/ajtmh.17-0263 [DOI] [PMC free article] [PubMed] [Google Scholar]
- Everett H, McFadden G (1999) Apoptosis: an innate immune response to virus infection. Trends Microbiol 7:160–165. 10.1016/S0966-842X(99)01487-0 [DOI] [PubMed] [Google Scholar]
- Fornito A, Zalesky A, Breakspear M (2015) The connectomics of brain disorders. Nat Rev Neurosci 16:159–172. 10.1038/nrn3901 [DOI] [PubMed] [Google Scholar]
- Frieden T, Bonds M, Pope A, Lurie N, Ehlinger E, McCabe E, McKay B, Joseph A, Edwards E, Stobbe M, Boyle M (2016) Transcript for CDC telebriefing: Zika summit press conference, April 1 2016. Atlanta, GA: Centers for Disease Control and Prevention. [Google Scholar]
- Gaburro J, Bhatti A, Sundaramoorthy V, Dearnley M, Green D, Nahavandi S, Paradkar PN, Duchemin JB (2018) Zika virus-induced hyper excitation precedes death of mouse primary neuron. Virol J 15:79. 10.1186/s12985-018-0989-4 [DOI] [PMC free article] [PubMed] [Google Scholar]
- Goel MK, Khanna P, Kishore J (2010) Understanding survival analysis: Kaplan–Meier estimate. Int J Ayurveda Res 1:274–278. 10.4103/0974-7788.76794 [DOI] [PMC free article] [PubMed] [Google Scholar]
- Honein MA, Dawson AL, Petersen EE, Jones AM, Lee EH, Yazdy MM, Ahmad N, Macdonald J, Evert N, Bingham A, Ellington SR, Shapiro-Mendoza CK, Oduyebo T, Fine AD, Brown CM, Sommer JN, Gupta J, Cavicchia P, Slavinski S, White JL, et al. (2017) Birth defects among fetuses and infants of US women with evidence of possible Zika virus infection during pregnancy. JAMA 317:59–68. 10.1001/jama.2016.19006 [DOI] [PubMed] [Google Scholar]
- Ishimaru MJ, Ikonomidou C, Tenkova TI, Der TC, Dikranian K, Sesma MA, Olney JW (1999) Distinguishing excitotoxic from apoptotic neurodegeneration in the developing rat brain. J Comp Neurol 408:461–476. [DOI] [PubMed] [Google Scholar]
- Jaenisch T, Rosenberger KD, Brito C, Brady O, Brasil P, Marques ET (2017) Risk of microcephaly after Zika virus infection in Brazil, 2015 to 2016. Bull World Health Organ 95:191–198. 10.2471/BLT.16.178608 [DOI] [PMC free article] [PubMed] [Google Scholar]
- Kidokoro H, de Vries LS, Ogawa C, Ito Y, Ohno A, Groenendaal F, Saitoh S, Okumura A, Ito Y, Natsume J (2017) Predominant area of brain lesions in neonates with herpes simplex encephalitis. J Perinatol 37:1210–1214. 10.1038/jp.2017.114 [DOI] [PubMed] [Google Scholar]
- Lazear HM, Govero J, Smith AM, Platt DJ, Fernandez E, Miner JJ, Diamond MS (2016) A mouse model of Zika virus pathogenesis. Cell Host Microbe 19:720–730. 10.1016/j.chom.2016.03.010 [DOI] [PMC free article] [PubMed] [Google Scholar]
- Lein ES, Hawrylycz MJ, Ao N, Ayres M, Bensinger A, Bernard A, Boe AF, Boguski MS, Brockway KS, Byrnes EJ, Chen L, Chen L, Chen TM, Chin MC, Chong J, Crook BE, Czaplinska A, Dang CN, Datta S, Dee NR, et al. (2007) Genome-wide atlas of gene expression in the adult mouse brain. Nature 445:168–176. 10.1038/nature05453 [DOI] [PubMed] [Google Scholar]
- Lewis ML, Culbertson WW, Post JD, Miller D, Kokame GT, Dix RD (1989) Herpes simplex virus type 1. A cause of the acute retinal necrosis syndrome. Ophthalmology 96:875–878. 10.1016/S0161-6420(89)32823-5 [DOI] [PubMed] [Google Scholar]
- Lindquist MA, Mejia A (2015) Zen and the art of multiple comparisons. Psychosom Med 77:114–125. 10.1097/PSY.0000000000000148 [DOI] [PMC free article] [PubMed] [Google Scholar]
- McDonald JW, Johnston MV (1990) Physiological and pathophysiological roles of excitatory amino acids during central nervous system development. Brain Res Brain Res Rev 15:41–70. 10.1016/0165-0173(90)90011-C [DOI] [PubMed] [Google Scholar]
- Melo AS, Aguiar RS, Amorim MM, Arruda MB, Melo FO, Ribeiro ST, Batista AG, Ferreira T, Dos Santos MP, Sampaio VV, Moura SR, Rabello LP, Gonzaga CE, Malinger G, Ximenes R, de Oliveira-Szejnfeld PS, Tovar-Moll F, Chimelli L, Silveira PP, Delvechio R, et al. (2016) Congenital Zika virus infection: beyond neonatal microcephaly. JAMA Neurol 73:1407–1416. 10.1001/jamaneurol.2016.3720 [DOI] [PubMed] [Google Scholar]
- Meneses JD, Ishigami AC, de Mello LM, de Albuquerque LL, de Brito CAA, Cordeiro MT, Pena LJ (2017) Lessons learned at the epicenter of Brazil's congenital Zika epidemic: evidence from 87 confirmed cases. Clin Infect Dis 64:1302–1308. 10.1093/cid/cix166 [DOI] [PubMed] [Google Scholar]
- Miner JJ, Cao B, Govero J, Smith AM, Fernandez E, Cabrera OH, Garber C, Noll M, Klein RS, Noguchi KK, Mysorekar IU, Diamond MS (2016a) Zika virus infection during pregnancy in mice causes placental damage and fetal demise. Cell 165:1081–1091. 10.1016/j.cell.2016.05.008 [DOI] [PMC free article] [PubMed] [Google Scholar]
- Miner JJ, Sene A, Richner JM, Smith AM, Santeford A, Ban N, Weger-Lucarelli J, Manzella F, Rückert C, Govero J, Noguchi KK, Ebel GD, Diamond MS, Apte RS (2016b) Zika virus infection in mice causes panuveitis with shedding of virus in tears. Cell Rep 16:3208–3218. 10.1016/j.celrep.2016.08.079 [DOI] [PMC free article] [PubMed] [Google Scholar]
- Nem de Oliveira Souza I, Frost PS, França JV, Nascimento-Viana JB, Neris RLS, Freitas L, Pinheiro DJLL, Nogueira CO, Neves G, Chimelli L, De Felice FG, Cavalheiro ÉA, Ferreira ST, Assunção-Miranda I, Figueiredo CP, Da Poian AT, Clarke JR (2018) Acute and chronic neurological consequences of early-life Zika virus infection in mice. Sci Transl Med 10:eaar2749. 10.1126/scitranslmed.aar2749 [DOI] [PubMed] [Google Scholar]
- Ng W, Soto-Acosta R, Bradrick S, Garcia-Blanco M, Ooi E (2017) The 5′ and 3′ untranslated regions of the flaviviral genome. Viruses 9:137. 10.3390/v9060137 [DOI] [PMC free article] [PubMed] [Google Scholar]
- Noguchi KK. (2001) NMDA antagonist induced neurotoxicity and psychosis: the dissociative stimulation hypothesis. In: Handbook of neurotoxicology, Vol 2 (Massaro E, ed), pp 1582–1592. Totowa, NJ: Humana. [Google Scholar]
- Noguchi KK, Nemmers B, Farber NB (2005) Age has a similar influence on the susceptibility to NMDA antagonist-induced neurodegeneration in most brain regions. Brain Res Dev Brain Res 158:82–91. 10.1016/j.devbrainres.2005.06.006 [DOI] [PubMed] [Google Scholar]
- Noguchi KK, Walls KC, Wozniak DF, Olney JW, Roth KA, Farber NB (2008) Acute neonatal glucocorticoid exposure produces selective and rapid cerebellar neural progenitor cell apoptotic death. Cell Death Differ 15:1582–1592. 10.1038/cdd.2008.97 [DOI] [PMC free article] [PubMed] [Google Scholar]
- Olmo IG, Carvalho TG, Costa VV, Alves-Silva J, Ferrari CZ, Izidoro-Toledo TC, da Silva JF, Teixeira AL, Souza DG, Marques JT, Teixeira MM, Vieira LB, Ribeiro FM (2017) Zika virus promotes neuronal cell death in a non-cell autonomous manner by triggering the release of neurotoxic factors. Front Immunol 8:1016. 10.3389/fimmu.2017.01016 [DOI] [PMC free article] [PubMed] [Google Scholar]
- Rasmussen SA, Jamieson DJ, Honein MA, Petersen LR (2016) Zika virus and birth defects: reviewing the evidence for causality. N Engl J Med 374:1981–1987. 10.1056/NEJMsr1604338 [DOI] [PubMed] [Google Scholar]
- Rice ME, Galang RR, Roth NM, Ellington SR, Moore CA, Valencia-Prado M, Ellis EM, Tufa AJ, Taulung LA, Alfred JM, Pérez-Padilla J, Delgado-López CA, Zaki SR, Reagan-Steiner S, Bhatnagar J, Nahabedian JF 3rd, Reynolds MR, Yeargin-Allsopp M, Viens LJ, Olson SM, et al. (2018) Vital signs: Zika-associated birth defects and neurodevelopmental abnormalities possibly associated with congenital Zika virus infection: U.S. territories and freely associated states, 2018. MMWR Morb Mortal Wkly Rep 67:858–867. 10.15585/mmwr.mm6731e1 [DOI] [PMC free article] [PubMed] [Google Scholar]
- Rich JT, Neely JG, Paniello RC, Voelker CC, Nussenbaum B, Wang EW (2010) A practical guide to understanding Kaplan–Meier curves. Otolaryngol Head Neck Surg 143:331–336. 10.1016/j.otohns.2010.05.007 [DOI] [PMC free article] [PubMed] [Google Scholar]
- Saad T, PennaeCosta AA, de Góes FV, de Freitas M, de Almeida JV, de Santa Ignêz LJ, Amancio AP, Alvim RJ, Antunes Kramberger LA (2018) Neurological manifestations of congenital Zika virus infection. Childs Nerv Syst 34:73–78. 10.1007/s00381-017-3634-4 [DOI] [PubMed] [Google Scholar]
- Sengul G, Watson C (2015) Ascending and descending pathways in the spinal cord. In: The rat nervous system, pp 115–130. London: Academic. [Google Scholar]
- Torvik A. (1956) Transneuronal changes in the inferior olive and pontine nuclei in kittens. J Neuropathol Exp Neurol 15:119–145. 10.1097/00005072-195604000-00001 [DOI] [PubMed] [Google Scholar]
- Tripathi S, Balasubramaniam VR, Brown JA, Mena I, Grant A, Bardina SV, Maringer K, Schwarz MC, Maestre AM, Sourisseau M, Albrecht RA, Krammer F, Evans MJ, Fernandez-Sesma A, Lim JK, García-Sastre A (2017) A novel Zika virus mouse model reveals strain specific differences in virus pathogenesis and host inflammatory immune responses. PLoS Pathog 13:e1006258. 10.1371/journal.ppat.1006258 [DOI] [PMC free article] [PubMed] [Google Scholar]
- Trumpy JH. (1971) Transneuronal degeneration in the pontine nuclei of the cat: I. Neuronal changes in animals of varying ages. II. The glial proliferation. Ergeb Anat Entwicklungsgesch 44:3–72. [PubMed] [Google Scholar]
- Tsetsarkin KA, Kenney H, Chen R, Liu G, Manukyan H, Whitehead SS, Laassri M, Chumakov K, Pletnev AG (2016) A full-length infectious cDNA clone of Zika virus from the 2015 epidemic in Brazil as a genetic platform for studies of virus-host interactions and vaccine development. MBio 7:e01114. 10.1128/mBio.01114-16 [DOI] [PMC free article] [PubMed] [Google Scholar]
- van den Pol AN, Mao G, Yang Y, Ornaghi S, Davis JN (2017) Zika virus targeting in the developing brain. J Neurosci 37:2161–2175. 10.1523/JNEUROSCI.3124-16.2017 [DOI] [PMC free article] [PubMed] [Google Scholar]
- van der Linden H Jr, Carvalho MD, van der Linden V, Lacerda KM, Pessoa A, Carneiro ML, Cordeiro MT, Valente KD (2018) Epilepsy profile in infants with congenital Zika virus infection. N Engl J Med 379:891–892. 10.1056/NEJMc1716070 [DOI] [PubMed] [Google Scholar]
- van der Linden V, Filho EL, Lins OG, van der Linden A, Aragão Mde F, Brainer-Lima AM, Cruz DD, Rocha MA, Sobral da Silva PF, Carvalho MD, do Amaral FJ, Gomes JA, Ribeiro de Medeiros IC, Ventura CV, Ramos RC (2016a) Congenital Zika syndrome with arthrogryposis: retrospective case series study. BMJ 354:i3899. [DOI] [PMC free article] [PubMed] [Google Scholar]
- van der Linden V, Pessoa A, Dobyns W, Barkovich AJ, Júnior HV, Filho EL, Ribeiro EM, Leal M de C, Coimbra PP, Aragão MF, Verçosa I, Ventura C, Ramos RC, Cruz DD, Cordeiro MT, Mota VM, Dott M, Hillard C, Moore CA (2016b) Description of 13 infants born during october 2015-january 2016 with congenital Zika virus infection without microcephaly at birth: Brazil. MMWR Morb Mortal Wkly Rep 65:1343–1348. 10.15585/mmwr.mm6547e2 [DOI] [PubMed] [Google Scholar]
- Ventura CV, Maia M, Ventura BV, Linden VV, Araújo EB, Ramos RC, Rocha MA, Carvalho MD, Belfort R Jr, Ventura LO (2016) Ophthalmological findings in infants with microcephaly and presumable intra-uterus Zika virus infection. Arq Bras Oftalmol 79:1–3. 10.5935/0004-2749.20160002 [DOI] [PubMed] [Google Scholar]
- Ventura LO, Ventura C V, Dias NC, Vilar IG, Gois AL, Arantes TE, Fernandes LC, Chiang MF, Miller MT, Lawrence L (2018) Visual impairment evaluation in 119 children with congenital Zika syndrome. J AAPOS 22:218–222.e1. 10.1016/j.jaapos.2018.01.009 [DOI] [PMC free article] [PubMed] [Google Scholar]
- Workman AD, Charvet CJ, Clancy B, Darlington RB, Finlay BL (2013) Modeling transformations of neurodevelopmental sequences across mammalian species. J Neurosci 33:7368–7383. 10.1523/JNEUROSCI.5746-12.2013 [DOI] [PMC free article] [PubMed] [Google Scholar]
- Yuan L, Huang XY, Liu ZY, Zhang F, Zhu XL, Yu JY, Ji X, Xu YP, Li G, Li C, Wang HJ, Deng YQ, Wu M, Cheng ML, Ye Q, Xie DY, Li XF, Wang X, Shi W, Hu B, et al. (2017) A single mutation in the prM protein of Zika virus contributes to fetal microcephaly. Science 358:933–936. 10.1126/science.aam7120 [DOI] [PubMed] [Google Scholar]