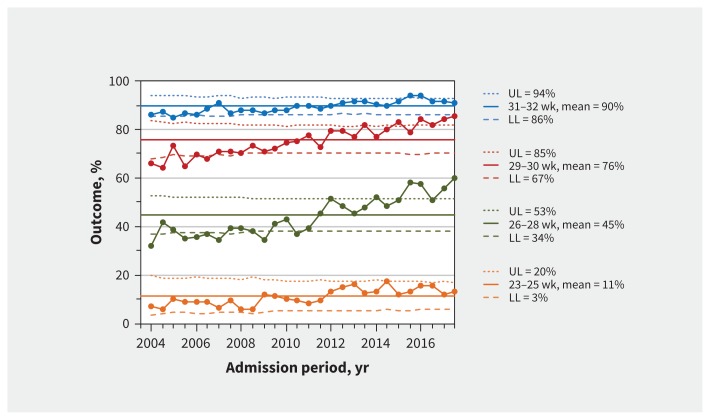
Figure 2:
Survival to discharge without major morbidity. Process-control charts for survival to discharge without major morbidity by gestational age group. Means (solid lines) and upper (UL) and lower (LL) control limits (dotted and dashed lines) are calculated using 2004–2017 data. Margins of the limits were recalculated for each period based on the number of infants per 6-month period, and the reported UL and LL correspond to the first 6 months of 2004. Large dots show the percentage of infants admitted each 6-month period who survived without major morbidity. The percentages are among all infants within the gestational age group. The total numbers of infants in each group are 6265 for 23–25 weeks, 13 157 for 26–28 weeks, 12 868 for 29–30 weeks and 18 541 for 31–32 weeks. The median (range) numbers of infants for each 6-month period are 229 (137–294) for 23–25 weeks, 485 (353–532) for 26–28 weeks, 490 (253–550) for 29–30 weeks and 700 (440–820) for 31–32 weeks.

