Abstract
What individual differences in neural activity predict the future escalation of alcohol drinking from casual to compulsive? The neurobiological mechanisms that gate the transition from moderate to compulsive drinking remain poorly understood. We longitudinally tracked the development of compulsive drinking across a binge-drinking experience in male mice. Binge drinking unmasked individual differences, revealing latent traits in alcohol consumption and compulsive drinking despite equal prior exposure to alcohol. Distinct neural activity signatures of cortical neurons projecting to the brainstem before binge drinking predicted the ultimate emergence of compulsivity. Mimicry of activity patterns that predicted drinking phenotypes was sufficient to bidirectionally modulate drinking. Our results provide a mechanistic explanation for individual variance in vulnerability to compulsive alcohol drinking.
More than 80% of adults are exposed to alcohol during their lifetime (1), yet less than 30% will develop an alcohol use disorder (AUD) (2). How exposure to alcohol can produce such disparate outcomes between individuals remains poorly understood.
Compulsive alcohol drinking, defined as continued drinking in the face of a negative consequence (3, 4), is a distinguishing feature of AUDs (5). The medial prefrontal cortex (mPFC) is critical in mediating pathological drug-seeking behaviors, including compulsion (6–10). Both preexisting (11–13) and alcohol-induced changes in PFC function can contribute to maladaptive behaviors including compulsive drinking (14–17). Although rodent models have advanced our understanding of drinking behavior (14,18–21), neural correlates are typically assessed at a single end point, after long-term exposure to alcohol, thereby occluding individual differences in compulsion vulnerability as well as the longitudinal nature of its development.
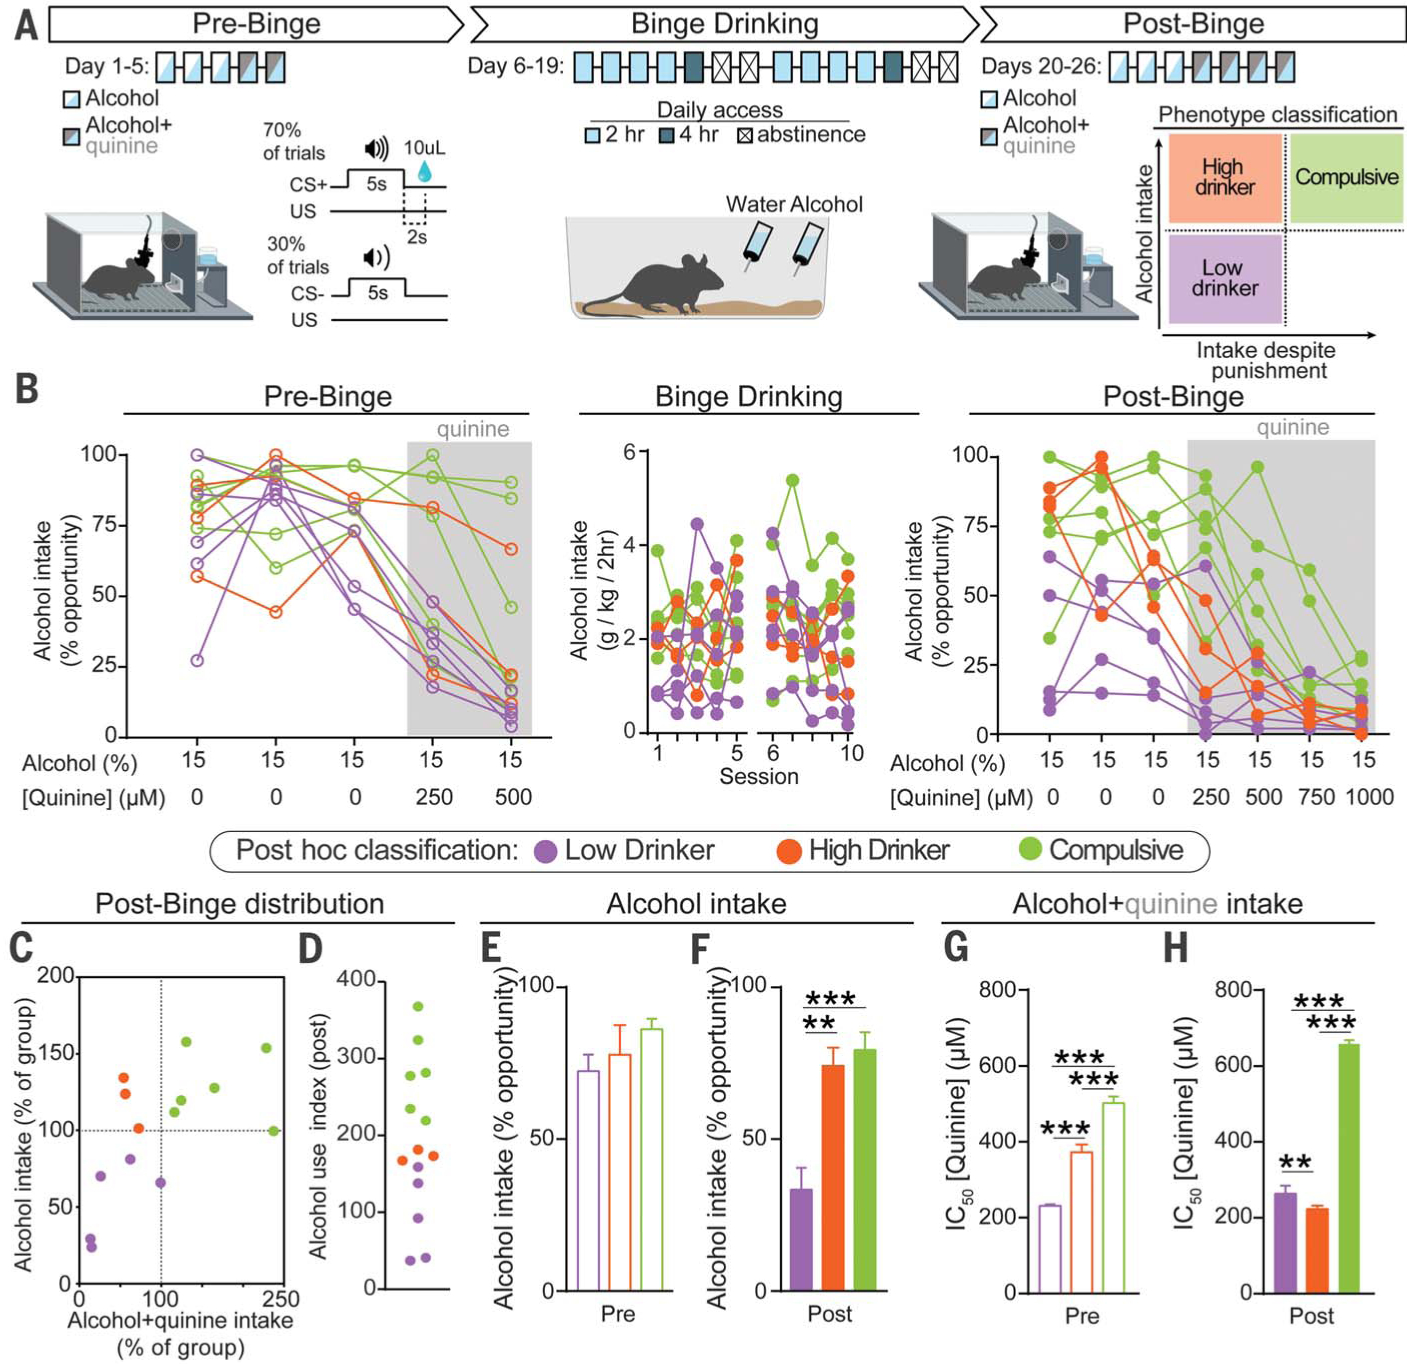
We developed a “binge-induced compulsion task” (BICT) to assess how predisposition interacts with experience to produce compulsive drinking (Fig. 1A). Initially, an auditory conditioned stimulus (CS+) predicted delivery of sucrose until animals reliably responded (see the materials and methods). During pre-binge (days 1 to 3), the CS+ predicted delivery of alcohol alone (15%). On days 4 to 5, increasing concentrations of quinine, a bitter tastant used as a punishment (3), were added to the alcohol (alcohol+quinine). During binge drinking (days 6 to 19), animals had unlimited access to water and alcohol for 0, 2, or 4 hours per day, producing high, “binge-like” levels of alcohol intake (22). During post-binge (days 20 to 26), animals returned to the pre-binge conditioning context, in which alcohol alone was presented for 3 days, followed by alcohol+quinine for the next 4 days (Fig. 1A). Intake volumes correlated with blood alcohol content (fig. S1).
Fig. 1. Binge-induced compulsion task (BICT) for tracking the emergence of individual differences in compulsive alcohol drinking.

(A) Schematic of the BICT. (B) Individual animals’ alcohol consumption. (C) Normalized distributions of alcohol and alcohol+quinine consumption during the post-binge conditioning phase plotted to classify each animal’s alcohol-drinking phenotype, which was applied post hoc to the dataset. (D) Alcohol use index. (E) Average performance across the pre-binge alcohol-only sessions (days 1 to 3) did not differ between groups [one-way analysis of variance (ANOVA), F(2,11) = 1.922, p = 0.19]. (F) During post-binge conditioning sessions, high drinkers and compulsive animals consumed more alcohol (one-way ANOVA, F(2,11) = 15.41, p = 0.0006). (G) Concentration required to produce an IC50 calculated from pre-binge conditioning data (one-way ANOVA, F(2,11) = 430.3, p < 0.0001). (H) After binge drinking, compulsive animals exhibited robust punishment-resistant alcohol intake compared with both low and high drinkers (one-way ANOVA, F(2,11) = 1298.0, p < 0.0001). All post hoc comparisons used Tukey’s test: **p < 0.01; ***p < 0.001. Error bars indicate ± SEM.
The BICT allows for longitudinal assessment of two behavioral outcomes associated with diagnostic criteria for AUDs (5): alcohol consumption and continued consumption despite negative outcomes. After binge drinking, there were wide individual differences in drinking, both in the absence and presence of quinine (Fig. 1B). Three phenotypic classifications were made based on post-binge behavior: mice that displayed low alcohol intake with and without punishment were termed “low drinkers”; mice that showed high levels of alcohol drinking but were sensitive to punishment were termed “high drinkers”; mice with high levels of drinking that persisted with punishment were termed “compulsive” (Fig. 1C). Values from the alcohol-only and alcohol+quinine distributions were summed to create an “alcohol use index” for each animal (Fig. 1D).
Each animal was classified on the basis of its behavior during post-binge and designation was retroactively applied. Mice that were eventually divided into the three subgroups showed no detectable differences in unadulterated alcohol intake before binge drinking (Fig. 1E). After binge drinking, low drinkers’ intake decreased, even in the absence of punishment (Fig. 1F and fig. S2D). Before binge drinking, compulsive animals showed greater resistance to punishment than both low and high drinkers, as measured by the concentration of quinine required to produce a half-maximal effect on alcohol consumption [half-maximal inhibitory concentration (IC50); Fig. 1G and fig. S2E]. After binge drinking, this phenotype was exacerbated as compulsive animals showed a robust insensitivity to punishment (Fig. 1H and fig. S2F). Longitudinal examination highlighted a substantial divergence among groups when punishment was present: high drinkers showed increased sensitivity to quinine’s effects on alcohol intake after binge drinking, whereas compulsive animals showed decreased sensitivity (fig. S2G). There were no group differences in alcohol consumption during binge drinking (fig. S2H).
To determine whether phenotypic differences in drinking reflected responses to punishment in general and were not driven by quinine-specific effects, we punished alcohol consumption with foot shock (fig. S3A). Phenotypic drinking behavior was retained, demonstrating that these behavioral traits are reproducible and generalizable (fig S3, B and C).
We reasoned that mPFC circuits involved in “top-down” control of avoidance behavior may underlie susceptibility to developing compulsive drinking behaviors. The periaqueductal gray (PAG) is involved in responding to aversive events (23–27), as well as negative affective states and hyperalgesia during alcohol withdrawal (28, 29). mPFC neurons projecting to dorsal PAG (mPFC-dPAG) encode aversive events (24). We hypothesized that functional deficits in mPFC-dPAG neurons could disrupt aversive processing to drive compulsive drinking.
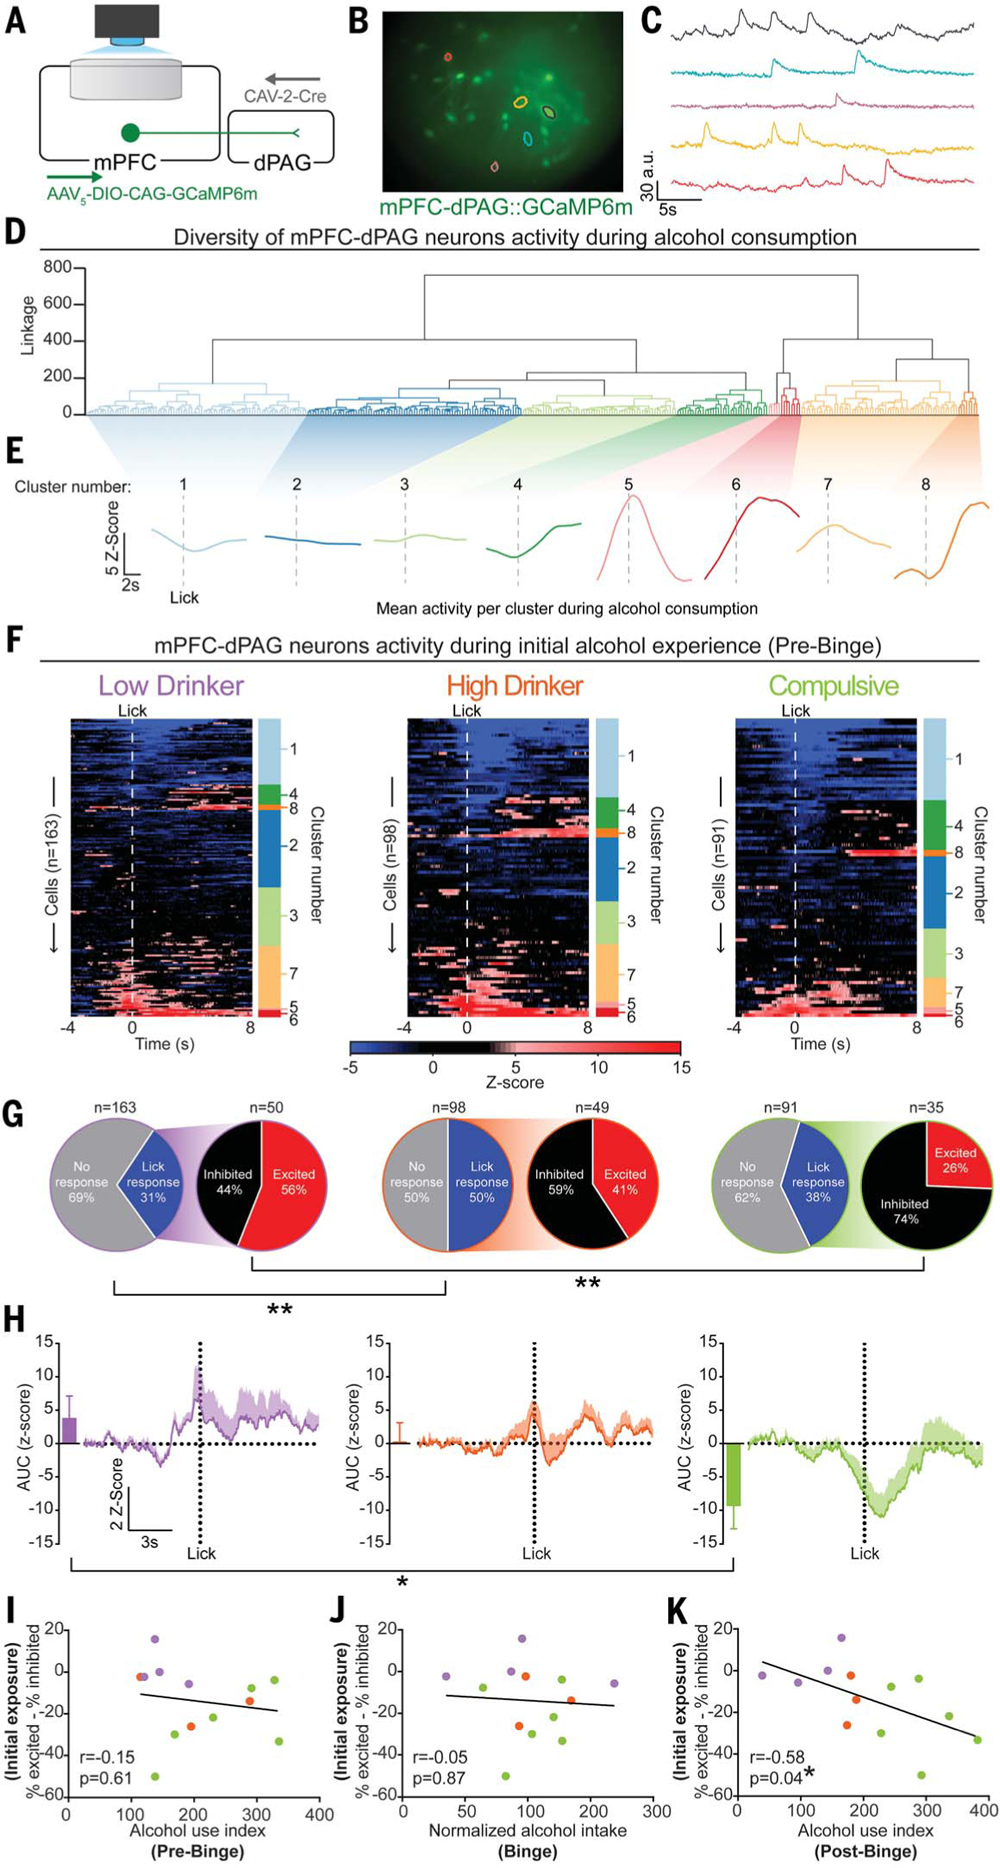
We used cellular-resolution calcium imaging (30) to visualize the activity of mPFC-dPAG neurons during the BICT (Fig. 2). An anterogradely traveling virus allowing for cre-dependent expression of GCaMP6m was injected in the mPFC and a retrogradely traveling virus carrying cre-recombinase was injected into the dPAG (Fig. 2A). A gradient-refractive index lens (fig. S4) and a head-mounted microendoscope allowed observation of calcium dynamics. An example field of view illustrates neurons imaged during the BICT (Fig. 2B) and extracted activity traces (Fig. 2C). Hierarchical clustering performed on activity from 352 neurons aligned around initiation of alcohol consumption during the first pre-binge session revealed eight distinct clusters (Fig. 2, D and E).
Fig. 2. Activity in mPFC-dPAG neurons during initial experience with alcohol is a vulnerability marker for future alcohol abuse-like behaviors.

(A) Monitoring mPFC-dPAG activity using in vivo calcium imaging. (B and C) Field of view (B) and activity traces (C) from example cells. (D) Agglomerative hierarchical clustering of calcium activity traces during the first session of pre-binge (n = 13 animals, 352 cells). (E) Smoothed and averaged peristimulus time histograms per cluster. (F) Cluster designations are to the right of each neuron’s heatmap of z-scored trial-averaged activity. (G) Differences in distributions of activity during alcohol consumption (Fisher’s exact test: **p < 0.01). (H) Population activity from lick-responsive neurons. Inset: Area under the curve (AUC) for each trace (one-way ANOVA, F(2,10) = 4.531, *p = 0.039; Tukey’s post hoc test, *p < 0.05). (I to K) Balance of excitatory-inhibitory activity during alcohol consumption in the first pre-binge session plotted against each animal’s alcohol use index. No correlation between the excitation-inhibition balance during initial exposure and alcohol use index from pre-binge data (I) or from binge drinking (J). (K) Increased inhibitory activity during alcohol consumption during initial exposure predicted heightened pathological-like drinking behaviors during post-binge. Error bars indicate ± SEM.
Although there was no difference between groups in alcohol intake during the “alcohol-only” sessions throughout pre-binge, dynamics of mPFC-dPAG neurons during alcohol consumption differed between the phenotypic groups (Fig. 2F). During the initial alcohol experience (day 1), more mPFC-dPAG neurons exhibited inhibitory responses for compulsive animals than for low drinkers (Fig. 2G). mPFC-dPAG neurons displayed more excitatory activity in low drinkers than in compulsive animals during alcohol consumption (Fig. 2H). A small proportion of mPFC-dPAG neurons displayed responses to the alcohol-predictive cue (CS+) (fig. S5).
Although there were no detectable differences among groups in behavioral performance during initial alcohol exposure (Fig. 1, B and E), the neural response during initial exposure predicted the future development of compulsive drinking (Fig. 2, F to H). The proportion of excitatory to inhibitory responses of individual mPFC-dPAG neurons for each animal did not correlate with behavior during pre-binge (Fig. 2I) or binge drinking (Fig. 2J), but did correlate with post-binge behavior >2 weeks after the neural recordings during initial exposure were collected (Fig. 2K). A support-vector machine decoded future behavioral selection of drinking (go) versus not drinking (no go) based on the activity of mPFC-dPAG neurons during consumption of alcohol on the previous trial (fig. S6). This supports the notion that this circuit plays a key role in triggering the transition from moderate to compulsive drinking.
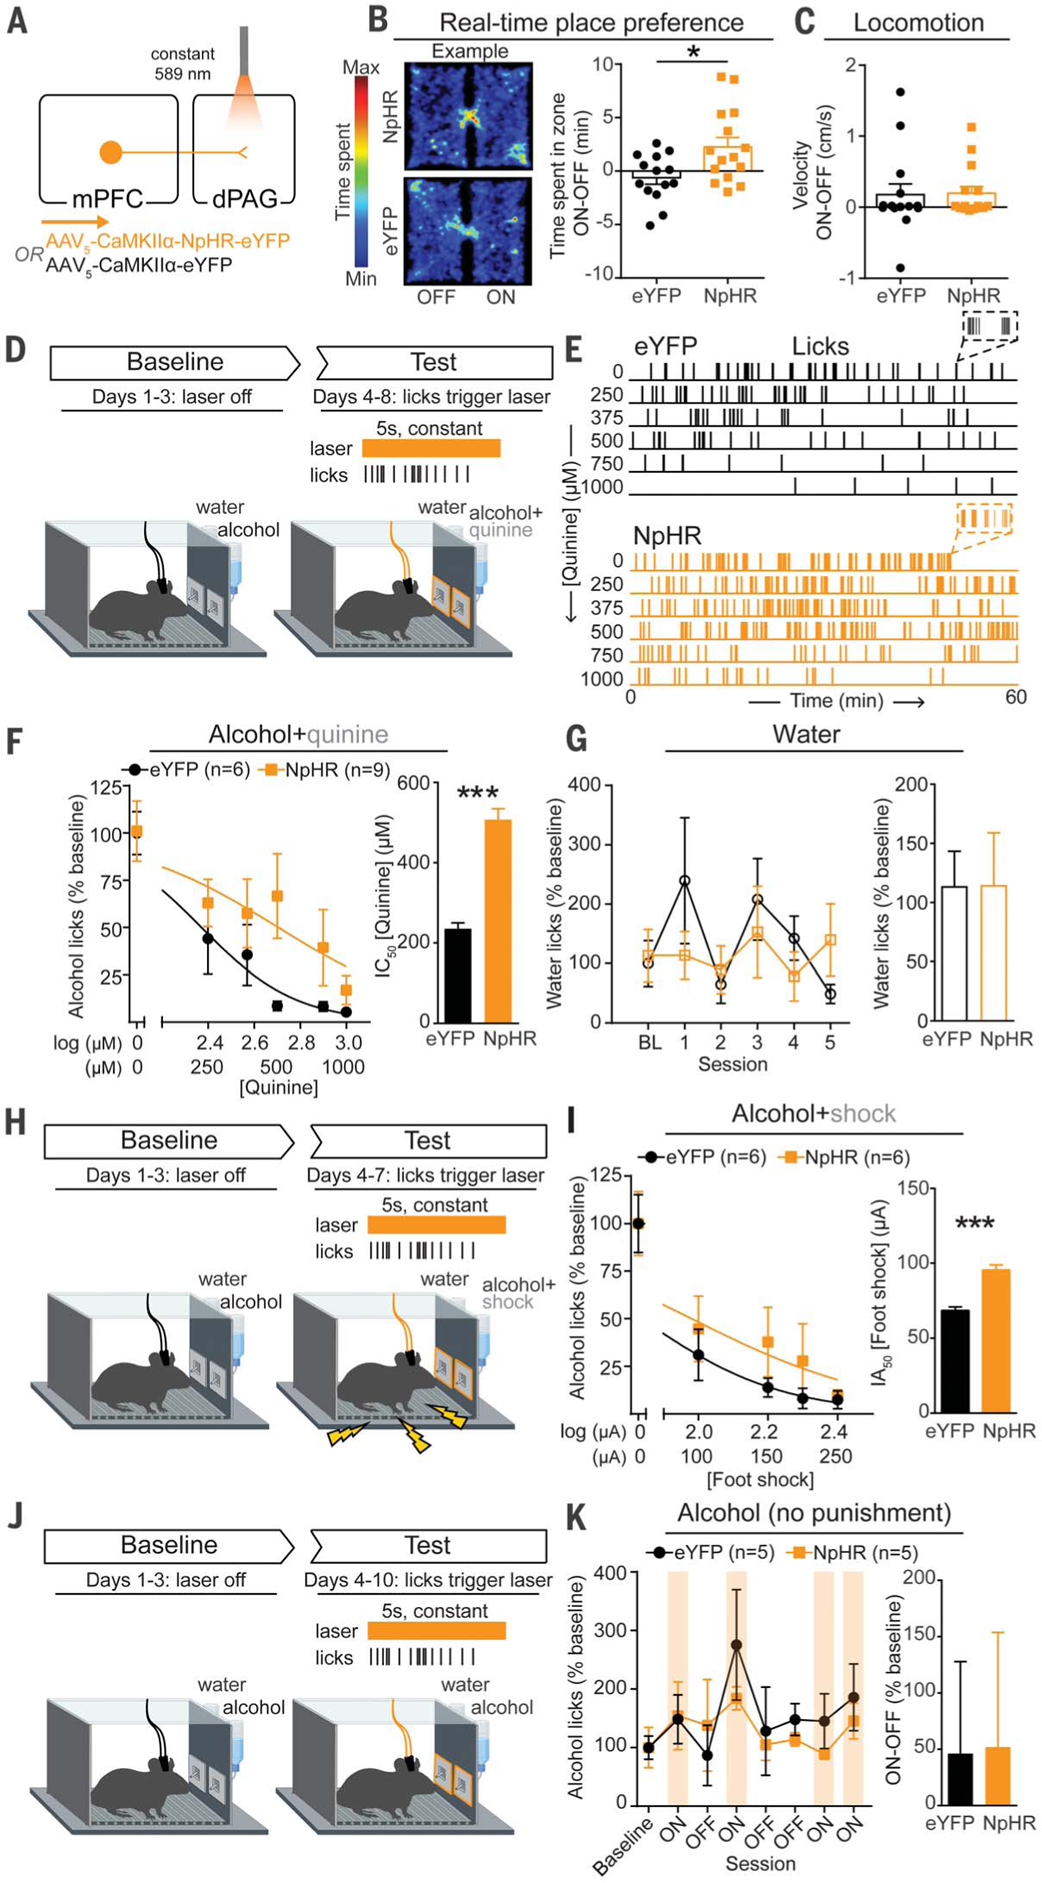
To test whether mimicking endogenous activity could alter behavior, we bilaterally expressed halorhodopsin (NpHR) in mPFC neurons and implanted bilateral optic fibers over the dPAG (Fig. 3A and fig. S7). In a real-time place preference assay, NpHR mice displayed modest preference for the photoinhibition-paired side of the chamber compared with fluorophore [enhanced yellow fluorescent protein (eYFP)]-expressing control mice (Fig. 3B). Photoinhibition did not produce any detectable changes in locomotion (Fig. 3C) or anxiety-related behavior (fig. S8, A to F).
Fig. 3. Inhibition of mPFC-dPAG neurons drives compulsive drinking but does not alter drinking in the absence of punishment.

(A) Strategy to inhibit mPFC terminals in the dPAG. (B) Inhibition of mPFC terminals in the dPAG was preferred in a real-time place preference task (unpaired t test, t(27) = 2.647, *p = 0.013). (C) Photoinhibition did not alter locomotion (unpaired t test, t(27) = 0.1191, p = 0.91). (D) On test days, water or alcohol spout contacts triggered a photoinhibition period. During the test, the quinine concentration was increased across days (alcohol bottle only). (E) Example alcohol lick event records. (F) The concentration of quinine required to decrease alcohol spout licking to 50% of baseline (IC50) was greater in NpHR animals (unpaired t test, t(13) =22.05, ***p < 0.0001). (G) No difference in licking for water between groups (unpaired t test, t(13) = 0.016, p = 0.99). (H) Alcohol drinking punished with foot shock. (I) Foot-shock amplitude required to attenuate alcohol spout licks by 50% of baseline [half-maximal inhibitory amplitude (IA50)] was increased in NpHR animals (unpaired t test, t(10) = 6.498, ***p < 0.0001). (J) Alcohol drinking in the absence of punishment. (K) Photoinhibition did not alter licking for alcohol in the absence of punishment (unpaired t test, t(8) = 0.045, p = 0.97). Error bars indicate ± SEM.
Animals were given concurrent access to alcohol and water for three sessions to establish a baseline level of alcohol intake (Fig. 3D). On day 4, quinine was added to the alcohol bottle only, and the quinine concentration was increased across sessions to assess alcohol intake in the face of punishment (Fig. 3E). During quinine sessions, contacts on water or alcohol lickometers triggered photoinhibition, intended to mimic the inhibitory activity observed in compulsive animals during alcohol licking (Fig. 2H). Photoinhibition concomitant with licking for the alcohol+quinine solution was sufficient to induce a rightward shift in the quinine concentration response curve, resulting in a greater than twofold increase in the IC50 of quinine compared with eYFP controls (Fig. 3F) without affecting water consumption (Fig. 3G). When alcohol spout contacts were punished with foot shock (Fig. 3H), photoinhibition again promoted compulsive drinking (Fig. 3I and fig. S9, A and B).
To determine whether photoinhibition of mPFC-dPAG activity drives compulsive drinking by increased reinforcing effects of alcohol or decreased sensitivity to punishment, we measured each component in isolation. Photoinhibition did not change alcohol consumption in the absence of punishment (Fig. 3, J and K, and fig. S9, C and D). To determine whether photoinhibition altered responses to noxious stimuli in the absence of reward, we photoinhibited mPFC-dPAG synapses while animals’ tails were immersed in 50°C water and found that photoinhibition slowed latency to withdraw (fig. S8, J to L). Photoinhibition did not support intracranial self-stimulation (fig. S8, G to I) and did not alter extinction of operant alcohol self-administration (fig. S10). We posit that photoinhibition drives compulsive drinking by disrupting the transmittance of a punishment signal from the mPFC to the dPAG. Whereas this circuit encodes the aversive aspects of stimuli (24), it does not appear to be specific to pain, given that quinine functions as a punishment but is not a nociceptive stimulus (Fig. 3).
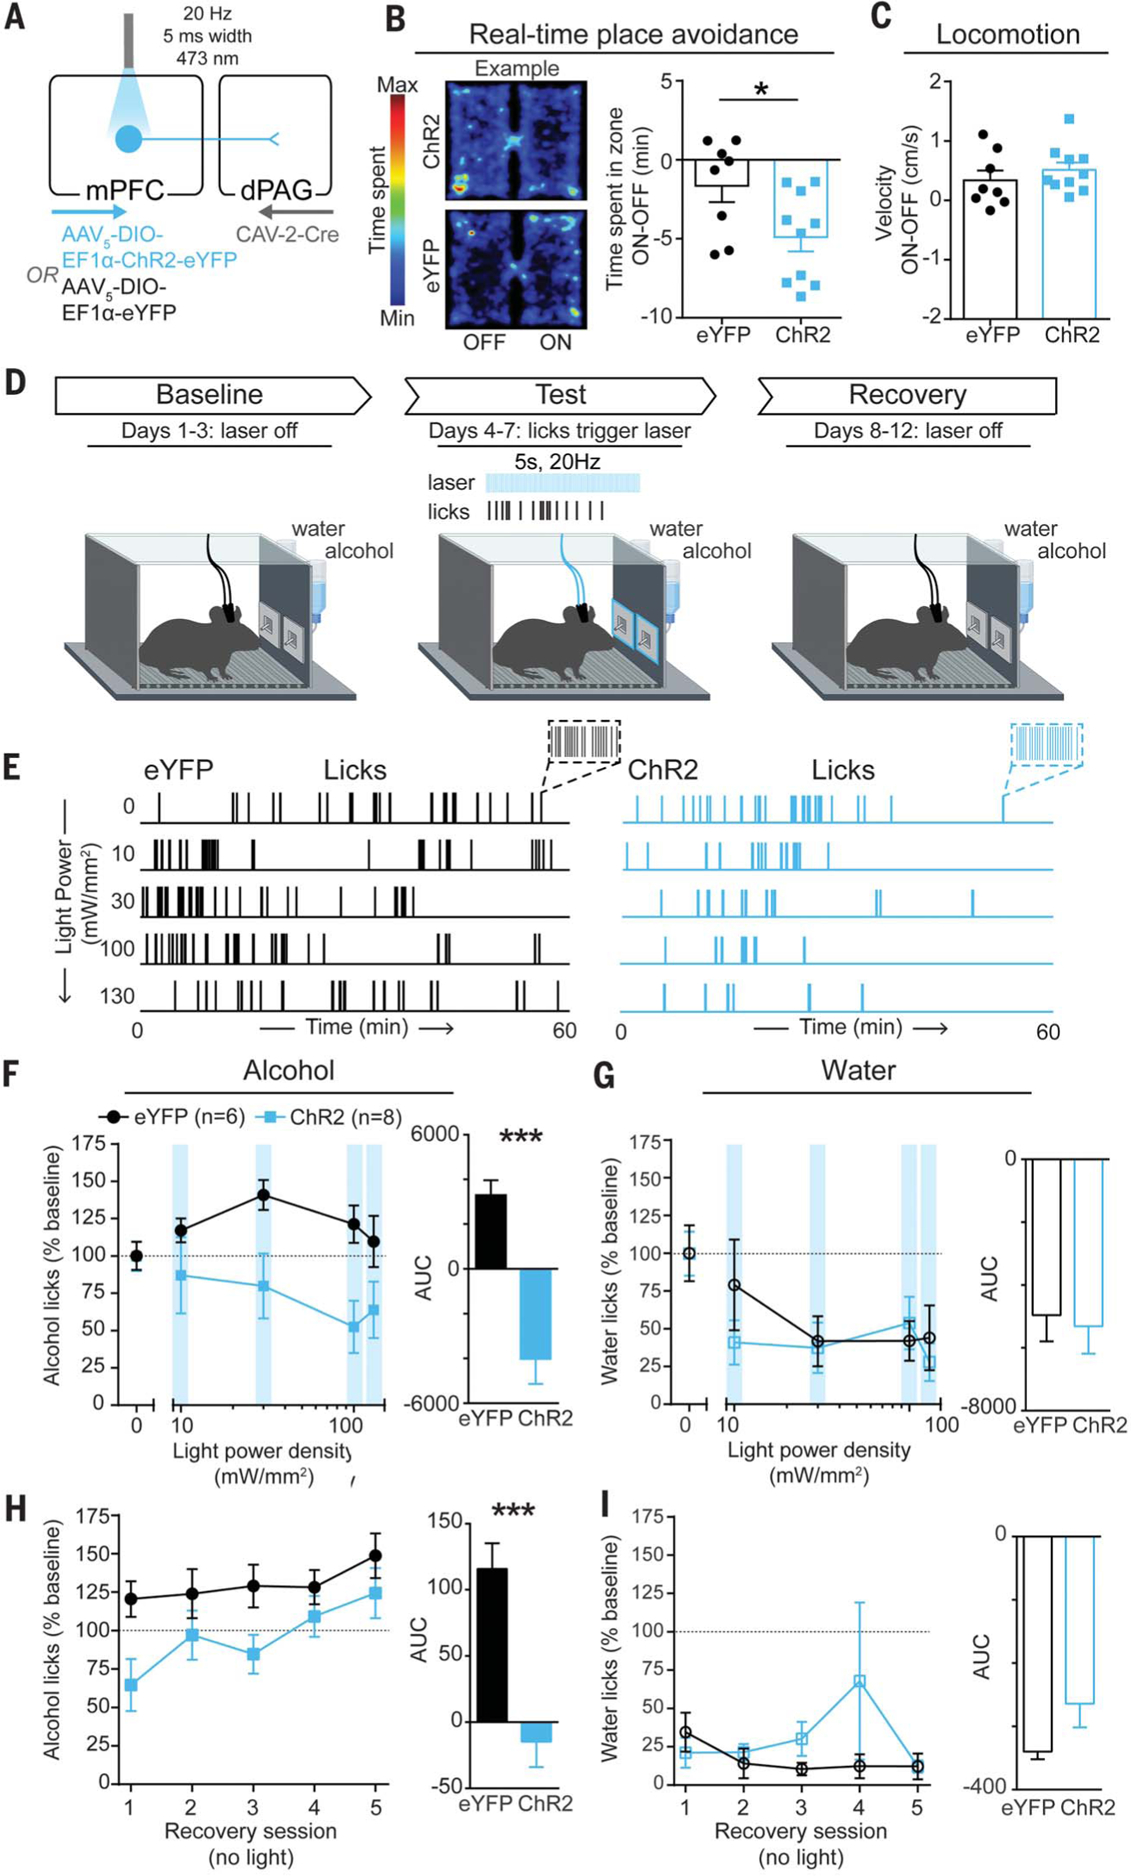
To determine the behavioral impact of driving excitatory activity in this circuit, we bilaterally expressed channelrhodopsin-2 (ChR2) in mPFC-dPAG neurons and implanted optic fibers over the mPFC (Fig. 4A and fig. S11). The photostimulation-paired side was avoided in a real-time place aversion assay (Fig. 4B) without affecting locomotor activity (Fig. 4C) or anxiety-related behavior (fig. S12).
Fig. 4. Activation of mPFC-dPAG neurons mimics the effects of punishment on alcohol consumption.

(A) Strategy to activate mPFC-dPAG neurons. (B) A 20-Hz photostimulation of mPFC-dPAG neurons was avoided in a real-time place avoidance task (unpaired t test, t(16) = 2.356, *p = 0.032). (C) Photostimulation did not alter locomotion (unpaired t test, t(16) = 0.884, p = 0.39). (D) During test days, water or alcohol spout contacts triggered photostimulation delivered at increasing intensities over days (10 to 130 mW/mm2). During recovery sessions, no light was delivered. (E) Example alcohol lick event records. (F) Area under the light power density curve was lower in ChR2 animals than in eYFP controls (unpaired t test, t(12) = 5.811, ***p = 0.0002). (G) Area under the light power density curve did not differ between ChR2 animals and eYFP controls (unpaired t test, t(12) = 0.2834, p = 0.78). (H) AUC for alcohol licks during recovery sessions was decreased in ChR2 animals compared with eYFP controls (unpaired t test, t(12) = 4.677, ***p = 0.0005). (I) AUC for licks on the water spout during recovery sessions did not differ between ChR2 animals and eYFP controls (unpaired t test, t(12) = 1.682, p = 0.1184). Error bars indicate ± SEM.
To test the effects of mPFC-dPAG activation on drinking, we again used a two-bottle choice task in which contacts on either the water or alcohol lickometer triggered photostimulation (Fig. 4D). Alcohol and water remained unadulterated throughout the experiment, and the light power delivered to drive photoexcitation was increased across sessions (10 to 130 mW/mm2), followed by recovery sessions without photostimulation (Fig. 4E). Photostimulation was sufficient to act as a punishment, producing light-power-dependent decreases in licking for alcohol (Fig. 4F) but not water (Fig. 4G), with lasting decreases in alcohol consumption during recovery (Fig. 4, H and I). Microstructural analysis of licking behavior revealed photostimulation-induced changes in bout structure and timing (fig. S13). Photostimulation produced robust and long-lasting decreases in front-loading behavior (drinking a disproportionate amount of alcohol during the initial portion of the access period), a hallmark measure of addiction-like behaviors (fig. S13, L and N).
In conclusion, we established a behavioral model for multidimensional analysis of drinking behaviors and their evolution across time and with experience. We identified a cortical-brainstem circuit that serves as both a biomarker and a circuit-specific cellular substrate for the development of compulsive drinking.
Supplementary Material
ACKNOWLEDGMENTS
We thank Y.-N. Leow for experimental assistance and C. Wildes and R. Wichmann for technical assistance.
Funding: C.A.S. was supported by NIH grants F32 MH111216 (NIMH) and K99 DA045103 (NIDA) and a NARSAD Young Investigator Award from the Brain and Behavior Research Foundation. K.M.T. is a New York Stem Cell Foundation-Robertson Investigator and McKnight Scholar and was supported by funding from the JPB Foundation, New York Stem Cell Foundation, R01-MH102441 (NIMH), the NIH Director’s New Innovator Award DP2-DK102256 (NIDDK), and Pioneer Award DP1-AT009925 (NCCIH). M.H. was supported by the JPB Foundation. D.L. is enrolled as a student at the Medical Faculty Heidelberg, Heidelberg University, Germany, and was supported by a fellowship from the Boehringer Ingelheim Fonds.
Footnotes
Competing interests: The authors declare no competing interests.
Data and materials availability: All experimental data are available in the main text or the supplementary materials.
SUPPLEMENTARY MATERIALS
REFERENCES AND NOTES
- 1.Substance Abuse and Mental Health Services Administration, Center for Behavioral Health Statistics and Quality, Results from the 2017 National Survey on Drug Use and Health: Detailed Tables (2017); www.samhsa.gov/data/sites/default/files/cbhsq-reports/NSDUHDetailedTabs2017/NSDUHDetailedTabs2017.pdf. [Google Scholar]
- 2.Grant BF, Goldstein RB, Saha TD, Chou SP, Jung J, Zhang H, Pickering RP, Ruan WJ, Smith SM, Huang B, Hasin DS, JAMA Psychiatry 72, 757–766 (2015). [DOI] [PMC free article] [PubMed] [Google Scholar]
- 3.Hopf FW, Lesscher HMB, Alcohol 48, 253–264 (2014). [DOI] [PMC free article] [PubMed] [Google Scholar]
- 4.Vanderschuren LJMJ, Everitt BJ, Science 305,1017–1019 (2004). [DOI] [PubMed] [Google Scholar]
- 5.American Psychiatric Association, Diagnostic and Statistical Manual of Mental Disorders (DSM-5®) (American Psychiatric Association, 2013). [Google Scholar]
- 6.McFarland K, Lapish CC, Kalivas PW, J. Neurosci 23, 3531–3537 (2003). [DOI] [PMC free article] [PubMed] [Google Scholar]
- 7.Chen BT, Yau H-J, Hatch C, Kusumoto-Yoshida I, Cho SL, Hopf FW, Bonci A, Nature 496, 359–362 (2013). [DOI] [PubMed] [Google Scholar]
- 8.Koob GF, Volkow ND, Neuropsychopharmacology 35, 217–238 (2010). [DOI] [PMC free article] [PubMed] [Google Scholar]
- 9.Kalivas PW, Volkow N, Seamans J, Neuron 45, 647–650 (2005). [DOI] [PubMed] [Google Scholar]
- 10.Dalley JW, Everitt BJ, Robbins TW, Neuron 69, 680–694 (2011). [DOI] [PubMed] [Google Scholar]
- 11.Silveri MM, Rogowska J, McCaffrey A, Yurgelun-Todd DA, Alcohol. Clin. Exp. Res 35, 218–228 (2011). [DOI] [PMC free article] [PubMed] [Google Scholar]
- 12.Schweinsburg AD, Paulus MP, Barlett VC, Killeen LA, Caldwell LC, Pulido C, Brown SA, Tapert SF, Ann. N. Y. Acad. Sci 1021, 391–394 (2004). [DOI] [PubMed] [Google Scholar]
- 13.Mahmood OM, Goldenberg D, Thayer R, Migliorini R, Simmons AN, Tapert SF, Addict. Behav 38, 1435–1441 (2013). [DOI] [PMC free article] [PubMed] [Google Scholar]
- 14.Seif T, Chang S-J, Simms JA, Gibb SL, Dadgar J, Chen BT, Harvey BK, Ron D, Messing RO, Bonci A, Hopf FW, Nat. Neurosci 16, 1094–1100 (2013). [DOI] [PMC free article] [PubMed] [Google Scholar]
- 15.George O, Sanders C, Freiling J, Grigoryan E, Vu S, Allen CD, Crawford E, Mandyam CD, Koob GF, Proc. Natl. Acad. Sci. U.S.A 109, 18156–18161 (2012). [DOI] [PMC free article] [PubMed] [Google Scholar]
- 16.Holmes A, Fitzgerald PJ, MacPherson KP, DeBrouse L, Colacicco G, Flynn SM, Masneuf S, Pleil KE, Li C, Marcinkiewcz CA, Kash TL, Gunduz-Cinar O, Camp M, Nat. Neurosci 15, 1359–1361 (2012). [DOI] [PMC free article] [PubMed] [Google Scholar]
- 17.Pleil KE, Lowery-Gionta EG, Crowley NA, Li C, Marcinkiewcz CA, Rose JH, McCall NM, Maldonado-Devincci AM, Morrow AL, Jones SR, Kash TL, Neuropharmacology 99, 735–749 (2015). [DOI] [PMC free article] [PubMed] [Google Scholar]
- 18.Lovinger DM, Crabbe JC, Nat. Neurosci 8, 1471–1480 (2005). [DOI] [PubMed] [Google Scholar]
- 19.Giuliano C, Pena-Oliver Y, Goodlett CR, Cardinal RN, Robbins TW, Bullmore ET, Belin D, Everitt BJ, Neuropsychopharmacology 43, 728–738 (2018). [DOI] [PMC free article] [PubMed] [Google Scholar]
- 20.Roberto M, Cruz MT, Gilpin NW, Sabino V, Schweitzer P, Bajo M, Cottone P, Madamba SG, Stouffer DG, Zorrilla EP, Koob GF, Siggins GR, Parsons LH, Biol. Psychiatry 67, 831–839 (2010). [DOI] [PMC free article] [PubMed] [Google Scholar]
- 21.Goltseker K, Hopf FW, Barak S, Alcohol 74, 73–82 (2019). [DOI] [PubMed] [Google Scholar]
- 22.Thiele TE, Navarro M, Alcohol 48, 235–241 (2014). [DOI] [PMC free article] [PubMed] [Google Scholar]
- 23.Franklin TB, Silva BA, Perova Z, Marrone L, Masferrer ME, Zhan Y, Kaplan A, Greetham L, Verrechia V, Halman A, Pagella S, Vyssotski AL, Illarionova A, Grinevich V, Branco T, Gross CT, Nat. Neurosci 20, 260–270 (2017). [DOI] [PMC free article] [PubMed] [Google Scholar]
- 24.Vander Weele CM, Siciliano CA, Matthews GA, Namburi P, Izadmehr EM, Espinel IC, Nieh EH, Schut EHS, Padilla-Coreano N, Burgos-Robles A, Chang C-J, Kimchi EY, Beyeler A, Wichmann R, Wildes CP, Tye KM, Nature 563, 397–401 (2018). [DOI] [PMC free article] [PubMed] [Google Scholar]
- 25.Li Y, Zeng J, Zhang J, Yue C, Zhong W, Liu Z, Feng Q, Luo M, Neuron 97, 911–924.e5 (2018). [DOI] [PubMed] [Google Scholar]
- 26.Evans DA, Stempel AV, Vale R, Ruehle S, Lefler Y, Branco T, Nature 558, 590–594 (2018). [DOI] [PMC free article] [PubMed] [Google Scholar]
- 27.Rozeske RR, Jercog D, Karalis N, Chaudun F, Khoder S, Girard D, Winke N, Herry C, Neuron 97, 898–910.e6 (2018). [DOI] [PubMed] [Google Scholar]
- 28.Cabral A, Isoardi N, Salum C, Macedo CE, Nobre MJ, Molina VA, Brandao ML, Exp. Neurol 200, 200–208 (2006). [DOI] [PubMed] [Google Scholar]
- 29.Avegno EM, Lobell TD, Itoga CA, Baynes BB, Whitaker AM, Weera MM, Edwards S, Middleton JW, Gilpin NW, J. Neurosci 38, 7761–7773 (2018). [DOI] [PMC free article] [PubMed] [Google Scholar]
- 30.Siciliano CA, Tye KM, Alcohol 74, 47–63 (2019). [DOI] [PMC free article] [PubMed] [Google Scholar]
- 31.Kremer EJ, Boutin S, Chillon M, Danos O, J. Virol 74, 505–512 (2000). [DOI] [PMC free article] [PubMed] [Google Scholar]
- 32.Rhodes JS, Best K, Belknap JK, Finn DA, Crabbe JC, Physiol. Behav 84, 53–63 (2005). [DOI] [PubMed] [Google Scholar]
- 33.Rhodes JS, Ford MM, Yu C-H, Brown LL, Finn DA, Garland T Jr., Crabbe JC, Genes Brain Behav. 6, 1–18 (2007). [DOI] [PubMed] [Google Scholar]
- 34.Wilcox MV, Cuzon Carlson VC, Sherazee N, Sprow GM, Bock R, Thiele TE, Lovinger DM, Alvarez VA, Neuropsychopharmacology 39, 579–594 (2014). [DOI] [PMC free article] [PubMed] [Google Scholar]
- 35.Ziv Y, Burns LD, Cocker ED, Hamel EO, Ghosh KK, Kitch LJ, El Gamal A, Schnitzer MJ, Nat. Neurosci 16, 264–266 (2013). [DOI] [PMC free article] [PubMed] [Google Scholar]
- 36.Ghosh KK, Burns LD, Cocker ED, Nimmerjahn A, Ziv Y, Gamal AE, Schnitzer MJ, Nat. Methods 8, 871–878 (2011). [DOI] [PMC free article] [PubMed] [Google Scholar]
- 37.Zhou P, Resendez SL, Rodriguez-Romaguera J, Jimenez JC, Neufeld SQ, Giovannucci A, Friedrich J, Pnevmatikakis EA, Stuber GD, Hen R, Kheirbek MA, Sabatini BL, Kass RE, Paninski L, eLife 7, e28728 (2018). [DOI] [PMC free article] [PubMed] [Google Scholar]
- 38.Murugan M, Jang HJ, Park M, Miller EM, Cox J, Taliaferro JP, Parker NF, Bhave V, Hur H, Liang Y, Nectow AR, Pillow JW, Witten IB, Cell 171,1663–1677.e16 (2017). [DOI] [PMC free article] [PubMed] [Google Scholar]
- 39.Otis JM, Namboodiri VMK, Matan AM, Voets ES, Mohorn EP, Kosyk O, McHenry JA, Robinson JE, Resendez SL, Rossi MA, Stuber GD, Nature 543,103–107 (2017). [DOI] [PMC free article] [PubMed] [Google Scholar]
- 40.Chang C-J, Technical Report: Building a Neural Ensemble Decoder by Extracting Features Shared Across Multiple Populations (MIT, 2019); https://dspace.mit.edu/bitstream/handle/1721.1/122041/Chang-Technical_Report092019.pdf?sequence=1&isAllowed=y. [Google Scholar]
- 41.Stamatakis AM, Stuber GD, Nat. Neurosci 15, 1105–1107 (2012). [DOI] [PMC free article] [PubMed] [Google Scholar]
- 42.Kravitz AV, Tye LD, Kreitzer AC, Nat. Neurosci 15, 816–818 (2012). [DOI] [PMC free article] [PubMed] [Google Scholar]
- 43.Olds J, Milner P, J. Comp. Physiol. Psychol 47, 419–427 (1954). [DOI] [PubMed] [Google Scholar]
- 44.Stuber GD, Sparta DR, Stamatakis AM, van Leeuwen WA, Hardjoprajitno JE, Cho S, Tye KM, Kempadoo KA, Zhang F, Deisseroth K, Bonci A, Nature 475, 377–380 (2011). [DOI] [PMC free article] [PubMed] [Google Scholar]
- 45.Pellow S, Chopin P, File SE, Briley M, J. Neurosci. Methods 14, 149–167 (1985). [DOI] [PubMed] [Google Scholar]
Associated Data
This section collects any data citations, data availability statements, or supplementary materials included in this article.


