

Abstract
Population pharmacokinetic analysis and modeling procedures typically require estimates of both population and individual pharmacokinetic parameters. However, only some of these parameters are contained in models and only parameters in the model can be estimated. In this paper, we introduce a new R package, PKconverter, to calculate pharmacokinetic parameters using the relationships among them. After fitting the model, other parameters can be calculated from the functional relationship among the parameters. PKconverter provides the functions to calculate whole parameters along with a Shiny application for converting the parameters. With this package, it is also possible to calculate the standard errors of the other parameters that are not in the model and estimate individual parameters simultaneously.
Keywords: Pharmacokinetic model, Pharmacokinetic parameter, Population analysis, R, Shiny
Introduction
Pharmacokinetics (PK) is the study of drug absorption, distribution, metabolism, and excretion. PK models explain how drug concentration changes as a drug moves through the different compartments of the body. An understanding of basic PK parameters is essential for PK modeling and analysis. All parameters are considered, but only some are used by models. Those not used can be calculated from the parameters in the model using the functional relationships among the PK parameters.
After fitting the PK model, the estimated parameters can be converted to other parameters using their functional relations. Most modelers use the “Convert.xls” file provided by Shafer (1999) at www.nonmemcourse.com to convert pharmacokinetic parameters in one-, two-, or three-compartment models. The Microsoft Excel file consists of five different calculation sheets, each of which has different input and output parameters. A user can choose the sheet according to the known input parameters and the number of compartments in the model and then input estimated parameters. The other parameters are returned by the spreadsheet.
Several difficulties are associated with this tool. First, Microsoft Excel is commercial software. Second, while the converted parameters are in the spreadsheet and the numbers can be checked, it is not easy to use these numbers for further analysis without typing them into another file. Third, even though it provides converted parameters in a spreadsheet for a given population parameter, it is sometimes necessary to know individual PK parameters. With this Excel file, we can convert only one set of parameters for one individual at a time. To convert a set of parameters for all individuals, the estimated parameters for one individual must be entered, the results checked, and the procedure repeated for each individual. Fourth, this Excel file does not provide the approximate standard error of converted parameters.
To address these limitations, we developed a new R package, PKconverter. This package provides the user with the converted parameters and the approximated standard error of the converted parameters using the delta method. It also converts individual parameters with the standard errors simultaneously and can save the entire result as a single file. With the Shiny [1] graphical user interface (GUI), a novice R user can easily calculate the converted parameters. PKconverter (https://cran.r-project.org/web/packages/PKconverter/index.html) is on R repository CRAN and everyone can download freely and use it. We also put this on the web (https://ek-lee.shinyapps.io/PKconverter/) that the user can use on the web without install R or PKconverter packages.
Here we first introduce the pharmacokinetic models and parameters, and the relationships among the pharmacokinetic parameters in each compartment model. We then explain the delta method and how to use it to calculate the approximated standard errors of the converted parameters. Finally, we describe how to convert the parameters with the several types of input parameters. We also introduce the Shiny application interface for PKconverter.
Methods
PK studies the time course of drug concentration in different body spaces and the relationship between concentration and the time course of drug action.[2,3,4,5,6,7] Drug absorption, distribution, metabolism, and elimination are fundamental aspects of pharmacokinetic modeling and analysis. The pharmacokinetic model explains the transfer of a drug from its absorption site to the body and the various steps involved in the distribution and elimination of the drug in the body. It is essential to check and interpret all pharmacokinetic parameters.
The volume of distribution (V) defines the apparent space or volume that a drug distributes. Clearance (CL) defines the volume of blood that is completely cleared of drug content per unit time. It describes the capacity of irreversible elimination of a compound from plasma and is a consequence of a combination of perfusion, diffusion, filtration, metabolism, and transport processes of the clearing organ. The elimination rate constant (K) relates to the amount of drug in the body that is eliminated per unit of time. The half-life of the drug (t1/2) is the time required to reduce by half the amount of a drug remaining in the body. A fractional coefficient is defined as a true coefficient multiplied by the volume of distribution. The sum of all fractional coefficients is always 1; for example, for a three-compartment model, F.A + F.B + F.C = 1. The exponents α, β, and γ represent the slopes of the decay in the plot of drug concentration vs. time. The half-lives are calculated by log(2) divided by the corresponding exponents.
Although all PK parameters should be considered for analysis, only some of these parameters are used in the model, and the others can be calculated by the functional relations with them. Therefore, after fitting the pharmacokinetic model, the other parameters must be calculated with these estimated parameters, which are not used in the model.
Compartment model
In pharmacometrics, the compartmental model is categorized by the number of compartments needed to describe a drug's absorption, distribution, metabolism, and excretion in the body.[8] There are one-, two-, and three-compartment models. These models are used to predict the time course of drug concentrations in the body. In a one-compartment model, Ct is the drug concentration at time t, C0 is the initial concentration, and K10 is the elimination rate.
In the pharmacometrics area, a basic type of model is the compartmental model that is categorized by the number of compartments needed to describe the drug's absorption, distribution, metabolism, and excretion in the body.[8] There are one-compartmental, two-compartmental, and multi-compartmental models. We usually use up to three-compartmental model. These models are used to predict the time course of drug concentrations in the body. The one-compartmental model is
| Ct=C0e-k10t | (1) |
| =Ae−αt | (2) |
(2) is the general form of the one-compartment model. A is the true coefficient, and α is the exponent. These two parameters have functional relation with various pharmacokinetic parameters V1, CL1, K10, t1/2,α, etc.
For example, a one-compartment intravenous bolus model can be represented in three ways:
| (3) |
| (4) |
| (5) |
where CL1 is the clearance, V1 is the volume of distribution, and K10 is the elimination rate constant. Because the pharmacokinetic parameters V1, CL1, and K10 have a functional relation of CL1 = V1 · K10, the model equation can be represented by various form with only two pharmacokinetic parameters, and the other parameters can be found after fitting one of three equations. Figure 1 and Figure 2 provide the plots of the functional relationships among the pharmacokinetic parameters.
Figure 1. The relationship among PK parameters? V1, Cl1, and k10 in one compartment model.

Figure 2. The relationship among PK parameters? V1, Cl1, and t_alpha in one compartment model.

The general form of the two-compartmental model is
| Ct = Ae−αt + Be−βt , |
where A or B is used for C0 in the one-compartmental model, and α or β are used for the elimination rate. With these four parameter estimates, 12 more parameters can be calculated with the following equations:
| CL1 = V1 × K10, CL2 = V2 × K12, |
| F.A = A × V1, F.B = B × V1. |
Similar relations can be defined in the three-compartment model.
Table 1 summarized important pharmacokinetic parameters in each compartmental model and Table 2 summarized input parameters for each compartmental model in each spreadsheet in Shiner's “Convert.xls” file.
Table 1. Important pharmacokinetic parameters in each compartment model.
| Type | One compartment | Two compartment | Three compartment |
|---|---|---|---|
| Volume of distribution | V1 | V1, V2 | V1, V2, V3 |
| Vdss | Vdss | Vdss | Vdss |
| Clearance | CL1 | CL1, CL2 | CL1, CL2, CL3 |
| Rate constant | K10 | K10, K12, K21 | K10, K12, K21, K13, K31 |
| Half-life | t1/2,α | t1/2,α, t1/2,β | t1/2,α, t1/2,β, t1/2,γ |
| True coefficient | A | A, B | A, B, C |
| Fractional coefficient | F.A | F.A, F.B | F.A, F.B, F.B |
| Exponent | α | α, β | α, β, γ |
Table 2. Summary of input parameters and function names in each compartment in each model.
| Model | Compartment | Input | Function name |
|---|---|---|---|
| 1 | 1 | V1, CL1 | OneComp_Volume_Clearance |
| 2 | V1, V2, CL1, CL2 | TwoComp_Volume_Clearance | |
| 3 | V1, V2, V3, CL1, CL2, CL3 | ThreeComp_Volume_Clearance | |
| 2 | 1 | V1, K10 | OneComp_Volume_RateConstant |
| 2 | V1, K10, K12, K21 | TwoComp_Volume_RateConstant | |
| 3 | V1, K10, K12, K21, K13, K31 | ThreeComp_Volume_RateConstant | |
| 3 | 1 | CL1, t1/2,α | OneComp_Volume_Clearance_HalfLife |
| 2 | V1, CL1, t1/2,α, t1/2,β | TwoComp_Volume_Clearance_HalfLife | |
| 3 | V1, CL1, t1/2,α, t1/2,β, t1/2,γ, Vdss | ThreeComp_Volume_Clearance_HalfLife | |
| 4 | 1 | A, α | OneComp_Coefficient_Exponent |
| 2 | A, B, α, β | TwoComp_Coefficient_Exponent | |
| 3 | A, B, C, α, β, γ | ThreeComp_Coefficient_Exponent | |
| 5 | 1 | V1, α | OneComp_Volume_Exponent |
| 2 | V1, K21, α, β | TwoComp_Volume_Exponent | |
| 3 | V1, K21, K31, α, β, γ | ThreeComp_Volume_Exponent |
Delta method
In pharmacometrics, the maximum likelihood estimation (MLE) of a PK parameter can be found with NONMEM or other software. Most software involved in generating estimates of PK parameters is based on maximum likelihood theory. If θ is the PK parameter and is the MLE of θ, then, by the properties of MLE,[9,10]
To calculate the other PK parameters that are the functions of MLEs, let f(θ) be the other PK parameters. The estimate of f(θ) is and , the delta method.[11] If the dimension of θ, q, is greater than 1,
where , q-dimensional vector.
Population parameter convert
We provide five different models with known parameters for three kinds of compartment models. In the following subsection, we summarize the input and output parameters of each model. We then provide functions to calculate PK parameters with the approximated standard errors and supply a Shiny application for each model. Table 2 lists input parameters and R function names for each model.
Model 1 uses the volume of distributions and the clearances as the input parameters. For one-compartmental model, with the known parameters V1 and CL1, the other parameters can be calculated with the following equations:
For the two-compartmental model, with the know parameters V1, V2, CL1, and CL2, we can calculate the others:
| a0 = k10k21, a1 = −(k10 + k12 + k21), |
For the three-compartmental model, the following equations can be used:
| Vdss = V1 + V2 + V3, |
where α,β,γ are determined by size order of root1, root2, root3 from the largest to smallest.
| a0 = k10k21k31, a1 = k10k31 + k21k31 + k21k13 + k10k21 + k31k12, |
| a2 = k10 + k12 + k13 + k21 + k31, |
Model 2 uses the volume of distribution of 1st compartment and rate constants, model 3 uses the volume of distribution and the clearance of the 1st compartment and half-lives, model 4 uses the coefficients and exponents, and model 5 uses the volume of distribution of the 1st compartment, exponents, and some of the rate constants. The detailed formula to calculate the other parameters are in.[12]
Results
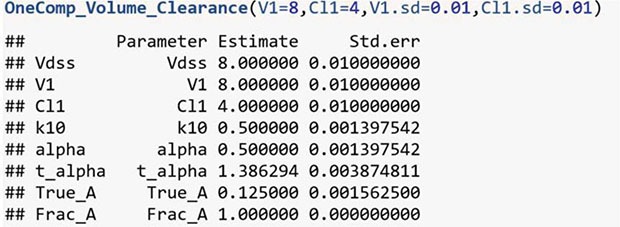
For each model and each compartment, we provide an R function. The function names for each model in each compartment are supplied in Table 2. For one-compartmental model with Model 1, OneComp_Volume_Clearance function is used as follows:
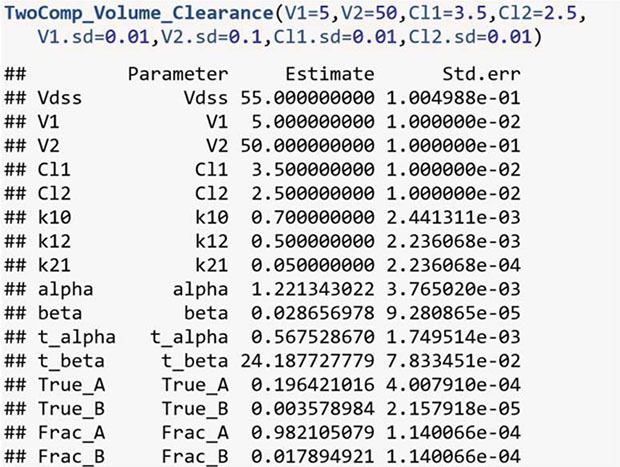
For the two-compartment model with Model 1,
Web Interface
We provide a Shiny application[1] to accompany the R package. Figure 3 shows the main GUI of a Shiny application for a pharmacokinetic parameter converter with a Model 1 tab. There are five tabs in this application, and each model consists of one model. The user can choose a one, two, or three-compartment model from the “MODEL TYPE” radio button. After entering the values of the volume of distributions and clearances, the gray-shaded output area is automatically changed as it calculates the other parameters. PKconverter then calculates the standard errors of each parameter using the delta method. In the “Covariance” tab, the covariance between the volume of distribution and the clearance can be entered and considered in the calculation of the standard errors of the other parameters.
Figure 3. Main GUI of Shiny application for Pharmacokinetic Parameter Converter - Model 1.

Individual parameter converter
Figure 4 is the GUI for converting individual parameters simultaneously. After selecting the compartment model and data type, users can upload an individual pharmacokinetic parameter file. After matching the name of input PK parameters with the user's input file, the other parameters are automatically calculated and presented. The user can save these results as a file.
Figure 4. Main GUI of Shiny application for Pharmacokinetic Parameter Converter - Individual parameter converter.

Discussion
In this paper, we introduce a new R package, PKconverter, to calculate pharmacokinetic parameters using the relationships among them. After fitting the model, other parameters can be calculated from the functional relationship among the parameters. PKconverter provides the functions to calculate whole parameters along with a Shiny application for converting the parameters. With this package, it is also possible to calculate the standard errors of the other parameters that are not in the model and estimate individual parameters simultaneously. It can be convenient not only for calculating population parameters but also for calculating individual parameters. To check the reliability of the calculations in this package, we compare the result of the converted parameters with the pmxTools package. The pmxTools package provides the functions to convert the parameters. However, these functions do not provide the standard errors of converted pharmacokinetic parameters. To confirm the reliability of the calculation of the converted parameters, we use Theoph data and nlme functions in the nlme package. The results are provided as supplementary materials.
This package can read an input file with individual parameters and convert them simultaneously. All results in the Shiny application can be saved as an output file. With this saved file, we can easily use the calculated parameters for further analysis. PKconverter (https://cran.r-project.org/web/packages/PKconverter/index.html) is on R repository CRAN and everyone can download freely and use it. Shiny app is also on the web (https://ek-lee.shinyapps.io/PKconverter/) that the user can use on the web without install R or PKconverter packages. We hope that this package can help pharmacometricians analyze and understand the compartmental models.
Acknowledgments
This research was supported by Basic Science Research Program through the National Research Foundation of Korea (NRF) funded by the Ministry of Education (2015R1D1A1A01056790).
Footnotes
Reviewer: This article reviewed by peer experts who are not TCP editors.
Conflict of interest: - Authors: Nothing to declare
- Reviewers: Nothing to declare
- Editors: Nothing to declare
Supplementary Material
References
- 1.Chang W, Cheng J, Allaire JJ, Xie Y, McPherson J. Shiny: web application framework for R. R package version 0.11. 2015. [Google Scholar]
- 2.DiPiro JT. Concepts in clinical pharmacokinetics. ASHP; 2010. [Google Scholar]
- 3.Rowland M, Tozer TN, Derendorf H, Hochhaus G. Clinical pharmacokinetics and pharmacodynamics: concepts and applications. Philadelphia, PA: Wolters Kluwer Health/Lippincott William & Wilkins; 2011. [Google Scholar]
- 4.Gabrielsson J, Weiner D. Pharmacokinetic and pharmacodynamic data analysis: concepts and applications, volume 2. CRC Press; 2001. [Google Scholar]
- 5.Benet LZ, Zia-Amirhosseini P. Basic principles of pharmacokinetics. Toxicol Pathol. 1995;23:115–123. doi: 10.1177/019262339502300203. [DOI] [PubMed] [Google Scholar]
- 6.Mould DR, Upton RN. Basic concepts in population modeling, simulation, and model-based drug development. CPT Pharmacometrics Syst Pharmacol. 2012;1:1–14. doi: 10.1038/psp.2012.4. [DOI] [PMC free article] [PubMed] [Google Scholar]
- 7.Mould DR, Upton RN. Basic concepts in population modeling, simulation, and model-based drug development—part 2: introduction to pharmacokinetic modeling methods. CPT Pharmacometrics Syst Pharmacol. 2013;2:1–14. doi: 10.1038/psp.2013.14. [DOI] [PMC free article] [PubMed] [Google Scholar]
- 8.Shargel L, Andrew B, Wu-Pong S. Applied biopharmaceutics & pharmacokinetics. Appleton & Lange Stamford; 1999. [Google Scholar]
- 9.Lehmann EL. Elements of large-sample theory. Springer Science & Business Media; 2004. [Google Scholar]
- 10.Taboga T. Lectures on probability theory and mathematical statistics. CreateSpace Independent Publishing Platform; 2012. [Google Scholar]
- 11.Casella G, Berger RL. Statistical inference, volume 2. Pacific Grove, CA: Duxbury; 2002. [Google Scholar]
- 12.Cho H. PKconverter: shiny application to convert the PK parameters. Ewha Womans University; 2018. [Google Scholar]
Associated Data
This section collects any data citations, data availability statements, or supplementary materials included in this article.