

Abstract
Background:
Despite adolescents and young adults being the most frequent users of cannabis, all information on cannabis drug testing interpretation is based on data from adults.
Aims:
This study aimed to define the time course of urinary 11-nor-9-carboxy-THC (THCCOOH) excretion among 70 adolescent and young adult cannabis users during one month of biochemically-verified cannabis abstinence.
Methods:
Urine specimens were collected at non-abstinent baseline and after 2, 3, 8, 15, 21 and 28 days of abstinence. Specimens were tested for THCCOOH with a “rapid” immunoassay drug test and a confirmatory assay using liquid chromatography-tandem mass spectrometry, with a 5 ng/mL limit of quantitation. Elimination rate was tested using a population pharmacokinetics model.
Results/outcomes:
Participants had an average of 26 days of abstinence (SD=6). Initial creatinine-adjusted THCCOOH concentration (CN-THCCOOH) was 148 ng/mg (SD=157). Half-life was 2 days (SD=5), with a 10-day window of detection (estimated range: 4-80 days). At the final timepoint and among those with >25 days of abstinence (n=62), 40% (n=25) had THCCOOH concentrations >5 ng/mL (i.e., detectable on confirmatory assay) and 19% (n=12) were “positive” per federal drug testing guidelines (i.e., values greater than 50 ng/mL on the screening immunoassay and 15 ng/mL on the confirmatory assay). More frequent past month cannabis use was associated with higher baseline CN-THCCOOH concentrations, but not with rate of elimination. Nested 5-fold cross-validation suggested high model reliability and predictive validity.
Conclusions/interpretation:
Findings underscore that, as with adults, detectable cannabinoid metabolites do not necessarily indicate recent use in adolescents and young adults. Algorithms that account for THCCOOH levels, assessed longitudinally, and time between specimen collections are best equipped to confirm abstinence.
Keywords: Cannabis, marijuana, THCCOOH, abstinence, adolescents, young adults, pharmacokinetics
Introduction
Cannabis continues to be among the most frequently used drugs in the United States, with the prevalence of use highest among adolescents and young adults (2016). Cannabis is also the most commonly detected intoxicant, after alcohol, among adolescents at school, in the workplace, during roadside safety evaluations and in drug treatment programs (Arria et al., 2011; O’Malley and Johnston, 2013; Whitehill et al., 2014; Zuccato et al., 2017). Despite adolescents being the most frequent consumers of cannabis, cannabis drug testing methodology and interpretation is based largely on tests conducted in adult users (Huestis, 2007; Schwilke et al., 2011). The development of guidance on the interpretation of cannabinoid urine drug test results among adolescents and young adults is critical.
The primary psychoactive constituent of cannabis is Δ9-tetrahydrocannabinol (THC). THC is rapidly metabolized via phase I hydroxylation by hepatic cytrochrome P450 (CYP 450) enzymes, namely CYP2C9, CYP2C19 and CYP3A4 (Bland et al., 2005; Bornheim et al., 1992; Watanabe et al., 2007), into the psychoactive metabolite 11-hydroxy-THC (11-OH-THC) and subsequently into the non-psychoactive metabolite 11-nor-9-carboxy-THC (THCCOOH) (Elkashef et al., 2008; Gruber et al., 2012; Musshoff and Madea, 2006). THCCOOH is conjugated with glucuronic acid, and primarily excreted in urine (Desrosiers et al., 2014a; Desrosiers et al., 2014b; Scheidweiler et al., 2016; Wall et al., 1983).
Although urine is the most commonly used biological matrix for detecting cannabis exposure in drug testing programs, the long terminal half-life of the drug complicates the ability to distinguish recent cannabis exposure with residual excretion. Urinary excretion of THCCOOH in controlled laboratory settings has been reported in adult cannabis users for up to 46 days of abstinence (Cridland et al., 1983; Dackis et al., 1982; Goodwin et al., 2008; Kelly and Jones, 1992; Lowe et al., 2009; Swatek, 1984; Ellis et al., 1985; Bergamaschi et al., 2013). Moreover, case reports of even longer elimination rates in uncontrolled settings have been reported (Westin et al., 2009). Such long detection times are due to the highly lipophilic nature of THC, resulting in bioaccumulation in adipose tissue (Agurell et al., 1970; Kreuz and Axelrod, 1973) and slow excretion (Johansson et al., 1989).
Despite preclinical and clinical studies demonstrating that acute and chronic effects of cannabis vary by age (Ehrenreich et al., 1999; Gruber et al., 2012; Quinn et al., 2008; Winward et al., 2014), little is known about the pharmacokinetic profile of cannabis elimination in adolescents and young adults. The objective of this study was to define the time course of urinary THCCOOH excretion in 70 adolescent and young adult frequent cannabis users, aged 15-25, during one month of sustained, biochemically-verified cannabis abstinence. This study aimed to improve understanding of THCCOOH detection times following discontinuation of use in adolescents and young adults with chronic cannabis exposure, which is essential for proper interpretation of drug testing outcomes in workplace, drug treatment and forensic settings.
Methods
Enrollment for this study occurred between July 2015 and July 2018. Written informed consent was obtained for participants over the age of 18, and written parental consent and participant assent were obtained for individuals under the age of 18. Procedures were approved by the Partners Healthcare Human Subjects Committee.
Study sample
Urine cannabinoid concentrations were determined from non-treatment seeking adolescents and young adults between the ages of 15 and 25 years in an outpatient setting, drawn from a larger Boston-based study on cognition during cannabis abstinence (Schuster et al., 2018; Schuster et al., 2016). Participants were recruited via peer referral, community advertisements, and via advertising at a public high school in a northwest Boston suburb. Participants included in this sub-study used cannabis at least weekly and used within 2 days of the baseline visit. Additionally, for statistical model building purposes, all participants provided at least 2 urine samples while enrolled in the trial with THCCOOH concentrations ≥5 ng/mL.
Abstinence and biochemical verification of abstinence
Participants received an escalating financial incentive schedule (i.e. contingency management) for completing 30 days of continuous cannabis abstinence, and urine samples for THCCOOH were collected at 7 study visits over 4 weeks as part of a project assessing cognition and cannabis use (Schuster et al., 2016). Urine THCCOOH concentrations (ng/mL) were normalized to creatinine (mg/dL) to correct for individual differences in hydration and reduce variability (Lafolie et al., 1991), yielding a THCCOOH to creatinine concentration ratio at each time point (CN-THCCOOH; ng/mg). Residual cannabinoid excretion was differentiated from new cannabis exposure by comparing CN-THCCOOH ratios for all specimen pairs collected ≥48h apart using the statistical model developed by Schwilke and colleagues (Schwilke et al., 2011) that yields an expected CN-THCCOOH ratio associated with specimen pairs collected at specified time intervals during abstinence. Observed ratios that exceeded this expected value were interpreted as new cannabis use. This study employed a 95% specificity threshold, allowing for a 2.5% false positive rate (i.e., a false interpretation of new cannabis use).
Specimen collection and analysis
Urine specimens were obtained at baseline (pre-abstinence) and, on average, 2, 3, 8, 15, 21 and 28 days after enrollment. Participants provided baseline urine specimens within 2 days of last use, with 20% having used cannabis on the day of their baseline study visit. Specimens were screened with an immunoassay rapid dip drug test (RDDT; Medimpex United Inc), with specimens exceeding the 50 ng/mL detection limit classified as “positive” for THCCOOH. All specimens, including those with qualitative negative on the immunoassay RDDT screen, were shipped overnight to Dominion Diagnostics (Kingstown, RI, USA) for confirmatory analysis and THCCOOH quantitation using liquid chromatography–tandem mass spectrometry (LC/MS/MS). Samples underwent chemical (alkali) hydrolysis prior to analysis. The limit of quantitation (LOQ) was 5 ng/mL and the upper limit of linearity was 500 ng/mL. As necessary, serial dilutions were performed on samples with high concentrations to obtain a value within the linear range of the assay (i.e., 5 ng/mL – 500 ng/mL). The concentrations of diluted samples were multiplied by the employed dilution factor to obtain the quantitative THCCOOH concentration of the original sample. Per federal drug testing guidelines, specimens were considered “positive” for THCCOOH when analyte values exceeded both 50 ng/mL on the RDDT immunoassay and 15 ng/mL on the confirmatory LC/MS/MS assay (2017a).
Samples were also analyzed for pH level (normal range: 4.5 – 9.0), specific gravity (normal range: 1.0003 – 1.035), presence of oxidants (nitrites, chromates, peroxidases, bleach and iodine; LOQ: 200 ug/mL), and creatinine (normal range: 20.0 – 400 mg/dL). Urine creatinine concentration was determined using the DRI® Creatinine-Detect assay, which is based on the Jaffe reaction where creatinine concentration was determined colorimetrically (Butler, 1975).
Assessments
At baseline, demographic (age, sex, race, weight, height) and substance use assessments were collected. The quantity and frequency of past 90-day cannabis use were assessed using a modified Timeline Follow-Back interview (TLFB; Robinson et al., 2014), a validated and widely used instrument in which the interviewer conducted guided queries using a calendar to ascertain a quantitative estimate of frequency of cannabis use in the 90 days prior to the interview date. Memory aids, including use of key dates as reporting anchors, were used to enhance retrospective recall. A TLFB was also completed at all subsequent visits to approximate amount and quantity of substance exposure between study visits. Participants completed the Cannabis Use Disorder Identification Test – Revised (CUDIT-R; Adamson and Sellman, 2003), a self-report measure of cannabis dependence symptoms. Scores ≥ 8 were suggestive of hazardous cannabis use and scores ≥12 were suggestive of probable Cannabis Use Disorder.
Analytic approach
A mixed effect pharmacokinetic (PK) model was fit to the data using an exponential decay model, which allowed estimation of the initial CN-THCCOOH concentration on the day of self-reported last exposure (based on the TLFB interview) and the rate at which CN-THCCOOH was eliminated. Random effects for intercept (i.e., estimated CN-THCCOOH concentration at the time of last exposure) and slope (i.e., rate of elimination) were included in the model. Because sex, body mass index (BMI), race (Caucasian versus non-Caucasian), years of cannabis use, and number of cannabis using days in the past 30 days could influence cannabis clearance rate, these variables were included in the model as covariates. Age and years of cannabis use were moderately correlated (r = 0.6, p < 0.0001), and therefore age was not considered as a separate covariate. However, all effects were unchanged when age replaced years of cannabis use in the models.
All CN-THCCOOH concentrations gleaned from confirmatory assays were included in the PK model, regardless of screening result, with the exception of those samples in which new use was indicated per guidelines set forth by Schwilke and colleagues (Schwilke et al., 2011). Collected specimens in which new use was detected (n=15 data points), as well as any specimens collected after the point in which new use was detected, were excluded from analyses. Specimen concentrations prior to the re-initiation of cannabis use were modeled. Additionally, because THCCOOH concentrations below the LOQ (5 ng/mL) could not be determined, a data imputation approach was used in which censored data were replaced with predicted values from applying a basic PK model to individual participants’ data, estimated using tobit regression (Amemiya, 1984) to correct for bias due to left censored data. Description of this approach and data imputation results for the 120 samples (27% of the total collected) that fell below the LOQ for THCCOOH are presented in Supplementary Appendix 1. Supplementary Appendix 1 also notes that, while this imputation approach reduces bias from left-censored data on parameters such as the rate of decay, the model may still underestimate variability in residual noise at the subject-level. The final reported mixed effects PK model was fit to the adjusted data within a Bayesian framework (see Supplementary Appendix 1 for estimation details and justification for the employed statistical approach). Variables were considered statistically significant if posterior p-values were < 0.05.
To avoid over-fitting and to minimize the risk of false positives, we used a nested 5-fold cross-validation approach to identify reliable correlates of baseline THCCOOH concentration and decay rate using 56 randomly selected participants (the training sample), and then validated how well these variables correlated with the same outcomes in a holdout sample of 14 participants (Cawley and Talbot, 2010). This approach was repeated 5 times such that every participant was part of the test sample 1 time. This two-step validation procedure was repeated 30 times, splitting the data into 5 new partitions each time. Additional details regarding this cross-validation approach are provided in Supplementary Appendix 1.
Analyses were conducted in R (version 3.4.3; R Core Team, (2017b)). Data were prepared using the “dplyr” package (version 0.7.1; (Wickham H, 2017), and the mixed effects PK model was fit using the R package “brms” (version 2.3.1; (Bürkner, 2017)). The R code used for the full set of analyses can be found here: https://github.com/rettopnivek/Analyses/tree/master/2018/CAM/THC_decline_07_06_2018.
Results
Description of participant characteristics
Study participants (N = 70) were 63% male and had a mean age of 20 years (SD = 2; range: 15 - 25 years). Participants used cannabis on 20 of the prior 30 days (SD = 8; range: 4 - 30 days), and 2 times per cannabis using day (SD = 1; range: 1 - 10 times). The average age of first cannabis exposure was 15 years (SD = 2; range: 11 - 21 years), and the mean period of use was 5 years (SD = 2; range: 0.4 - 14 years). Fourteen participants used cannabis on the day of the baseline study visit, 45 participants last used 1 day prior to baseline, and 11 participants last used 2 days prior to baseline. See Table 1 for additional participant characteristics.
Table 1.
Demographics and Cannabis Use Characteristics
| Cannabis Use |
|||||||||||||
|---|---|---|---|---|---|---|---|---|---|---|---|---|---|
| Study Participant | Age, Years | Sex | Race (Hispanic Ethnicity) | Weight, lb | Height, in | BMI | Days Used in Past 30 | Times Used in Past 30 | Amount Used in Past 30, grams | Days Since Last Use | Age First Used, years | Years Used | CUDIT-R |
| A | 24 | M | W | 175 | 74 | 23.0 | 17 | 17 | 3.4 | 1 | 16 | 8.4 | 15 |
| B | 24 | M | W | 155 | 70 | 22.8 | 8 | 8 | 2.2 | 2 | 17 | 7.0 | 8 |
| C | 24 | F | W | 145 | 64 | 25.5 | 24 | 74 | 13.5 | 1 | 18 | 6.4 | 22 |
| D | 21 | M | AA (H) | 210 | 75 | 26.9 | 22 | 35 | 22.2 | 0 | 15 | 6.1 | 20 |
| E | 20 | M | W | 172 | 70 | 25.3 | 29 | 61 | 22.5 | 1 | 16 | 4.4 | 20 |
| F | 22 | F | W | 160 | 67 | 25.7 | 29 | 32 | 31.0 | 1 | 17 | 4.7 | 16 |
| G | 22 | F | W | 130 | 65 | 22.2 | 6 | 6 | 1.5 | 2 | 17 | 4.6 | 5 |
| H | 19 | F | W | 120 | 68 | 18.7 | 15 | 15 | 1.9 | 2 | 17 | 2.4 | 8 |
| I | 23 | F | W | 135 | 65 | 23.0 | 22 | 40 | 6.2 | 1 | 15 | 8.2 | 10 |
| J | 22 | M | OTH (H) | 150 | 68 | 23.4 | 19 | 76 | 66.5 | 1 | 18 | 3.6 | 15 |
| K | 20 | F | MOR | 135 | 65 | 23.0 | 21 | 22 | 22.0 | 0 | 13 | 6.7 | 14 |
| L | 21 | M | W | 178 | 76 | 22.2 | 14 | 20 | 6.0 | 2 | 19 | 2.3 | 13 |
| M | 21 | M | W | 165 | 70 | 24.2 | 10 | 10 | 5.0 | 1 | 14 | 6.8 | 4 |
| N | 20 | F | W | 125 | 59 | 25.9 | 18 | 18 | 10.0 | 1 | 16 | 4.1 | 19 |
| O | 23 | F | AA | 160 | 60 | 32.0 | 12 | 40 | 52.0 | 1 | 14 | 8.6 | 14 |
| P | 26 | M | W | 165 | 71 | 23.6 | 29 | 34 | 8.5 | 1 | 12 | 13.9 | 14 |
| Q | 21 | F | AA (H) | 130 | 60 | 26.0 | 29 | 116 | 43.5 | 1 | 17 | 3.6 | 12 |
| R | 22 | M | W | 195 | 78 | 23.1 | 21 | 42 | 4.2 | 1 | 18 | 3.6 | 18 |
| S | 21 | F | W | 150 | 63 | 27.2 | 12 | 15 | 4.2 | 2 | 21 | 0.4 | 10 |
| T | 23 | F | MOR | 130 | 62 | 24.3 | 26 | 27 | 10.9 | 1 | 18 | 4.9 | 13 |
| U | 21 | M | MOR | 150 | 71 | 21.4 | 26 | 78 | 10.4 | 1 | 16 | 4.6 | 18 |
| V | 19 | F | AA | 130 | 64 | 22.9 | 29 | 97 | 48.1 | 1 | 16 | 3.3 | 12 |
| W | 22 | M | W | 190 | 68 | 29.6 | 9 | 9 | 4.5 | 1 | 13 | 8.6 | 4 |
| X | 20 | M | W | 183 | 74 | 24.1 | 25 | 59 | 28.0 | 1 | 13 | 7.4 | 30 |
| Y | 19 | M | AS | 160 | 70 | 23.5 | 23 | 49 | 85.0 | 1 | 15 | 4.1 | 17 |
| Z | 20 | M | W | 180 | 72 | 25.0 | 23 | 46 | 16.1 | 1 | 17 | 3.1 | 19 |
| AA | 21 | M | W | 145 | 67 | 23.3 | 26 | 26 | 13.0 | 1 | 15 | 5.8 | 15 |
| BB | 21 | M | W (H) | 180 | 72 | 25.0 | 21 | 61 | 21.5 | 1 | 14 | 6.7 | 13 |
| CC | 21 | M | W | 165 | 68 | 25.7 | 30 | 88 | 59.0 | 0 | 13 | 8.3 | 23 |
| DD | 20 | F | W | 242 | 70 | 35.6 | 26 | 78 | 5.2 | 1 | 14 | 6.0 | 19 |
| EE | 24 | M | W | 170 | 68 | 26.5 | 29 | 116 | 102 | 1 | 17 | 7.1 | 20 |
| FF | 20 | F | AA | 137 | 64 | 24.1 | 7 | 7 | 2.3 | 1 | 17 | 3.0 | 10 |
| GG | 18 | M | W | 190 | 75 | 24.3 | 29 | 80 | 22.5 | 1 | 14 | 4.2 | 19 |
| HH | 17 | M | W | 135 | 68 | 21.0 | 25 | 50 | 12.5 | 1 | 13 | 3.9 | 17 |
| II | 18 | F | W | 130 | 67 | 20.9 | 13 | 16 | 6.9 | 1 | 14 | 4.4 | 23 |
| JJ | 18 | M | W | 145 | 72 | 20.1 | 30 | 86 | 31.0 | 0 | 13 | 4.6 | 19 |
| KK | 24 | M | W | 180 | 72 | 25.0 | 7 | 7 | 1.0 | 1 | 16 | 7.9 | 9 |
| LL | 19 | M | W | 155 | 73 | 20.9 | 25 | 51 | 13.5 | 1 | 13 | 5.6 | 13 |
| MM | 19 | M | W | 150 | 72 | 20.8 | 29 | 31 | 1.6 | 1 | 16 | 3.1 | 16 |
| NN | 18 | M | W | 150 | 68 | 23.4 | 14 | 18 | 7.0 | 1 | 16 | 2.1 | 8 |
| OO | 21 | M | W | 200 | 69 | 30.2 | 4 | 4 | 2.2 | 1 | 20 | 1.1 | 6 |
| PP | 21 | M | MOR | 145 | 72 | 20.1 | 26 | 76 | 37.5 | 0 | 16 | 5.1 | 21 |
| 22 | F | MOR | 170 | 64 | 29.9 | 14 | 132 | 19.7 | 0 | 14 | 8.0 | 12 | |
| RR | 23 | M | MOR | 182 | 70 | 26.7 | 28 | 57 | 14.2 | 0 | 17 | 5.9 | 13 |
| SS | 20 | M | W | 175 | 74 | 23.0 | 24 | 46 | 46.0 | 1 | 13 | 7.2 | 15 |
| TT | 21 | M | W | 163 | 72 | 22.6 | 5 | 10 | 0.8 | 2 | 15 | 6.4 | 11 |
| UU | 21 | F | MOR | 135 | 68 | 21.0 | 29 | 58 | 14.5 | 0 | 16 | 4.6 | 20 |
| VV | 22 | F | W | 175 | 70 | 25.7 | 15 | 30 | 7.5 | 1 | 16 | 5.9 | 11 |
| WW | 21 | F | W | 150 | 69 | 22.7 | 19 | 21 | 4.2 | 1 | 17 | 4.1 | 9 |
| XX | 26 | M | W (H) | 190 | 71 | 27.1 | 29 | 87 | 58.0 | 1 | 13 | 12.7 | 6 |
| YY | 18 | M | OTH (H) | 140 | 71 | 20.0 | 8 | 13 | 17.0 | 1 | 13 | 4.6 | 10 |
| ZZ | 20 | F | AA | 141 | 65 | 24.0 | 24 | 48 | 52.0 | 1 | 16 | 3.8 | 15 |
| AAA | 19 | F | W | 135 | 62 | 25.3 | 21 | 42 | 15.7 | 0 | 15 | 3.7 | 19 |
| BBB | 18 | F | W | 185 | 69 | 28.0 | 30 | 155 | 62.0 | 0 | 13 | 5.1 | 25 |
| CCC | 17 | M | W | 135 | 68 | 21.0 | 25 | 25 | 30.0 | 1 | 15 | 1.6 | 8 |
| DDD | 20 | M | W | 160 | 70 | 23.5 | 28 | 57 | 43.0 | 2 | 15 | 4.5 | 19 |
| EEE | 20 | F | W | 145 | 64 | 25.5 | 16 | 36 | 50.5 | 1 | 17 | 2.5 | 8 |
| FFF | 20 | M | W | 201 | 69 | 30.4 | 5 | 6 | 4.8 | 2 | 18 | 1.8 | 9 |
| GGG | 20 | F | W | 160 | 70 | 23.5 | 5 | 9 | 1.8 | 2 | 14 | 5.8 | 6 |
| HHH | 19 | M | W | 165 | 73 | 22.3 | 30 | 66 | 21.0 | 1 | 15 | 3.8 | 12 |
| III | 18 | M | OTH | 145 | 68 | 22.6 | 7 | 9 | 3.8 | 1 | 16 | 2.3 | 12 |
| JJJ | 20 | M | AA | 160 | 71 | 22.9 | 27 | 38 | ---NR | 0 | 16 | 3.7 | 9 |
| KKK | 19 | M | W | 120 | 67 | 19.2 | 29 | 87 | 14.2 | 0 | 15 | 3.9 | 19 |
| LLL | 19 | F | MOR | 186 | 69 | 28.1 | 21 | 25 | 12.5 | 0 | 12 | 7.0 | 20 |
| MMM | 18 | M | AS | 165 | 71 | 23.6 | 28 | 56 | 206 | 1 | 13 | 5.3 | 21 |
| NNN | 15 | M | W | 134 | 69 | 20.3 | 16 | 29 | 14.8 | 1 | 11 | 4.0 | 20 |
| OOO | 19 | M | AA | 170 | 71 | 24.3 | 29 | 87 | 87.0 | 0 | 12 | 7.1 | 10 |
| PPP | 18 | M | AS | 120 | 67 | 19.2 | 16 | 27 | 5.6 | 1 | 13 | 5.5 | 10 |
| QQQ | 18 | F | W | 255 | 74 | 33.5 | 8 | 10 | ---NR | 2 | 13 | 5.6 | 4 |
| RRR | 18 | M | W | 120 | 71 | 17.1 | 19 | 19 | 5.9 | 2 | 14 | 4.5 | 15 |
| Mean | 20.4 | 160 | 68.9 | 24.2 | 20.2 | 44.7 | 1 | 15.2 | 5.2 | 14.1 | |||
| SD | 2.1 | 27 | 3.9 | 3.4 | 8.2 | 33.4 | 0.6 | 2 | 2.4 | 5.6 | |||
| Median | 20 | 160 | 69 | 23.6 | 22 | 37 | 13.8 | 1 | 15 | 4.6 | 14 | ||
| IQR | [19, 21.8] | [138, 175] | [67, 71] | [22.4, 25.7] | [14, 28] | [18, 61] | [5.2, 31] | [1, 1] | [13.3, 17] | [3.7, 6.6] | [10, 19] | ||
| % | 62.9% M | 68.6% W | |||||||||||
| 11.4% AA | |||||||||||||
| 4.3% OTH | |||||||||||||
| 11.4% MOR | |||||||||||||
| 4.3% AS | |||||||||||||
| 10% H | |||||||||||||
Note. AA, African American; AS, Asian; BMI, Body mass index; CUDIT-R, Cannabis Use Disorder Identification Test-Revised; H, Hispanic; in, inches; IQR, interquartile range; lb, pounds; MOR, more than one race; ND, no data; OTH, Other race; W, White; ---NR, Not recorded
Description of analyzed urine specimens
Analyses included 442 urine specimens (M = 6 samples per participant, range: 2 - 7). Data were excluded or not available for the following reasons: non-abstinence (15 data points across 6 participants), lost to follow-up (presumed non-abstinent; 8 data points across 3 participants), insufficient volume for assays due to in-transit leakage (2 data points across 2 participants), sample dilutions not performed when concentrations exceeded the linear range of the assay (21 data points across 11 participants), and data collected prior to verified abstinence (2 data points across 2 participants).
Table 2 summarizes CN-THCCOOH concentrations and Supplementary Appendix 2 provides CN-THCCOOH concentrations by study visit. Large inter-subject variability was observed in both baseline CN-THCCOOH concentrations and decay rates (Figure 1).
Table 2.
Summary of Urine THCCOOH Concentrations
| Urine Creatinine-Adjusted THCCOOH LC/MS/MS (ng/mg; LOQ for THCCOOH= 5 ng/mL) |
|||||||||
|---|---|---|---|---|---|---|---|---|---|
| Study Participant | Days of Abstinencea | Specimens Collectedb | Day of Last Positive Specimenc | Day of First Negative Specimenc | Cestimated at Last Exposure | Cmax-observed | Tmax-observedc | Clast | Tlastc |
| A | 31 | 7 | 3 | 2 | 204 | 107 | 1 | 5.2 | 8 |
| B | 26 | 7 | ---d | 2 | 127 | 10.0 | 2 | 2.5 | 5 |
| C | 29 | 6 | 29 | 9 | 511 | ---f | ---f | 37.7 | 29 |
| D | 28 | 7 | 1 | 2 | 69 | 63.7 | 0 | 4.5 | 21 |
| E | 31 | 4 | 31 | 23 | 102 | ---f | ---f | 21.5 | 31 |
| F | 30 | 6 | 9 | 16 | 122 | ---f | ---f | 13.0 | 30 |
| G | 30 | 7 | 2 | 3 | 214 | 22.3 | 2 | 4.3 | 5 |
| H | 29 | 7 | ---d | 2 | 1223 | 29.2 | 2 | 14.9 | 4 |
| I | 30 | 7 | 2 | 1 | 111 | 21.2 | 1 | 11.5 | 2 |
| J | 18 | 2 | 18 | ---e | 306 | ---f | ---f | 28.0 | 18 |
| K | 27 | 3 | 27 | ---e | 173 | ---f | ---f | 55.9 | 27 |
| L | 31 | 7 | ---d | 2 | 245 | 20.9 | 2 | 0.0 | 4 |
| M | 29 | 7 | 1 | 2 | 1822 | 44.2 | 1 | 18.9 | 2 |
| N | 29 | 7 | 4 | 5 | 366 | 136 | 1 | 14.8 | 8 |
| O | 31 | 7 | 2 | 3 | 129 | 56.6 | 1 | 3.3 | 9 |
| P | 27 | 7 | 1 | 2 | 178 | 85.6 | 1 | 34.5 | 3 |
| Q | 28 | 5 | 28 | 18 | 187 | ---f | ---f | 39.2 | 28 |
| R | 28 | 7 | 3 | 9 | 276 | 123 | 1 | 23.7 | 9 |
| S | 28 | 7 | 5 | 6 | 65 | 29.0 | 2 | 3.2 | 28 |
| T | 29 | 7 | ---d | 1 | 32 | 17.6 | 1 | 11.5 | 3 |
| U | 31 | 7 | 2 | 3 | 74 | 76.7 | 1 | 5.8 | 15 |
| V | 29 | 6 | 23 | 29 | 74 | ---f | ---f | 10.2 | 29 |
| W | 32 | 7 | ---d | 1 | 170 | 29.4 | 1 | 8.8 | 4 |
| X | 29 | 7 | 8 | 3 | 74 | 138 | 1 | 3.3 | 29 |
| Y | 29 | 7 | 6 | 13 | 83 | 145 | 1 | 0.0 | 22 |
| Z | 29 | 6 | 8 | 15 | 177 | ---f | ---f | 15.4 | 22 |
| AA | 29 | 7 | 3 | 2 | 74 | 45.6 | 1 | 19.0 | 3 |
| BB | 29 | 5 | 22 | 29 | 227 | ---f | ---f | 17.0 | 29 |
| CC | 12 | 4 | 2 | 8 | 138 | 223 | 1 | 17.9 | 12 |
| DD | 32 | 7 | 3 | 4 | 22 | 26.7 | 1 | 3.0 | 26 |
| EE | 27 | 3 | 27 | ---e | 148 | ---f | ---f | 108.0 | 27 |
| FF | 28 | 7 | ---d | 1 | 66 | 12.6 | 1 | 6.2 | 3 |
| GG | 29 | 7 | 2 | 4 | 164 | 148 | 1 | 18.5 | 8 |
| HH | 30 | 7 | 4 | 10 | 164 | 213 | 1 | 9.1 | 18 |
| II | 34 | 7 | 9 | 16 | 240 | 211 | 1 | 4.7 | 34 |
| JJ | 28 | 5 | 28 | ---e | 158 | ---f | ---f | 17.4 | 28 |
| KK | 28 | 7 | 15 | 8 | 353 | 161 | 1 | 9.5 | 28 |
| LL | 27 | 6 | 7 | 15 | 815 | 535 | 1 | 24.8 | 15 |
| MM | 31 | 7 | 3 | 10 | 86 | 139 | 1 | 5.8 | 17 |
| NN | 28 | 6 | 1 | 7 | 101 | 40.1 | 0 | 4.5 | 7 |
| OO | 30 | 7 | 2 | 1 | 56 | 8.7 | 2 | 3.4 | 4 |
| PP | 2 | 2 | 0 | 2 | 146 | 257 | 0 | 7.2 | 2 |
| 26 | 7 | 26 | ---e | 371 | 292 | 0 | 43.2 | 26 | |
| RR | 26 | 7 | 1 | 5 | 70 | 91.9 | 0 | 23.5 | 5 |
| SS | 28 | 7 | 28 | ---e | 200 | 178 | 6 | 11.3 | 28 |
| TT | 33 | 7 | 3 | 2 | 68 | 8.8 | 3 | 6.9 | 4 |
| UU | 29 | 7 | 6 | 15 | 165 | 248 | 0 | 17.2 | 20 |
| VV | 29 | 7 | 8 | 15 | 111 | 62.3 | 1 | 6.1 | 29 |
| WW | 31 | 7 | 2 | 3 | 102 | 44.0 | 2 | 4.4 | 8 |
| XX | 27 | 7 | 6 | 13 | 41 | 63.5 | 1 | 2.6 | 27 |
| YY | 28 | 7 | 5 | 6 | 189 | 42.0 | 1 | 8.9 | 8 |
| ZZ | 15 | 4 | 8 | 15 | 208 | 155 | 2 | 29.5 | 15 |
| AAA | 14 | 5 | 6 | 7 | 136 | 138 | 0 | 14.3 | 14 |
| BBB | 28 | 7 | 28 | ---e | 182 | 445 | 0 | 53.1 | 28 |
| CCC | 27 | 7 | 1 | 4 | 127 | 168 | 1 | 9.0 | 11 |
| DDD | 31 | 7 | 16 | 23 | 136 | 340 | 2 | 9.1 | 31 |
| EEE | 28 | 7 | 3 | 7 | 81 | 78.0 | 1 | 0.0 | 21 |
| FFF | 30 | 7 | 2 | 7 | 54 | 47.6 | 2 | 2.1 | 30 |
| GGG | 28 | 7 | 2 | 8 | 146 | 14.4 | 2 | 0.0 | 8 |
| HHH | 26 | 7 | 15 | 21 | 183 | 500 | 1 | 17.9 | 26 |
| III | 29 | 7 | ---d | 1 | 91 | 20.1 | 1 | 1.9 | 6 |
| JJJ | 28 | 7 | 7 | 24 | 122 | 285 | 0 | 11.7 | 24 |
| KKK | 20 | 5 | 6 | 7 | 195 | 344 | 0 | 17.0 | 7 |
| LLL | 28 | 7 | 28 | 7 | 306 | 383 | 0 | 44.8 | 28 |
| MMM | 28 | 7 | 15 | 5 | 59 | 83.6 | 1 | 4.2 | 28 |
| NNN | 12 | 4 | 3 | 8 | 318 | 147 | 1 | 9.0 | 12 |
| OOO | 2 | 3 | 2 | ---e | 431 | 703 | 1 | 518.7 | 2 |
| PPP | 29 | 7 | ---d | 1 | 38 | 18.5 | 1 | 3.9 | 8 |
| QQQ | 30 | 7 | ---d | 2 | 153 | 19.5 | 2 | 6.4 | 5 |
| RRR | 30 | 7 | 5 | 9 | 323 | 247 | 2 | 5.4 | 16 |
| Mean | 27 | 6.3 | 9.4 | 8.1 | 210 | 141 | 1.2 | 22.1 | 16.2 |
| SD | 6.1 | 1.3 | 9.7 | 7.3 | 264 | 148 | 0.9 | 62.5 | 10.5 |
| Median | 29 | 7 | 5 | 6.5 | 147 | 85.6 | 1 | 9.3 | 15 |
| IQR | [27.3, 30] | [6, 7] | [2, 15] | [2, 12.2] | [83.8, 207] | [29.3, 195] | [1, 1.5] | [4.5, 18.4] | [6.2, 27.8] |
Total number of days without cannabis exposure, tabulated from estimated day of last cannabis use.
Includes only analyzable specimens. Samples that were low volume, were beyond the linear range of the assay and were not diluted, as well as those from participants without verifiable abstinence are not included in table. Detailed information on reasons for missing data per participant are provided in Supplemental Appendix 2.
Tabulated from estimated day of last cannabis exposure.
No urines screened positive for cannabinoids as indicated by a rapid dip drug test ≥ 50 ng/mL and non-creatinine-adjusted THCCOOH > 15
No urines screened negative for cannabinoids as indicated by a rapid dip drug test < 50 ng/mL and non-creatinine-adjusted THCCOOH < 15
Not reported because concentrations of initial specimens collected could not be quantitated due to low volume or concentrations beyond the linear range of the assay and were not diluted. See Supplemental Appendix 2 for visit-by-visit descriptives of known specimen concentrations.
Note. Cestimated, Estimated concentration on the day of last cannabis exposure based on PK model; Clast, Concentration of last sample ≥LOQ (5 ng/mL); Cmax-observed, Maximum observed concentration from urine samples collected during the study; IQR, Interquartile range; LOQ, Limit of Quantification; SD, Standard deviation; THCCOOH, 11-nor-9-carboxy-Δ9-tetrahydrocannnabinol; Tlast, Time of Clast tabulated from estimated day of last exposure; Tmax-observed, Time of Cmax-observed.
Figure 1.
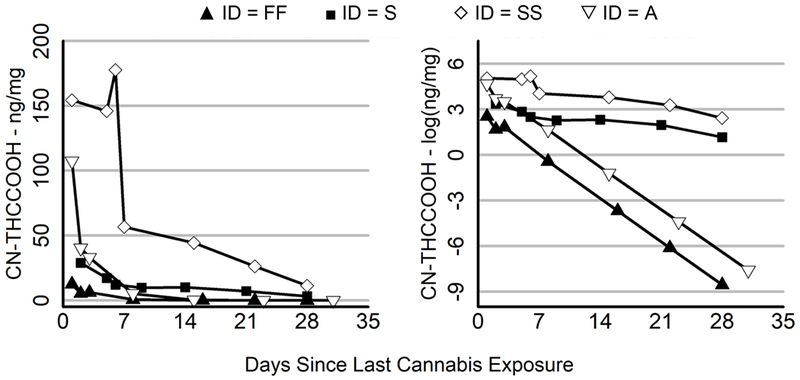
Large Intersubject Variability in Starting THCCOOH Levels and Rates of Decay
Change in CN-THCCOOH (left panel) and the log of CN-THCCOOH (right panel) over days since last cannabis exposure for 4 representative subjects. Filled points refer to two subjects with low starting concentrations of CN-THCCOOH, while empty points refer to two subjects with high starting concentrations of CN-THCCOOH. The triangular symbols refer to two subjects with rapid elimination rates, while the square and diamond symbols refer to two subjects with slow elimination rates.
CN-THCCOOH concentrations on the day of last cannabis exposure
On the day of self-reported last cannabis exposure, the estimated CN-THCCOOH concentration was 148 ng/mg (SD = 157 ng/mg; range: 22 - 1929 ng/mg). Frequency of past month cannabis use predicted baseline urine CN-THCCOOH concentration, with more frequent users having higher concentrations (βFrequency = 0.5, p < 0.001). In contrast, sex, BMI, race, and years of cannabis use were not associated with baseline CN-THCCOOH concentration (i.e., βsex = 0.02, p = 0.4, βBMI = −0.1, p = 0.12, βrace = −0.05, p = 0.27, and βyears = 0.03, p = 0.35).
Rate of CN-THCCOOH decay across 30 days of abstinence
Participants had an average of 27 days of continuous cannabis abstinence (SD = 6; range: 2 - 34 days) from the estimated day of last cannabis use (Table 2). The estimated half-life of CN-THCCOOH was 2.4 days (SD = 5 days). The estimated window of urinary CN-THCCOOH detection (i.e., the number of days before THCCOOH concentration dropped below the LOQ of 5 ng/mL) was 10 days (95% CI: 8 - 13 days; 95% prediction interval: 4 - 80 days; Figure 2). At the final measurement timepoint, among the 62 participants with at least 25 days of self-reported and biochemically-verified cannabis abstinence, 25 (40%) had detectable THCCOOH concentrations (i.e., > 5 ng/mL), and 12 (19%) had both THCCOOH concentrations ≥ 15 ng/mL on LC/MS/MS and ≥ 50 ng/mL on immunoassay, thus would be considered to have a “true positive” test for cannabis exposure by current federal drug testing convention.
Figure 2.
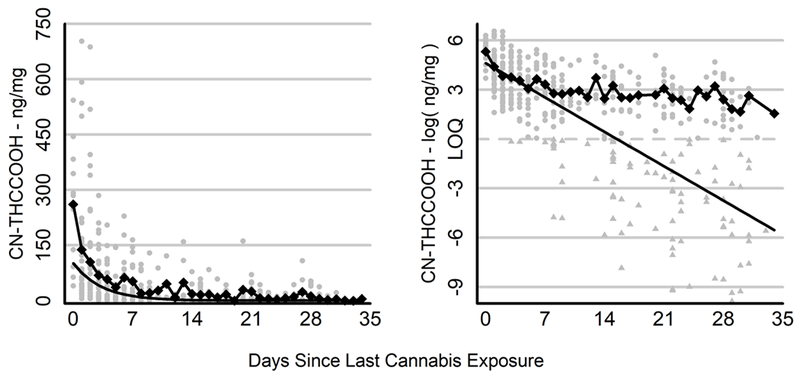
Raw and Estimated Change in CN-THCCOOH Levels Across 30 Days of Cannabis Abstinence
Change in CN-THCCOOH (left panel) and the log of CN-THCCOOH (right panel) over days since last cannabis exposure. Gray points represent the observations for individual participants. Triangles (in right panel) represent values that fell below the limit of quantitation (LOQ; approximated by the dashed line) and were estimated via imputation. Diamonds connected by a line represent mean CN-THCCOOH concentration per day for values above the LOQ, which yielded a variable and potentially biased estimate of the rate of decay during abstinence due to missing data. The solid black line depicts the estimated decline in CN-THCCOOH in the population based on the pharmacokinetic model, which controls for individual differences in CN-THCCOOH levels and missing data.
Estimated initial CN-THCCOOH concentration was correlated with decay rate (r = 0.35, p = 0.002), with higher CN-THCCOOH baseline urine concentrations associated with longer elimination rates. Sex, BMI, race, years of cannabis use, and frequency of past month cannabis use were not significantly associated with decay rate (i.e., βsex = 0.01, p = 0.42, βBMI = 0.05, p = 0.15, βrace = 0.02, p = 0.31, βyears = −0.03, p = 0.23, and βfrequency = 0.07, p = 0.05).
PK model validation
In 5-fold cross-validation with 30 repetitions, the null model was preferred in 13% of repetitions, while the predictive models were preferred 87% of the time. Frequency of cannabis use predicted baseline CN-THCCOOH concentrations in 80% of the predictive models and, in fact, was the only significant predictor 80% of the time. Over the 5 folds and 30 repetitions, 95% predictive coverage intervals for the best-fitting model captured the withheld sample of 14 subjects 98% of the time (range: 85 - 100%), suggesting good model performance. Furthermore, the best-fitting models captured an average of 33% of the variance in CN-THCCOOH (range: 12 - 61%).
Discussion
This study aimed to replicate prior research on the rate of elimination of THCCOOH and extend findings to adolescents and young adults, a relevant subpopulation given the disproportionate heavy rates of use and prevalence of adverse consequences in this age group. An elimination pattern comparable to that reported in prior studies of adults was observed (Huestis and Cone, 1998; Kelly and Jones, 1992), with a rapid decrease in THCCOOH levels during the first 3 days of abstinence followed by a more gradual decrease during subsequent days.
THCCOOH in adolescents and young adults was estimated to have a half-life of approximately 2 days, with an average window of detection of 10 days. Importantly, after 1 month of abstinence, 40% of participants still had detectable urine CN-THCCOOH levels and 20% would have been classified as “positive” per federal drug testing guidelines. Findings are consistent with studies in adults that find a mean urinary excretion half-life of approximately 2 days with GCMS monitoring of THCCOOH for 12 to 14 days (Huestis and Cone, 1998; Kelly and Jones, 1992). Although future studies are needed that directly compare elimination rates in older and younger cohorts, age was not predictive of THCCOOH decay rate in the current study. Thus, the hypothesis is raised that the well-documented association between earlier age of cannabis use and greater adverse consequences (Fischer et al., 2017) is unlikely to be mediated through more protracted exposure to circulating THCCOOH. However, as has been demonstrated with other substances (e.g., Rubinstein et al., 2008; Sofuoglu et al., 2012), this hypothesis needs to be directly tested using studies that evaluate blood or plasma concentrations of THC and its active and inactive metabolites in the days to weeks after cessation of use. Such studies will be ideally positioned to examine whether the magnitude and persistence of cannabinoid presence are associated with withdrawal, susceptibility for Cannabis Use Disorder, and resolution of residual neurocognitive impairment, as well as whether these associations vary by age or age of first cannabis exposure.
Despite all participants having used within 2 days of their baseline visit, substantial variability in both quantitative baseline CN-THCCOOH concentrations and rates of elimination were observed, as evidenced by a predicted window of detection ranging from 4 to 80 days. There was no evidence in this sample that sex, BMI, race, years of cannabis use, or frequency of baseline cannabis use impacted rate of elimination. While other studies have found a longer elimination half-life in daily or near-daily cannabis users compared with occasional users (e.g., (Toennes et al., 2008), this study suggests that frequency of use among adolescent and young adult cannabis users is not a direct correlate of the rate of elimination. Current findings contrast prior reports of higher BMI associated with a longer window of THCCOOH detection (Goodwin et al., 2008). The wider BMI range of 19.5 – 42.5 and higher mean BMI of 25.4 in the study by Goodwin and colleagues (Goodwin et al., 2008), compared to the current study, in which no participants fell into the obese range (mean BMI = 22.9; range: 16.9 – 29.6), may have conferred greater sensitivity for detecting association of BMI with THCCOOH elimination rate. It is also possible that BMI, as measured in the current study, was not the most reliable surrogate measure of adiposity in adolescents. Future studies should consider other factors not examined in the current study as potential moderators of variability in THCCOOH elimination rate. For example, other studies have found conditions that potentiate lipolysis, such as food deprivation, exercise, and stress, modestly increase THC release from adipose tissue (Wong et al., 2013; Westin et al., 2014; Gunasekaran et al., 2009). Additionally, as THC is predominantly hepatically metabolized via cytochrome P450 (CYP 450) isozymes CYP2C9, CYP2C19 and CYP3A4 (Watanabe et al., 2007; Stott et al., 2013; Bland et al., 2005; Schwope et al., 2011; Huestis, 2007), genes and other exogeneous substances that modulate the induction and/or inhibition of these enzymes may alter the pharmacokinetics of THC and its downstream metabolites (Sachse-Seeboth et al., 2009). Lastly, this study found initial THCCOOH concentration to be correlated with elimination rate, and therefore future investigations should consider factors that dictate initial THC burden, including disease states that influence the permeability of blood-tissue barriers (Lucas et al., 2018), cannabis potency (Zendulka et al., 2016; Lucas et al., 2018) and method of consumption (e.g., ingested vs. vaporized vs. smoked).
Most previous work looked at windows of THCCOOH detection as defined by the time of last positive screen and/or first negative screen on binary urinary drug tests (e.g., (Goodwin et al., 2008)). Use of binary detection windows fails to consider the dual influence of both starting THCCOOH concentration and its half-life on the time course of elimination. For example, 2 individuals may have comparable times to last positive screen and/or first negative screen on binary urinary drug tests, but this may be attributable to either of the following plausible scenarios: 1) participant A has a higher starting THCCOOH concentration but a faster rate of elimination than participant B; 2) participant A and B have comparable starting values and rates of elimination. In the present study, initial normalized THCCOOH concentration did not correlate with half-life, further underscoring possible conflation of the two parameters into one estimate of time course of elimination. The PK model used in the current study relies on a non-linear function of both initial THCCOOH concentration and half-life to more accurately estimate the time course of THCCOOH elimination. Use of the PK model will allow future studies to identify predictors associated with only starting concentration or elimination rate.
Generality of findings should be considered in the context of the following limitations. First, although our goal was to obtain 7 specimens from each participant collected seven days apart (aside from the first week of the study), the number of specimens collected per participant ranged from 2 to 7, and the days between collection varied. Although these sources of variability were corrected for by the mixed-effects aspect of the PK model, future studies that collect more specimens per individual will benefit from reduced uncertainty at the subject-level around both starting levels and elimination rates. Second, there were 21 samples that were excluded from analyses because concentrations exceeded the linear range of the assay but dilutions were not performed. Although this only accounts for 4% of the total samples collected, more accurate quantifications for these samples may have improved the prediction data. Third, this study did not consider elimination rates of other cannabinoids (e.g., CBD) as well as other THC metabolites (e.g., 11-OH-THC). Fourth, participants were not required to abstain from other substance use during the 30-day cannabis abstinence protocol, and it is not known how fluctuations in other substance exposure impacts elimination rates (Dube et al., 2015; Anderson and Chan, 2016). Relatedly, due to a low overall endorsement of use, analyses did not control for concomitant prescription drug use and drug-drug interactions cannot be overlooked in this outpatient study.
Additional statistical limitations are also worth discussing. The method used to biochemically confirm sustained cannabis abstinence was developed for daily users (Schwilke et al., 2011), and participants in the present study were required to use at least weekly (51.6% used ≥5 days per week). This discordance in sample characteristics has the potential to result in error rates that are not properly calibrated with those observed by Schwilke and colleagues. However, use of the PK model allows for a conservative approximation of abstinence because any individual for whom exponential decay was not evident would be detected and dropped from analyses, even if no new use was indicated per the Schwilke algorithm. It should be noted that no mismatch between the Schwilke algorithm and results from the PK model were found in the current study of at least weekly cannabis users. Second, frequency of past 90-day cannabis use and time of last cannabis exposure were based on self-report during a TLFB interview. Although this interview has sound psychometric properties and employs techniques to enhance recall (e.g., use of a calendar and memory aids), inaccuracies inherent to retrospective recall remain possible and contribute to the residual noise in the model and measurement error in our predictions. Relatedly, the PK model was used to extrapolate CN-THCCOOH levels on the self-reported day of last use, occasionally resulting in cases in which the estimated level of CN-THCCOOH at last use fell below the observed value at the first baseline measurement due to measurement error. Future work should aim to enroll participants on or before the day of last use to more precisely quantify THCCOOH concentration soon after last exposure, providing a more accurate baseline measurement and minimizing measurement error. Third, the population-level PK model tends to predict lower initial THCCOOH concentrations compared to the average. Difficulty predicting extremely high initial THCCOOH concentrations for a small subset of subjects is most likely attributable to ‘shrinkage,’ an inherent characteristic of multilevel models, in which the model introduces some degree of misfit in subject-level estimates (especially for extreme values) shrinking them towards the population-level estimates. Finally, nearly one quarter of the collected specimens had THCCOOH concentrations that fell below the limit of quantitation; assays with a 2.5 or 1 ng/mL cutoff would have enabled more specimens to be included in the model. We employed a data imputation approach to minimize this loss of information and resolve bias due to left-censored data. However, this approach can still underestimate variability in residual noise. Future research should explore improved methodology, specifically extensions with either 1) multiple imputation approaches, or 2) fully hierarchical tobit regression approaches for PK modeling.
To our knowledge, this is the largest study in terms of number of enrolled participants of THCCOOH elimination and the first to be reported using adolescents. Findings support the use of a population PK model to estimate the half-life of cannabinoids. Further, findings implicate long windows of detection that may result in substantial urinary THCCOOH concentrations even after 1 month of abstinence, as well as significant variability in baseline THCCOOH levels and elimination rates. Therefore, algorithms that account for quantitated levels of THCCOOH assessed longitudinally, creatinine, and time between specimen collections are best equipped to biochemically confirm abstinence. Findings desperately call for novel assays that can be administered at single timepoints that can detect recent cannabis exposure and intoxication in both adults and adolescents.
Supplementary Material
Acknowledgments
Funding:
This publication was made possible by support from NIH-NIDA (1K23DA042946, Schuster; 1R01DA042043-01A1, Gilman; K24 DA030443, Evins), Harvard Medical School (Norman E. Zinberg Fellowship in Addiction Psychiatry and Livingston Fellowship; Schuster), and the Department of Psychiatry at the Massachusetts General Hospital (Louis V. Gerstner III Research Scholar Award; Schuster). The supporters had no role in the design, analysis, interpretation or publication of this study.
Conflict of interest:
There are no competing interests to report for Drs. Schuster, Potter, and Vandrey, as well as Ms. Hareli. Dr. Schoenfeld has received honoraria for advisory board work from Pfizer in the past 5 years for work unrelated to this project. Drs. Gilman and Evins are founders of Brain Solutions, LLC. Dr. Evins has received research grant support to her institution from Pfizer Inc, Forum Pharmaceuticals, and GSK, and honoraria for advisory board work from Pfizer and Reckitt Benckiser in the past 5 years for work unrelated to this project.
Footnotes
Clinical Trial Registration: ; https://clinicaltrials.gov/ct2/show/NCT03276221?term=Randi+Schuster&rank=1
References
- Adamson SJ and Sellman JD. (2003) A prototype screening instrument for cannabis use disorder: the Cannabis Use Disorders Identification Test (CUDIT) in an alcohol-dependent clinical sample. Drug Alcohol Rev 22: 309–315. [DOI] [PubMed] [Google Scholar]
- Agurell S, Nilsson IM, Ohlsson A, et al. (1970) On the metabolism of tritium-labelled 1-tetrahydrocannabinol in the rabbit. Biochem Pharmacol 19: 1333–1339. [DOI] [PubMed] [Google Scholar]
- Amemiya T (1984) Tobit models: A survey. Journal of Econometrics 24: 3–61. [Google Scholar]
- Anderson GD and Chan LN. (2016) Pharmacokinetic Drug Interactions with Tobacco, Cannabinoids and Smoking Cessation Products. Clin Pharmacokinet 55: 1353–1368. [DOI] [PubMed] [Google Scholar]
- Arria AM, Caldeira KM, Vincent KB, et al. (2011) Substance-related traffic-risk behaviors among college students. Drug Alcohol Depend 118: 306–312. [DOI] [PMC free article] [PubMed] [Google Scholar]
- Bergamaschi MM, Karschner EL, Goodwin RS, et al. (2013) Impact of prolonged cannabinoid excretion in chronic daily cannabis smokers’ blood on per se drugged driving laws. Clin Chem 59: 519–526. [DOI] [PMC free article] [PubMed] [Google Scholar]
- Bland TM, Haining RL, Tracy TS, et al. (2005) CYP2C-catalyzed delta9-tetrahydrocannabinol metabolism: kinetics, pharmacogenetics and interaction with phenytoin. Biochem Pharmacol 70: 1096–1103. [DOI] [PubMed] [Google Scholar]
- Bornheim LM, Lasker JM and Raucy JL. (1992) Human hepatic microsomal metabolism of delta 1-tetrahydrocannabinol. Drug Metab Dispos 20: 241–246. [PubMed] [Google Scholar]
- Bürkner PC. (2017) brms: An R Package for Bayesian Multilevel Models using Stan. Journal of Statistical Software. 80: 1–28. [Google Scholar]
- Butler AR. (1975) The Jaffe reaction. Identification of the coloured species. Clin Chim Acta 59: 227–232. [DOI] [PubMed] [Google Scholar]
- Cawley GC and Talbot NLC. (2010) On Over-fitting in Model Selection and Subsequent Selection Bias in Performance Evaluation. J. Mach. Learn. Res 11: 2079–2107. [Google Scholar]
- Cridland JS, Rottanburg D and Robins AH. (1983) Apparent half-life of excretion of cannabinoids in man. Hum Toxicol 2: 641–644. [DOI] [PubMed] [Google Scholar]
- Dackis CA, Pottash AL, Annitto W, et al. (1982) Persistence of urinary marijuana levels after supervised abstinence. Am J Psychiatry 139: 1196–1198. [DOI] [PubMed] [Google Scholar]
- Desrosiers NA, Lee D, Concheiro-Guisan M, et al. (2014a) Urinary cannabinoid disposition in occasional and frequent smokers: is THC-glucuronide in sequential urine samples a marker of recent use in frequent smokers? Clin Chem 60: 361–372. [DOI] [PubMed] [Google Scholar]
- Desrosiers NA, Lee D, Scheidweiler KB, et al. (2014b) In vitro stability of free and glucuronidated cannabinoids in urine following controlled smoked cannabis. Anal Bioanal Chem 406: 785–792. [DOI] [PMC free article] [PubMed] [Google Scholar]
- Dube E, O’Loughlin J, Karp I, et al. (2015) Cigarette smoking may modify the association between cannabis use and adiposity in males. Pharmacol Biochem Behav 135: 121–127. [DOI] [PubMed] [Google Scholar]
- Ehrenreich H, Rinn T, Kunert HJ, et al. (1999) Specific attentional dysfunction in adults following early start of cannabis use. Psychopharmacology (Berl) 142: 295–301. [DOI] [PubMed] [Google Scholar]
- Elkashef A, Vocci F, Huestis M, et al. (2008) Marijuana neurobiology and treatment. Subst Abus 29: 17–29. [DOI] [PMC free article] [PubMed] [Google Scholar]
- Ellis GM Jr., Mann MA, Judson BA, et al. (1985) Excretion patterns of cannabinoid metabolites after last use in a group of chronic users. Clin Pharmacol Ther 38: 572–578. [DOI] [PubMed] [Google Scholar]
- Fischer B, Russell C, Sabioni P, et al. (2017) Lower-Risk Cannabis Use Guidelines: A Comprehensive Update of Evidence and Recommendations. Am J Public Health 107: e1–e12. [DOI] [PMC free article] [PubMed] [Google Scholar]
- Goodwin RS, Darwin WD, Chiang CN, et al. (2008) Urinary elimination of 11-nor-9-carboxy-delta9-tetrahydrocannnabinol in cannabis users during continuously monitored abstinence. J Anal Toxicol 32: 562–569. [DOI] [PMC free article] [PubMed] [Google Scholar]
- Gruber SA, Sagar KA, Dahlgren MK, et al. (2012) Age of onset of marijuana use and executive function. Psychol Addict Behav 26: 496–506. [DOI] [PMC free article] [PubMed] [Google Scholar]
- Gunasekaran N, Long LE, Dawson BL, et al. (2009) Reintoxication: the release of fat-stored delta(9)-tetrahydrocannabinol (THC) into blood is enhanced by food deprivation or ACTH exposure. Br J Pharmacol 158: 1330–1337. [DOI] [PMC free article] [PubMed] [Google Scholar]
- Huestis MA. (2007) Human cannabinoid pharmacokinetics. Chem Biodivers 4: 1770–1804. [DOI] [PMC free article] [PubMed] [Google Scholar]
- Huestis MA and Cone EJ. (1998) Urinary excretion half-life of 11-nor-9-carboxy-delta9-tetrahydrocannabinol in humans. Ther Drug Monit 20: 570–576. [DOI] [PubMed] [Google Scholar]
- Johansson E, Noren K, Sjovall J, et al. (1989) Determination of delta 1-tetrahydrocannabinol in human fat biopsies from marihuana users by gas chromatography-mass spectrometry. Biomed Chromatogr 3: 35–38. [DOI] [PubMed] [Google Scholar]
- Kelly P and Jones RT. (1992) Metabolism of tetrahydrocannabinol in frequent and infrequent marijuana users. J Anal Toxicol 16: 228–235. [DOI] [PubMed] [Google Scholar]
- Kreuz DS and Axelrod J. (1973) Delta-9-tetrahydrocannabinol: localization in body fat. Science 179: 391–393. [DOI] [PubMed] [Google Scholar]
- Lafolie P, Beck O, Blennow G, et al. (1991) Importance of creatinine analyses of urine when screening for abused drugs. Clin Chem 37: 1927–1931. [PubMed] [Google Scholar]
- Lowe RH, Abraham TT, Darwin WD, et al. (2009) Extended urinary Delta9-tetrahydrocannabinol excretion in chronic cannabis users precludes use as a biomarker of new drug exposure. Drug Alcohol Depend 105: 24–32. [DOI] [PMC free article] [PubMed] [Google Scholar]
- Lucas CJ, Galettis P, Song S, et al. (2018) Cannabinoid Disposition After Human Intraperitoneal Use: AnInsight Into Intraperitoneal Pharmacokinetic Properties in Metastatic Cancer. Clin Ther 40: 1442–1447. [DOI] [PubMed] [Google Scholar]
- Musshoff F and Madea B. (2006) Review of biologic matrices (urine, blood, hair) as indicators of recent or ongoing cannabis use. Ther Drug Monit 28: 155–163. [DOI] [PubMed] [Google Scholar]
- O’Malley PM and Johnston LD. (2013) Driving after drug or alcohol use by US high school seniors, 2001–2011. Am J Public Health 103: 2027–2034. [DOI] [PMC free article] [PubMed] [Google Scholar]
- Quinn HR, Matsumoto I, Callaghan PD, et al. (2008) Adolescent rats find repeated Delta(9)-THC less aversive than adult rats but display greater residual cognitive deficits and changes in hippocampal protein expression following exposure. Neuropsychopharmacology 33: 1113–1126. [DOI] [PubMed] [Google Scholar]
- R Core Team (2018) R: A language and environment for statistical computing. Vienna, Austria: R Foundation for Statistical Computing. [Google Scholar]
- Robinson SM, Sobell LC, Sobell MB, et al. (2014) Reliability of the Timeline Followback for cocaine, cannabis, and cigarette use. Psychol Addict Behav 28: 154–162. [DOI] [PubMed] [Google Scholar]
- Rubinstein ML, Benowitz NL, Auerback GM, et al. (2008) A randomized trial of nicotine nasal spray in adolescent smokers. Pediatrics 122: e595–600. [DOI] [PMC free article] [PubMed] [Google Scholar]
- Sachse-Seeboth C, Pfeil J, Sehrt D, et al. (2009) Interindividual variation in the pharmacokinetics of Delta9-tetrahydrocannabinol as related to genetic polymorphisms in CYP2C9. Clin Pharmacol Ther 85: 273–276. [DOI] [PubMed] [Google Scholar]
- Scheidweiler KB, Newmeyer MN, Barnes AJ, et al. (2016) Quantification of cannabinoids and their free and glucuronide metabolites in whole blood by disposable pipette extraction and liquid chromatography-tandem mass spectrometry. J Chromatogr A 1453: 34–42. [DOI] [PMC free article] [PubMed] [Google Scholar]
- Schuster RM, Gilman J, Schoenfeld D, et al. (2018) One Month of Cannabis Abstinence in Adolescents and Young Adults Is Associated With Improved Memory. J Clin Psychiatry 79. [DOI] [PMC free article] [PubMed] [Google Scholar]
- Schuster RM, Hanly A, Gilman J, et al. (2016) A contingency management method for 30-days abstinence in non-treatment seeking young adult cannabis users. Drug Alcohol Depend 167: 199–206. [DOI] [PMC free article] [PubMed] [Google Scholar]
- Schwilke EW, Gullberg RG, Darwin WD, et al. (2011) Differentiating new cannabis use from residual urinary cannabinoid excretion in chronic, daily cannabis users. Addiction 106: 499–506. [DOI] [PMC free article] [PubMed] [Google Scholar]
- Schwope DM, Karschner EL, Gorelick DA, et al. (2011) Identification of recent cannabis use: whole-blood and plasma free and glucuronidated cannabinoid pharmacokinetics following controlled smoked cannabis administration. Clin Chem 57: 1406–1414. [DOI] [PMC free article] [PubMed] [Google Scholar]
- Sofuoglu M, Herman AI, Nadim H, et al. (2012) Rapid nicotine clearance is associated with greater reward and heart rate increases from intravenous nicotine. Neuropsychopharmacology 37: 1509–1516. [DOI] [PMC free article] [PubMed] [Google Scholar]
- Stott C, White L, Wright S, et al. (2013) A Phase I, open-label, randomized, crossover study in three parallel groups to evaluate the effect of Rifampicin, Ketoconazole, and Omeprazole on the pharmacokinetics of THC/CBD oromucosal spray in healthy volunteers. Springerplus 2: 236. [DOI] [PMC free article] [PubMed] [Google Scholar]
- Substance Abuse and Mental Health Services Administration (SAMHSA). (2016) 2015 National Survey on Drug Use and Health: Detailed Tables. Rockville, MD: Center for Behavioral Health Statistics and Quality. [Google Scholar]
- Substance Abuse and Mental Health Services Administration (SAMHSA). (2017) Mandatory Guidelines for Federal Workplace Drug Testing Programs. Rockville, MD: Department of Health and Human Services, 7920–7970. [Google Scholar]
- Swatek R (1984) Marijuana use: persistence and urinary elimination. J Subst Abuse Treat 1: 265–270. [DOI] [PubMed] [Google Scholar]
- Toennes SW, Ramaekers JG, Theunissen EL, et al. (2008) Comparison of cannabinoid pharmacokinetic properties in occasional and heavy users smoking a marijuana or placebo joint. J Anal Toxicol 32: 470–477. [DOI] [PubMed] [Google Scholar]
- Wall ME, Sadler BM, Brine D, et al. (1983) Metabolism, disposition, and kinetics of delta-9-tetrahydrocannabinol in men and women. Clin Pharmacol Ther 34: 352–363. [DOI] [PubMed] [Google Scholar]
- Watanabe K, Yamaori S, Funahashi T, et al. (2007) Cytochrome P450 enzymes involved in the metabolism of tetrahydrocannabinols and cannabinol by human hepatic microsomes. Life Sci 80: 1415–1419. [DOI] [PubMed] [Google Scholar]
- Westin AA, Huestis MA, Aarstad K, et al. (2009) Short communication: Urinary excretion of 11-nor-9-carboxy-Delta(9)-tetrahydrocannabinol in a pregnant woman following heavy, chronic cannabis use. J Anal Toxicol 33: 610–614. [DOI] [PubMed] [Google Scholar]
- Westin AA, Mjones G, Burchardt O, et al. (2014) Can physical exercise or food deprivation cause release of fat-stored cannabinoids? Basic Clin Pharmacol Toxicol 115: 467–471. [DOI] [PMC free article] [PubMed] [Google Scholar]
- Whitehill JM, Rivara FP and Moreno MA. (2014) Marijuana-using drivers, alcohol-using drivers, and their passengers: prevalence and risk factors among underage college students. JAMA Pediatr 168: 618–624. [DOI] [PMC free article] [PubMed] [Google Scholar]
- Wickham HFR, Henry L, Müller K. (2017) dplyr: A Grammar of Data Manipulation. R package version 0.7.4. Available at: https://CRAN.R-project.org/package=dplyr.
- Winward JL, Hanson KL, Tapert SF, et al. (2014) Heavy alcohol use, marijuana use, and concomitant use by adolescents are associated with unique and shared cognitive decrements. J Int Neuropsychol Soc 20: 784–795. [DOI] [PMC free article] [PubMed] [Google Scholar]
- Wong A, Montebello ME, Norberg MM, et al. (2013) Exercise increases plasma THC concentrations in regular cannabis users. Drug Alcohol Depend 133: 763–767. [DOI] [PubMed] [Google Scholar]
- Zendulka O, Dovrtelova G, Noskova K, et al. (2016) Cannabinoids and Cytochrome P450 Interactions. Curr Drug Metab 17: 206–226. [DOI] [PubMed] [Google Scholar]
- Zuccato E, Gracia-Lor E, Rousis NI, et al. (2017) Illicit drug consumption in school populations measured by wastewater analysis. Drug Alcohol Depend 178: 285–290. [DOI] [PubMed] [Google Scholar]
Associated Data
This section collects any data citations, data availability statements, or supplementary materials included in this article.