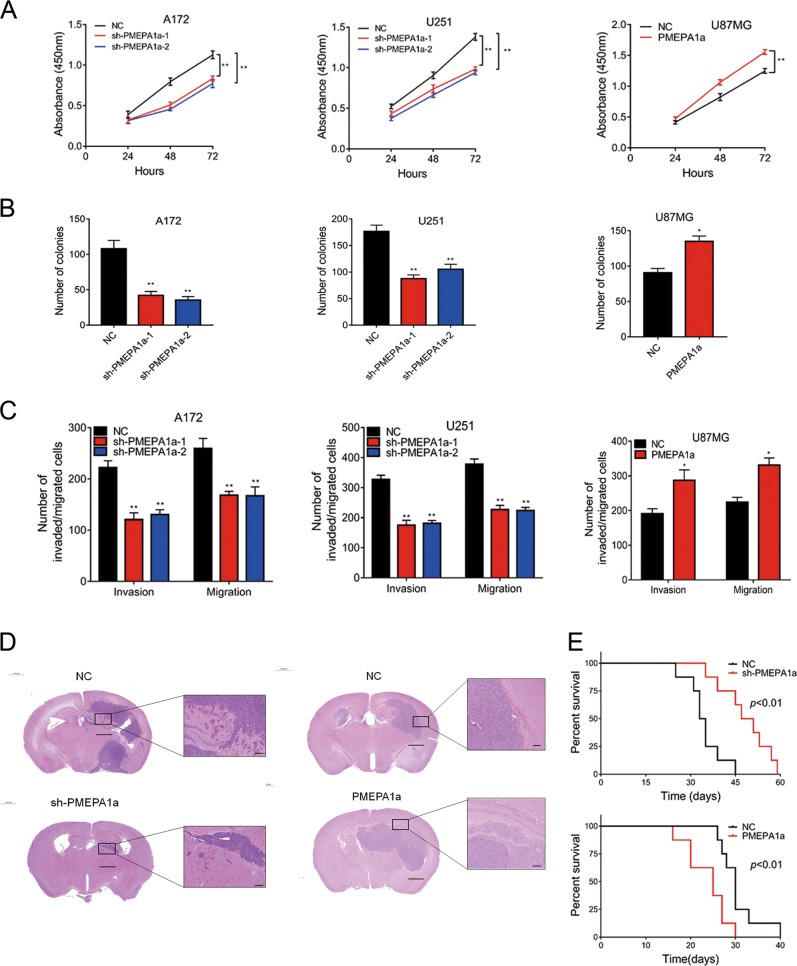
Fig. 2.
PMEPA1a promotes proliferation, migration, and invasion of glioma cells in vitro and in vivo. Cells were examined in a by CCK-8 and in b by colony forming assays. Data are represented as the mean ± SEM. c Graphic analysis of results from transwell assays performed on the indicated cells. Data are represented as the mean ± SEM from three independent experiments. d Representative images of hematoxylin and eosin-stained sections from the brains of nude mice implanted intracranially with modified U251 cells or U87MG cells. Scale bars, 100 µm, 1000 µm. e Kaplan–Meier survival analysis performed with survival data of mice implanted with indicated cells. Log-rank test, P < 0.01. Student’s t-test: n.s. = not significant, *P < 0.05, **P < 0.01

