Abstract
Background and Purpose
This study investigates the antifibrotic activities and potential mechanisms of costunolide (COS), a natural sesquiterpene compound.
Experimental Approach
Rats subjected to bile duct ligation and mice challenged with CCl4 were used to study the antifibrotic effects of COS in vivo. Mouse primary hepatic stellate cells (pHSCs) and human HSC line LX‐2 also served as an in vitro liver fibrosis models. The expression of fibrogenic genes and signaling proteins in the neurogenic locus notch homologue protein 3 (Notch3)–hairy/enhancer of split‐1 (HES1) pathway was examined using western blot and/or real‐time PCR. Notch3 degradation was analysed using immunofluorescence and coimmunoprecipitation.
Key Results
In animals, COS administration attenuated hepatic histopathological injury and collagen accumulation and reduced the expression of fibrogenic genes. COS time‐ and dose‐dependently suppressed the levels of fibrotic markers in LX‐2 cells and mouse pHSCs. Mechanistic studies showed COS destabilized Notch3 and subsequently inhibited the Notch3–HES1 pathway, thus inhibiting HSC activation. Furthermore, COS blocked the WW domain‐containing protein 2 (WWP2)/protein phosphatase 1G (PPM1G) interaction and enhanced the effect of WWP2 on Notch3 degradation.
Conclusions and Implications
COS exerted potent antifibrotic effects in vitro and in vivo by disrupting the WWP2/PPM1G complex, promoting Notch3 degradation and inhibiting the Notch3/HES1 pathway. This indicates that COS may be a potential therapeutic candidate for the treatment of liver fibrosis.
What is already known
Notch3–HES1 pathway is closely associated with hepatic stellate cell activation and liver fibrogenesis.
The degradation of Notch3 is mediated by monoubiquitin‐dependent lysosomal pathway.
What this study adds
The first observation that costunolide attenuates liver fibrosis in two rodent models.
Costunolide blocks the interaction between PPM1G and WWP2 and promotes Notch3 degradation.
What is the clinical significance
Costunolide may be a potential therapeutic candidate for liver fibrosis.
Abbreviations
- BDL
bile duct ligation
- COL1A1
collagen type I α 1 chain
- COS
costunolide
- HES1
hairy and enhancer of split‐1
- LDL‐C
LDL cholesterol
- Notch3
neurogenic locus notch homologue protein 3
- PPM1G
protein phosphatase 1G
- TIMP
tissue inhibitor of metalloproteinase
- WWP2
WW domain‐containing protein 2
- α‐SMA
α‐smooth muscle actin
1. INTRODUCTION
Hepatic fibrosis is caused by the wound‐healing response to various hepatic insults or damage, including hepatitis virus infection, cholestasis, alcohol abuse and non‐alcoholic steatohepatitis (Sun & Kisseleva, 2015). Under normal physiological conditions cytological elements of liver fibrogenesis, hepatic stellate cells (HSCs) remain in a quiescent state. Liver damage and/or stimuli which activate quiescent HSCs convert them into proliferative and migratory myofibroblast‐like cells (Lee, Wallace, & Friedman, 2015). Inappropriate myofibroblast trans‐differentiation results in hepatic dysfunction, progressive fibrosis and eventually cirrhosis.
As a highly conserved intercellular communication system, Notch signaling pathway is essential for cell development and the determination of cell fate, which dysregulation plays a critical role in disease pathogenesis. Notch signaling is initiated by ligand–receptor binding, which triggers sequential proteolytic cleavage processes and releases Notch intracellular domain (NICD) from the Notch receptor (Kopan & Ilagan, 2009). NICD translocates to the nucleus where it directly stimulates the transcription of target genes, such as the hairy/enhancer of split (HES) genes (Andersson, Sandberg, & Lendahl, 2011). Based on accumulating evidence, Notch signaling pathway is important in the various human fibrotic diseases, including cardiac (Fan, Yao, & Zhang, 2018), renal (Jiang et al., 2018) and hepatic fibrosis (Duan et al., 2018). Up‐regulation of Notch signaling pathway contributes to the activation of rat primary HSCs (Zhang, Xu, et al., 2015). Similar results have also been described in carbon tetrachloride (CCl4)‐challenged rats and such activation can be blocked by inhibiting Notch pharmacologically (Chen, Weng, & Zhang, 2012). Patients with Alagille syndrome, a genetic disorder that is caused by a Notch pathway mutation (Kamath et al., 2012), suffer from severe liver damage and cholestasis (Fabris et al., 2007).
Currently, few antifibrotic treatment strategies are available. Thus there is an urgent clinical need for the development of antifibrotic candidates that specifically target HSCs. Our laboratory is engaged in evaluating the antifibrotic activities of natural compounds (Ge et al., 2017). Based on previous results, we found that costunolide (COS), a natural sesquiterpene lactone isolated from Saussurea lappa (Compositae), was as a potential anti‐hepatic fibrosis agent (Figure 1a). Costunolide displays a wide spectrum of biological functions, including anti‐inflammatory (Park, Song, Kim, Park, & Kim, 2016) and anti‐proliferative (Dong, Shim, Hyeon, Lee, & Ryu, 2015) activities. However, its antifibrotic effect remains unclear. Our study is first to verify the antifibrotic effect of costunolide on the human stellate cell line LX‐2, mouse pHSCs, and experimental CCl4‐ and bile duct ligation (BDL)‐induced liver fibrosis models and the data obtained led to the identification of its possible mechanism action.
Figure 1.
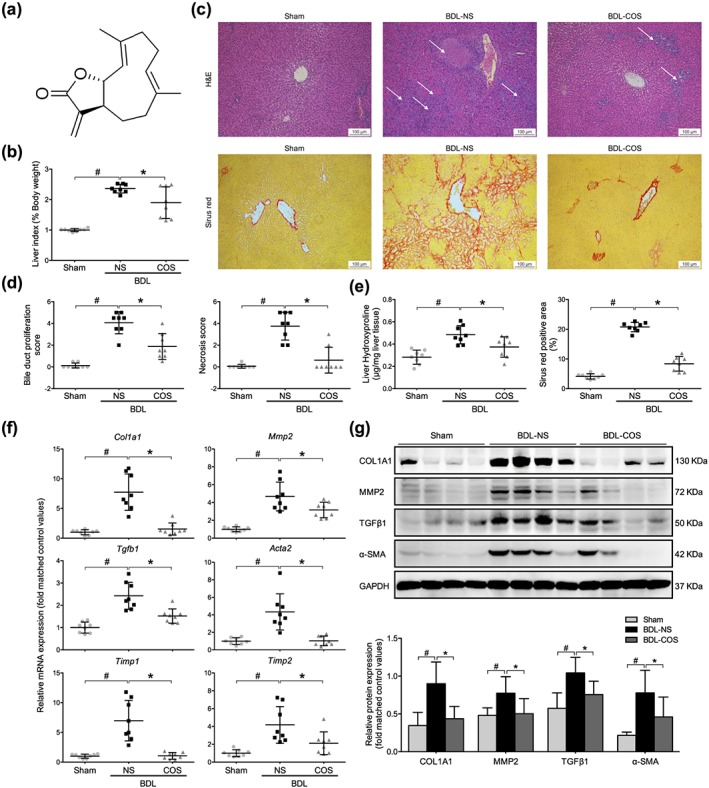
Costunolide (COS) markedly ameliorated the liver fibrosis in bile duct‐ligated (BDL) rats. (a) The structure of COS. (b) The relative liver weight of sham, BDL‐NS, and BDL‐COS groups. (c) Liver pathological changes were detected by H&E staining (magnification 400×; up panel). The degree of liver collagen accumulation was determined by sirius red straining (magnification 400×; down panel). (d) Blinded quantitative assessment of liver bile duct proliferation and hepatic necrosis indicated that COS ameliorated BDL‐induced histopathological changes. (e) Liver hydroxyproline concentration assays and percentage of sirius red positively strained areas demonstrated that COS reduced liver fibrosis in BDL rats. (f) mRNA expressions of Col1a1, Mmp2, Tgfb1, Acta2 and Timp1/2 in rat liver sample. (g) Western blot analysis and semi‐quantitation of collagen 1a1 (COL1A1), MMP2, TGFβ1 and α‐SMA expressions of these three groups. Gapdh/GAPDH served as the loading control. The values are expressed as the mean ± SD (n = 8 of each group), # P < .05, significantly different from sham group and * P < .05, significantly different from BDL‐NS group; ANOVA followed by Tukey's test
2. METHODS
2.1. Animals and experimental design
All animal experiments were approved by the local Institutional Animal Care and Use Committee (Beijing, China) and conducted according to the protocols described by the guideline for the testing of drugs. Animal studies are reported in compliance with the ARRIVE guidelines (Kilkenny, Browne, Cuthill, Emerson, & Altman, 2010; McGrath & Lilley, 2015) and with the recommendations made by the British Journal of Pharmacology. Male Sprague–Dawley rats (6 weeks old; 160–180 g, specific pathogen‐free class) and male BALB/c mice (18–20 g, specific pathogen‐free class) were purchased from Vital River Laboratory Animal Technology Co., Ltd (Beijing, China). Six‐week‐old mice were used for CCl4‐induced hepatic fibrosis model and 12‐week‐old mice were used for mouse primary HSCs isolation. Animals were maintained in an environmentally controlled room (pathogen‐free, 20–24°C, 40–60% relative humidity and 12‐hr alternating light/dark cycle). Laboratory animals were randomly assigned to groups of equal size. Analysis of all animal samples was carried out in a blinded manner.
2.2. Bile duct ligation (BDL) surgery in rats
Twenty‐four rats were randomly assigned into three groups (sham, BDL‐NS, and BDL‐COS groups) followed by a randomization procedure (http://www.randomizer.org/, Research Randomizer, https://scicrunch.org/resources/Any/search?q=SCR_008563&l=SCR_008563), with eight animals per group. Sixteen rats were prepared for BDL surgery. After the rats were anaesthetized with ihttps://www.guidetopharmacology.org/GRAC/LigandDisplayForward?ligandId=2505, the rat abdomen was opened. The choledochal duct was isolated and ligated using surgical sutures. Twenty‐four hours after surgery, animals subjected to BDL were randomly divided into two groups and received daily gavages with either a normal saline solution (BDL‐NS group) or 80 mg·kg−1 COS suspended in 0.5% sodium carboxymethylcellulose solution (BDL‐COS group) for 14 days. A sham operation was also performed on eight rats (sham group) to create a healthy control group. Body weights were measured daily. After an overnight fast, blood samples were collected from the abdominal aorta and the animals were killed using isoflurane. Rat liver maximum lobule was collected. Some liver tissue samples were fixed with 4% paraformaldehyde for subsequent histological examination and others were stored at −80°C for subsequent analyses.
2.3. Mouse model of CCl4‐induced hepatic fibrosis
Twenty‐four mice were also assigned into three groups (control, CCl4‐corn oil, and CCl4‐COS groups) followed by a randomization procedure (http://www.randomizer.org/, Research Randomizer, https://scicrunch.org/resources/Any/search?q=SCR_008563&l=SCR_008563), with eight animals per group. A mouse model of liver fibrosis was established by intraperitoneally injecting of 10% CCl4 mixed with corn oil for 8 weeks (10 μl·g−1, twice a week). Sixteen mice were randomly divided into two groups (n = 8 mice per group): the model group (received only the CCl4‐corn oil injection) and the COS‐treated group (received the CCl4 injection and a concurrent 80 mg·kg−1 COS gavage began during the fourth week of CCl4 treatment). The control group (n = 8) was intraperitoneally injected with corn oil alone for 8 weeks. Blood samples (200 μl) were collected from the retro‐orbital venous plexus of overnight‐fasted mice and then the mice were killed under anaesthesia. Mouse liver maximum lobule was collected. Some liver tissue samples were fixed with 4% paraformaldehyde for subsequent histological examination and others were stored at −80°C until further experiments.
2.4. Serum biochemical parameters and bile acid detection
Serum alanine aminotransferase, aspartate aminotransferase, alkaline phosphatase, γ‐glutamyl transpeptidase, total cholesterol, triglyceride, LDL cholesterol (LDL‐C), HDL cholesterol, total bile acid and total bilirubin concentrations were analysed with a Hitachi 7100 Analyzer using kits purchased from Zhongsheng Beikong Biotechnology (Beijing, China).
2.5. Histological analysis of liver tissue samples
Formalin‐fixed, paraffin‐embedded liver tissue sections were stained with haematoxylin, eosin and sirius red. Liver necrosis, bile duct proliferation and hepatic inflammation were quantified in a blinded manner on a 1‐ to 5‐point scale using a Leica DM1000 microscope. Sirius red‐stained sections from each animal were observed at low magnification and analysed using ImageJ software (NIH open source; https://imagej.nih.gov/ij/download.html, https://scicrunch.org/resources/Any/search?q=SCR_003070&l=SCR_003070) to calculate the percentage of hepatic fibrous area. The liver hydroxyproline concentration was measured as previously described (Ge et al., 2017).
2.6. Cell culture, isolation and treatment
The human HSC line LX‐2 (Millipore Cat# SCC064, https://scicrunch.org/resources/Any/search?q=CVCL_5792&l=CVCL_5792) was maintained in DMEM/GlutaMAX I (Invitrogen, 10566016) supplemented with 10% FBS and 1% penicillin/streptomycin (Invitrogen, Carlsbad, CA, USA). Upon reaching 60–80% confluences, the cells were starved in serum‐free DMEM/GlutaMAX I for 24 hr prior to treatment with 2 ng·ml−1 TGFβ1 and/or COS (dissolved in DMSO). Mouse primary HSCs (mouse pHSCs) were isolated using previously reported procedures (Mederacke, Dapito, Affo, Uchinami, & Schwabe, 2015). Briefly, the liver of anaesthetized mouse elder than 12 weeks was sequentially perfused with an EGTA solution for 2 min, a pronase solution for 5 min and collagenase IV plus DNase I for 7 min through the hepatic portal vein. Then, the minced liver was transferred to the prewarmed pronase/collagenase solution containing 1% (vol/vol) DNase I and stirred at 40°C for 25 min. The digested mouse liver was filtered through a 70‐μm cell strainer and centrifuged at 580×g for 10 min (4°C). The cell pellet was then subjected to discontinuous density gradient centrifugation in the presence of Nycodenz solution. Cells were cultured in DMEM (high glucose) containing 10% FBS and 1% antibiotics. Mouse pHSCs were plated in untreated flasks and can exhibit a fibroblast‐like morphology after 7 days. Therefore, they did not need FBS‐free starvation or TGFβ1 stimulation (De Minicis et al., 2007). Primary cultures are reported in compliance with the ARRIVE guidelines (McGrath & Lilley, 2015). HEK293T cells (https://web.expasy.org/cellosaurus/CVCL_0063) were cultivated in DMEM with 10% FBS and 1% antibiotics. All of these cells were incubated at 37°C in a 5% CO2 atmosphere. LX‐2 and HEK293T cells were transiently transfected with plasmids or siRNAs using the Lipofectamine 2000 reagent (Invitrogen, 11668019) and Opti‐MEM serum‐free medium (Invitrogen, 1930104) according to the manufacturer's instructions.
2.7. Quantitative real‐time PCR
Total RNA was extracted and purified from cells and liver tissue samples using TRIzol reagent (Life Technologies) and a NucleoSpin RNA Clean‐up Kit (Macherey‐Nagel, Duren, Germany). Equal amounts of total RNA were reverse‐transcribed into cDNAs using a Transcriptor First Strand cDNA Synthesis Kit (Roche). Relative gene expression was determined with an ABI 7500 Fast Real‐Time PCR system. ABI TaqMan primers/probes were purchased from Applied Biosystems (Foster City, CA, USA). The GAPDH/Gapdh served as an internal control for mRNA expression. The fold change in target mRNA expression was calculated using the equation 2−ΔΔCt.
2.8. Immunoprecipitation and western blot analysis
RIPA lysate buffer (Beyotime Biotechnology, P0013B) containing 1% PMSF was used to extract the total proteins from cells and hepatic tissues. Protein concentrations were measured using a BCA kit (Beyotime Biotechnology, P0009). After immunoprecipitating, proteins with the appropriate antibodies overnight at 4°C and incubating the complexes with Protein A/G Plus‐agarose (Santa Cruz Biotechnology, sc‐2003) for 4 hr at 4°C, total cell lysates were washed five times, mixed with 2× SDS loading buffer, and boiled for 10 min. Equal amounts of immunocomplexes or lysates were electrophoresed on SDS‐PAGE gels and transferred to PVDF membranes. Membranes were blocked with 5% skim milk in PBS‐T buffer (PBS containing 0.2% Tween 20) at room temperature for 1 hr and then immunoblotted with primary antibodies overnight at 4°C. Peroxidase‐conjugated secondary antibodies were then applied to the membranes and incubated for 1 hr at room temperature. Electrochemiluminescence was performed according to the manufacturer's instructions with a ProteinSimple FluorChem HD2 imaging system. GADPH was served as an internal control. Both immunoprecipitation assay and western blot have been conducted the experimental detail provided conforms with BJP Guidelines (Alexander et al., 2018). The immuno‐related procedures used comply with the recommendations made by the British Journal of Pharmacology.
2.9. Nuclear and cytoplasmic protein extraction
Nuclear and cytoplasmic proteins were extracted from LX‐2 cells using the Nuclear‐Cytosol Extraction Kit (Applygen Technologies Inc., Beijing, China). The extracts were mixed with 2× SDS loading buffer and analysed using western blot as described above.
2.10. Confocal assay
LX‐2 cells were plated on glass cover slips in a dish. After exposure to different treatments, the cells were washed three times with PBS, fixed with 4% paraformaldehyde for 20 min and then permeabilized with 0.5% Triton X‐100 for 30 min at room temperature. Next, the cells were incubated with specific primary antibodies overnight at 4°C. Cells were washed three times with PBS and subsequently incubated with a fluorochrome‐labelled secondary antibody for 1 hr at room temperature. The cells were then rinsed three times with PBS and the nuclei were counterstained with DAPI for 5 min at room temperature. Images were captured using a Leica SP2 confocal microscope (Leica Microsystems, Exton, PA).
2.11. Reagents
An anti‐α‐smooth muscle actin antibody (α‐SMA; A5228), CHX (01810) and cadmium chloride (CdCl2, 202908) were purchased from Sigma‐Aldrich (St Louis, MO, USA). Anti‐http://www.guidetopharmacology.org/GRAC/ObjectDisplayForward?objectId=2860 (#5276, https://scicrunch.org/resources/Any/search?q=AB_10560515&l=AB_10560515), anti‐Notch1 (#3608), anti‐Notch2 (#5732), anti‐HES1 (#11988), anti‐lysosome‐associated membrane glycoprotein 1 (LAMP1; #15665), anti‐http://www.guidetopharmacology.org/GRAC/ObjectDisplayForward?objectId=1629 (#40994), anti‐ubiquitin (#3936 and #3933), anti‐GAPDH (#5174) anti‐Tubulin (#2148) antibodies and normal rabbit IgG (#2729) were obtained from Cell Signaling Technology (Danvers, MA, USA). Anti‐http://www.guidetopharmacology.org/GRAC/LigandDisplayForward?tab=summary&ligandId=4898 (PAB17205) and anti‐http://www.guidetopharmacology.org/GRAC/LigandDisplayForward?ligandId=5060 (ab179695) antibodies were purchased from Abnova (Colorado, USA) and Abcam. Anti‐HA‐Tag (51064‐2‐AP and 66006‐1‐Ig), anti‐Flag‐Tag (20543‐1‐AP), anti‐WW domain‐containing protein 2 (WWP2; 12197‐1‐AP) and anti‐protein phosphatase 1G (PPM1G; 15532‐1‐AP) antibodies were purchased from Proteintech (Wuhan, China). MG132 (S2619) was acquired from Selleck (Shanghai, China). Notch3 siRNA (SIGS0007282‐1), HES1 siRNA (SIGS0006714‐1) and WWP2 (SIGS0014969‐1) were acquired from RiboBio (Guangzhou, China). TGFβ1 (240‐B) was obtained from R&D Systems (Minneapolis, MN, USA). Costunolide (COS) was obtained from Spring & Autumn Biological Engineering Co., Ltd. (Nanjing, China). Additional materials were obtained from commercial sources.
2.12. Data and analysis
All data are presented as the mean ± SD. For all animal experiments, eight randomized animals were included in each group. For in vitro experiments, five independent repeat experiments were carried out. The value of control group was regarded as “1.” And other test values were indicated as relative fold value based on control value. In the figures, the Y axis is labelled as “fold matched control values” after data transformation.
Statistical analysis was undertaken only for at least five independent experiments and other data was not statistically analysed owing to group sizes of n < 5. The data were analysed using one‐way ANOVA with Tukey's post hoc test when F achieved P < .05 and there was no significant variance in homogeneity (SPSS, version 23.0, SPSS Inc., Chicago, IL. https://scicrunch.org/resources/Any/search?q=SCR_002865&l=SCR_002865). The results were considered statistical significance at P < .05. The data and statistical analysis comply with the recommendations of the British Journal of Pharmacology on experimental design and analysis in pharmacology (Curtis et al., 2018).
2.13. Nomenclature of targets and ligands
Key protein targets and ligands in this article are hyperlinked to corresponding entries in http://www.guidetopharmacology.org, the common portal for data from the IUPHAR/BPS Guide to PHARMACOLOGY (Harding et al., 2018) and are permanently archived in the Concise Guide to PHARMACOLOGY 2017/18 (Alexander, Fabbro, et al., 2017; Alexander, Kelly, et al., 2017).
3. RESULTS
3.1. Costunolide (COS) attenuated Bile duct ligation (BDL)‐induced liver injury and hepatic fibrosis in rats
BDL can cause severe hepatocellular injury and liver fibrosis. As expected, the liver to body weight ratio along with the levels of serum biochemical markers were significantly increased in the BDL‐NS group compared with the sham group. These changes were significantly reduced by COS administration (Table 1 and Figure 1b). Haematoxylin and eosin staining revealed the formation of regenerative bile ducts, the rearrangement of liver lobular structures and prominent hepatic necrosis in rats subjected to the BDL surgery. Again these pathological changes were ameliorated by the COS treatment (Figure 1c). In a blinded assessment, lower scores for bile duct proliferation, necrosis and inflammation reflected improvements in the liver architecture of the COS‐treated group compared with the BDL‐NS group (Figures 1d and S1A). Collagen‐specific sirius red staining was utilized to visualize and evaluate the degree of fibrosis. Extensive hepatic collagen deposition, including the formation of pericellular bridging fibrosis, was observed in the BDL‐challenged rats, but the COS intervention substantially attenuated collagen accumulation in the liver (Figure 1c,e). The severity of liver fibrosis was also biochemically assessed by measuring the hepatic hydroxyproline content. COS markedly decreased the BDL‐induced increase in the hydroxyproline content (Figure 1e).
Table 1.
Serum biochemical markers of bile duct ligated (BDL)‐treated rats
| Sham (n = 8) | BDL‐NS (n = 8) | BDL‐COS (n = 8) | |
|---|---|---|---|
| ALT (U·L−1) | 22.63 ± 9.29 | 116.63 ± 49.57# | 60.75 ± 32.20* |
| AST (U·L−1) | 123.13 ± 55.16 | 776.50 ± 327.28# | 371.38 ± 221.08* |
| ALP (U·L−1) | 170.00 ± 81.33 | 357.75 ± 148.64# | 261.75 ± 106.88* |
| GGT (U·L−1) | 0.25 ± 0.73 | 33.75 ± 19.10# | 19.25 ± 18.35 |
| Serum TBA (μmol·L−1) | 10.56 ± 4.59 | 119.34 ± 47.10# | 109.74 ± 84.03 |
| Serum TBiL (μmol·L−1) | 0.44 ± 0.56 | 149.19 ± 58.26# | 63.21 ± 63.17* |
Values are presented as the mean ± SD (n = 8 animals per group).
P < .05, significantly different from the sham group.
P < .05, significantly different from the BDL‐NS group; ANOVA followed by Tukey's test.
The expression of hepatic fibrogenic markers, including https://www.guidetopharmacology.org/GRAC/LigandDisplayForward?ligandId=5060, Acta2, https://www.guidetopharmacology.org/GRAC/LigandDisplayForward?ligandId=4898, https://www.guidetopharmacology.org/GRAC/LigandDisplayForward?ligandId=4472, and tissue inhibitor of https://www.guidetopharmacology.org/GRAC/LigandDisplayForward?ligandId=6655 (http://www.guidetopharmacology.org/GRAC/LigandDisplayForward?ligandId=5309) and http://www.guidetopharmacology.org/GRAC/LigandDisplayForward?ligandId=5310, were detected to assess the antifibrotic effects of COS in vivo. COS supplementation significantly decreased the mRNA expression of these fibrogenic genes (Figure 1f). Western blot assays also detected lower protein levels of TGFβ1, α‐SMA, MMP2, and COL1A1 in the liver tissues from the COS‐treated group compared with the BDL‐NS group (Figure 1g). Based on these results, COS exerts hepatoprotective and antifibrotic effects on cholestatic liver injury model.
3.2. COS attenuated CCl4‐induced liver injury and hepatic fibrosis in mice
CCl4 induces liver fibrosis by producing various reactive metabolites and damaging hepatocytes. Significant elevation in serum alanine aminotransferase, HDL cholesterol, LDL‐C, triglyceride, and total bile acid levels were observed in the CCl4‐treated mice compared with the control mice. However, COS administration notably reduced only the serum LDL‐C levels, although other biochemical markers showed non‐significant changes (Table S1). After 8 weeks of CCl4 injections, the mice exhibited marked increases in hepatic inflammatory cell infiltration and fibrous collagen deposition. The COS treatment improved these pathological changes and protected against CCl4‐induced fibrosis (Figures 2a–c and S1B). The mRNA and/or protein levels of fibrogenic markers were prominently increased in the CCl4 treatment group compared with the control group, while they were dramatically lowered by the COS intervention (Figure 2d,e). Based on these observations, the COS treatment inhibits the progression of CCl4‐induced hepatic fibrosis in mice.
Figure 2.
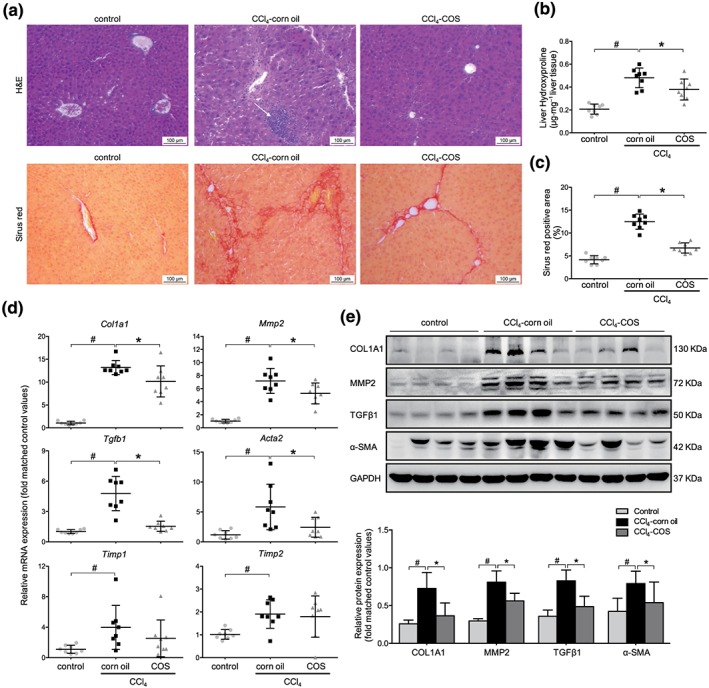
Costunolide (COS) markedly ameliorated the liver fibrosis in CCl4‐treated mice. (a) Liver histopathology was observed by H&E staining (magnification 400×; up panel). The obtained liver sections were subjected to sirius red staining (magnification 400×; down panel). (b) Liver hydroxyproline concentration assays and (c) percentage of sirius red positively strained areas demonstrated that COS reduced liver fibrosis in CCl4 mice. (d) mRNA expressions of Col1a1, Mmp2, Tgfb1, Acta2, and Timp1/2 in mice liver samples. (e) Western blot analysis and semi‐quantitation of collagen 1a1 (COL1A1), MMP2, TGFβ and α‐SMA expressions of these three groups. Gapdh/GAPDH served as the loading control. The values are expressed as the mean ± SD (n = 8 of each group), # P < .05, significantly different from control group and * P < .05, significantly different from CCl4‐corn oil group; ANOVA followed by Tukey's test
3.3. COS suppressed hepatic fibrogenic gene expression in HSCs
The antifibrotic effects of COS were evaluated in vitro. In the context of FBS‐free starvation and TGFβ1 stimulation, LX‐2 cells display an activated phenotype in vitro. As mouse pHSCs exhibit self‐activation, they do not require starvation and stimulation during in vitro culture. The mRNA levels of various fibrogenic markers, including https://www.guidetopharmacology.org/GRAC/LigandDisplayForward?ligandId=5060 (Tgfb1), ACTA2 (Acta2), https://www.guidetopharmacology.org/GRAC/ObjectDisplayForward?objectId=1629 (Mmp2), and https://www.guidetopharmacology.org/GRAC/LigandDisplayForward?ligandId=4898 (Col1a1), were significantly decreased after COS treatment in both TGFβ1 stimulated LX‐2 cells (Figure 3a) and mouse pHSCs (Figure 3d). The COS administration also dose‐ and time‐dependently inhibited the protein levels of these markers in these cells (Figure 3b,c,e,f). Thus, COS is a potent antifibrogenic agent in HSCs.
Figure 3.
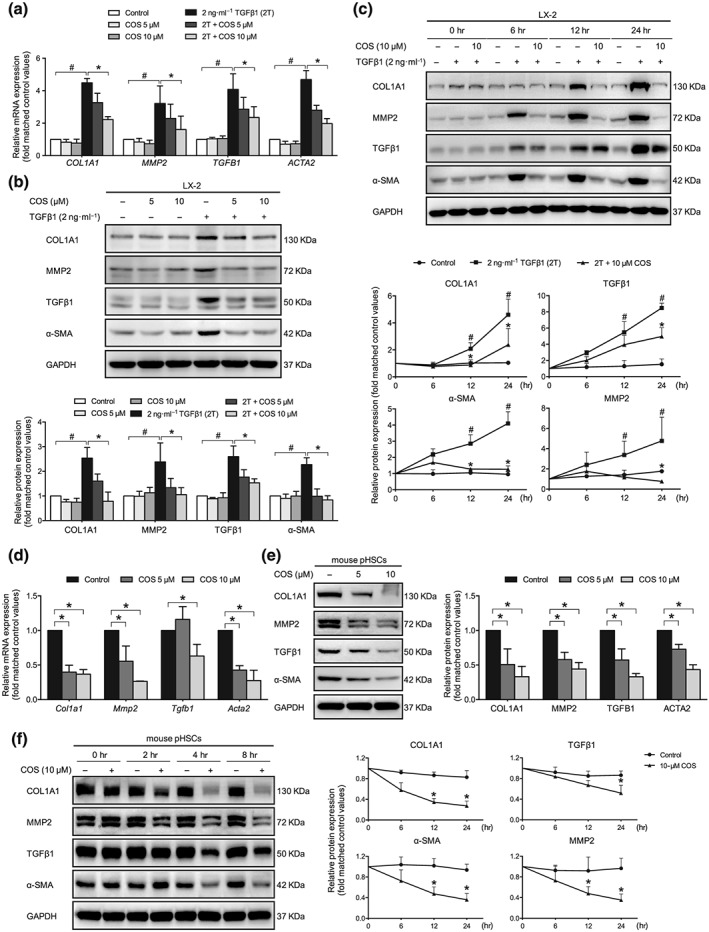
Identification of the antifibrotic effects of costunolide (COS) in vitro. LX‐2 cells were treated with 2 ng·ml−1 TGFβ1 with or without different concentrations of COS for 24 hr after no FBS starvation. Mouse pHSCs were treated with different concentrations of COS for 24 hr after 7 days of isolation. COS repressed the COL1A1, MMP2, TGFB1 and ACTA2 in a dose‐dependent manner in (a) LX‐2 cells and (d) mouse pHSCs. GAPDH/Gapdh served as loading control. COS dose‐ and time‐dependently inhibited the protein levels of COL1A1, MMP2, TGFβ1, and α‐SMA in (b and c) LX‐2 cells and (e and f) mouse pHSCs. The protein levels were normalized against GAPDH. The values are expressed as the mean ± SD of five independent assays, # P < .05, significantly different from the control group and * P < .05, significantly different from the TGFβ1 treatment group in LX‐2 cells; * P < .05, significantly different from the control group in mouse pHSCs; ANOVA followed by Tukey's test
3.4. COS inhibited the Notch3–HES1 pathway
Recent studies have reported that a positive correlation exists between HSC activation and Notch overexpression (Chen, Weng, & Zhang, 2012). Due to the down‐regulated Notch1 expression and elevated Notch3 expression during the culture‐dependent activation of HSCs (Reister, Kordes, Sawitza, & Haussinger, 2011), Notch3 may be more associated with liver fibrogenesis than Notch1. The COS administration did not affect the protein levels of the Notch1 and Notch2 intracellular domains (NICD1 and NICD2) in LX‐2 cells, but the Notch3 intracellular domain (NICD3) level was obviously diminished (Figures 4b and S2A). The inhibitory effects of COS on the expression of Notch3 and its downstream target gene, HES1, were also determined in liver tissue samples from CCl4‐ and BDL‐induced liver fibrosis animals (Figures 4a and S2B). Moreover, Notch3–HES1 pathway was predominantly repressed in a dose‐ and time‐dependent manner in COS‐treated LX‐2 cells. Similar results were also observed in mouse pHSCs (Figures 4b and S2C–E). Once the Notch3 pathway is activated, Notch3 will be exposed to sequential proteolytic cleavage processes that release NICD3. NICD3 subsequently enters the nucleus where it directly promotes the transcription of its target genes, such as HES1, and executes most biological processes (Fiuza & Arias, 2007). As expected, the COS treatment blocked the nuclear localization of NICD3 and suppressed HES1 transcription in LX‐2 cells (Figure 4c,e). In addition, we further explored whether COS governs the Notch3–HES1 pathway through transcription or degradation. The level of NOTCH3 mRNA was unchanged in the presence of COS, but the mRNA expression of HES1 was significantly decreased (Figure 4d). The COS intervention also enhanced the degradation of NICD3 in cycloheximide (CHX)‐treated LX‐2 cells (Figure 5a). These data revealed that COS post‐translationally regulates NICD3 and inhibits the Notch3–HES1 pathway.
Figure 4.
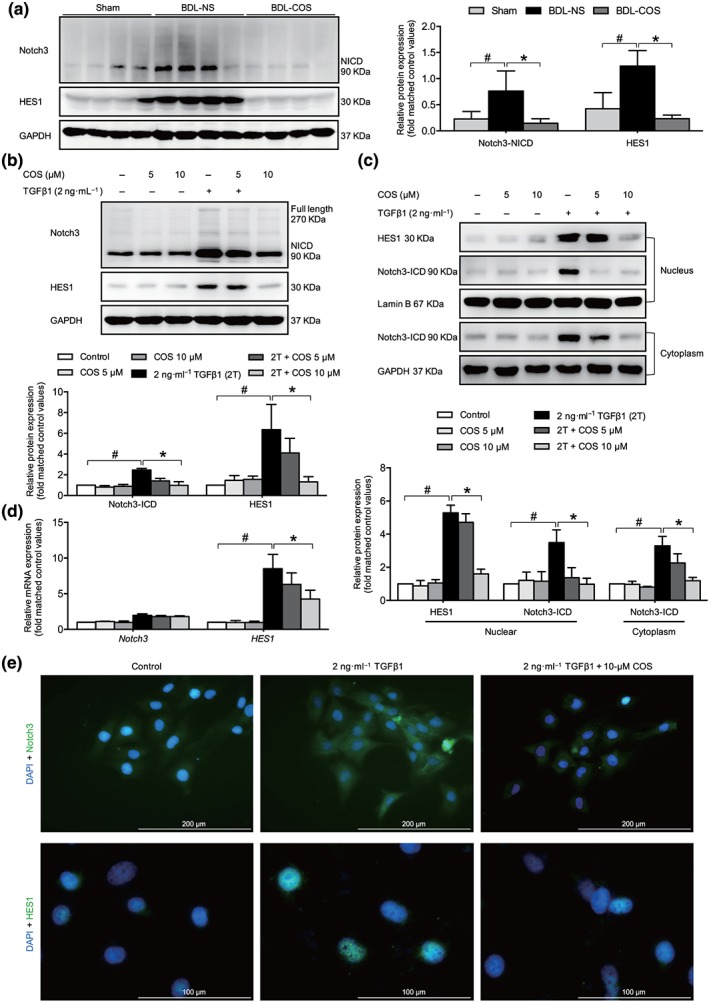
Costunolide (COS) suppressed the Notch3/HES1 pathway in vitro and in vivo. COS administration down‐regulated Notch3 especially NICD3 and HES1 protein expressions in BDL livers (a) and LX‐2 cells (b). (c) The nuclear and cytoplasmic extractions of LX‐2 cells were separated after COS treatment and analysed by western blot. (d) mRNA expressions of NOTCH3 and HES1 in LX‐2 cells. The mRNA/protein expression levels were normalized against GAPDH/GAPDH. (e) LX‐2 cells in dishes were fixed in 4% paraformaldehyde, stained with DAPI (blue) and Notch3 and HES1 (green), and imaged by confocal microscopy, Scale bar: 200 μm (up panel) and 100 μm (down panel). The values are expressed as the mean ± SD of five independent assays, # P < .05, significantly different from the control group, * P < .05, significantly different from the TGFβ1 treatment group in LX‐2 cells; ANOVA followed by Tukey's test
Figure 5.
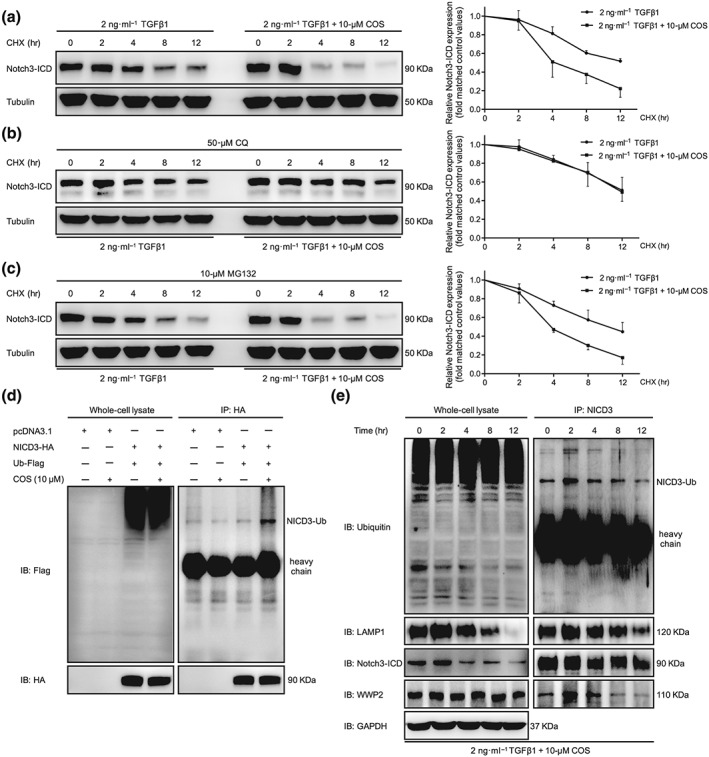
Costunolide (COS) enhanced the lysosomal degradation of NICD3 in LX‐2 cells. (a) After starvation, LX‐2 cells were treated with CHX (20 mmol·L−1) and 2 ng·ml−1 TGFβ1 with or without different concentrations of COS for the indicated times. The results showed that COS inhibited the degradation of NICD3 in LX‐2 cells. (b) CQ inhibition of the lysosome blocked the degradation of NICD3 caused by COS treatment. LX‐2 cells were pretreated with CQ (100 mM) for 12 hr and then received the indicated treatments for the different times. (c) MD132 inhibition of the proteasome did not affect the NICD3 degradation. Cells were pretreated with MG132 (10 mM) for 2 hr and then received the indicated treatments for the different times. Tubulin served as a loading control. (d) NICD3‐HA was co‐transfected with Ub‐Flag into HEK293T cells. Whole cell extracts were immunoprecipitated with anti‐HA and blotted with an anti‐Flag antibody. (e) NICD3 monoubiquitination detection and the interaction among WWP2, NICD3 and LAMP1 was investigated using immunoprecipitation assays of LX‐2 cells for the indicated times. The values are expressed as the mean ± SD of five independent assays
3.5. COS promoted the ubiquitin‐dependent lysosomal degradation of NICD3
Most cytosolic proteins are degraded by either the ubiquitin‐dependent pathway or the lysosomal‐dependent pathway. After treatment with the lysosome inhibitor chloroquine (CQ), COS‐induced degradation of NICD3 was significantly attenuated in LX‐2 cells (Figure 5b). Consistent with previous studies, inhibiting the proteasomal pathway with https://www.guidetopharmacology.org/GRAC/LigandDisplayForward?ligandId=8616 did not alter the degradation of NICD3 (Figure 5c; Jia, Yu, Zhang, & Wang, 2009). The principle mechanism of NICD3 clearance has been reported to require monoubiquitin‐dependent lysosomal degradation rather than the classical autophagy–lysosomal pathway (Jung et al., 2014). A prominent band representing the monoubiquitinated NICD3 protein was observed in lysates from HEK293T cells transfected with NICD3‐HA and Ubiquitin‐Flag plasmids and subsequently treated with COS (Figure 5d). In LX‐2 cells, NICD3 monoubiquitination and conjugation with NICD3 and LAMP1 (a lysosomal marker) began to increase in the second hour and decreased in the fourth hour following COS intervention (Figure 5e). Confocal microscopy assay was used to determine the subcellular colocalization of LAMP1 with NICD3 to confirm these results in situ. Similar results were obtained (Figure 6), preliminarily illustrating that COS administration enhances NICD3 degradation via a monoubiquitin‐dependent lysosomal mechanism within a short period of exposure.
Figure 6.
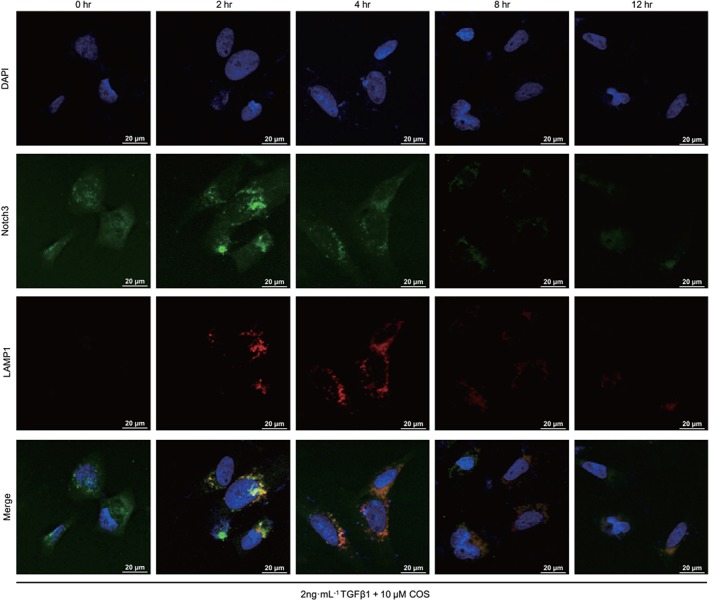
Costunolide (COS) promoted NICD3 lysosomal degradation by subcellular colocalization. Conjugation of NICD3 with lysosomes was analysed by immunofluorescence
3.6. Genetic alteration of the Notch3–HES1 pathway influenced the antifibrogenic activity of COS in LX‐2 cells
The levels of Notch3 and HES1 were manipulated in LX‐2 cells to further determine whether the antifibrogenic effect of COS was mediated by the Notch3–HES1 pathway. After TGFβ1 stimulation, NICD3‐overexpressing LX‐2 cells displayed higher expression of fibrogenic markers and lower antifibrotic activity of COS than vector‐transfected cells (Figure 7a). On the contrary, these changes in the aforementioned proteins were reversed in Notch3‐silenced LX‐2 cells (Figure 7b). HES1, a downstream target gene of Notch3, is the functional executor of this pathway. Alterations in HES expression produced results similar to those shown in Figure 7 (Figure 8). Taken together, COS promotes Notch3 degradation and down‐regulates the Notch3–HES1 pathway, exerting potent antifibrotic effects based on this mechanism.
Figure 7.
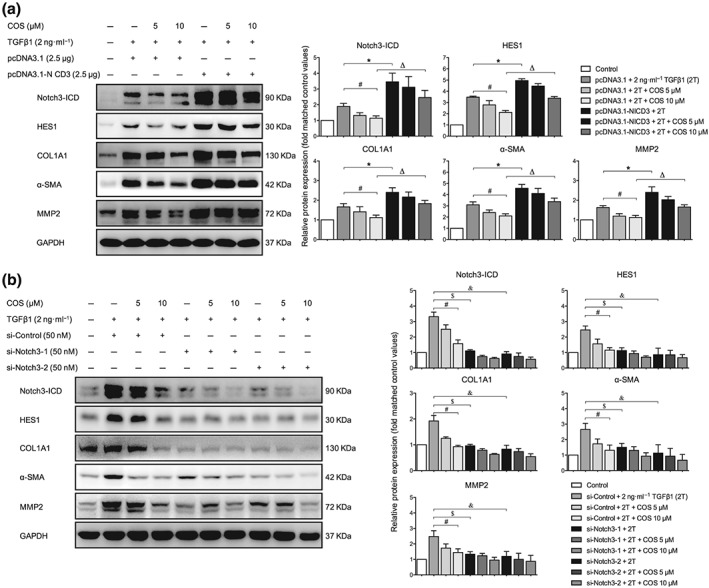
Altering Notch3 expression influenced the antifibrotic activity of costunolide (COS). LX‐2 cells were transfected with (a) 2.5‐μg pcDNA3.1‐NICD3 or vector for 6 hr and subsequently treated with 2 ng·ml−1 TGFβ1 with or without different concentrations of COS for 24 hr after no FBS starvation. The protein expressions of NICD3, HES1 and liver fibrosis markers were determined by immunoblotting with the indicated antibodies. LX‐2 cells were transfected with (b) 50‐nM si‐Notch3‐1/2 or si‐Control and subsequently treated with 2 ng·ml−1 TGFβ1 with or without different concentrations of COS for 24 hr after no FBS starvation. The same protein expressions were detected by western blot with the indicated antibodies. GAPDH was used as a loading control for all western blot assays. The data are expressed as the mean ± SD of five independent assays, # P < .05, significantly different from the pcDNA3.1/si‐Control + COS 10‐μM group, * P < .05, significantly different from the pcDNA3.1‐NICD3 + 2T group. Δ P < .05, significantly different from the pcDNA3.1‐NICD3 + COS 10‐μM group; $ P < .05, significantly different from the si‐Notch3‐1 + 2T group. & P < .05, significantly different from the si‐Notch3‐2 + COS 10‐μM group. ANOVA followed by Tukey's test
Figure 8.
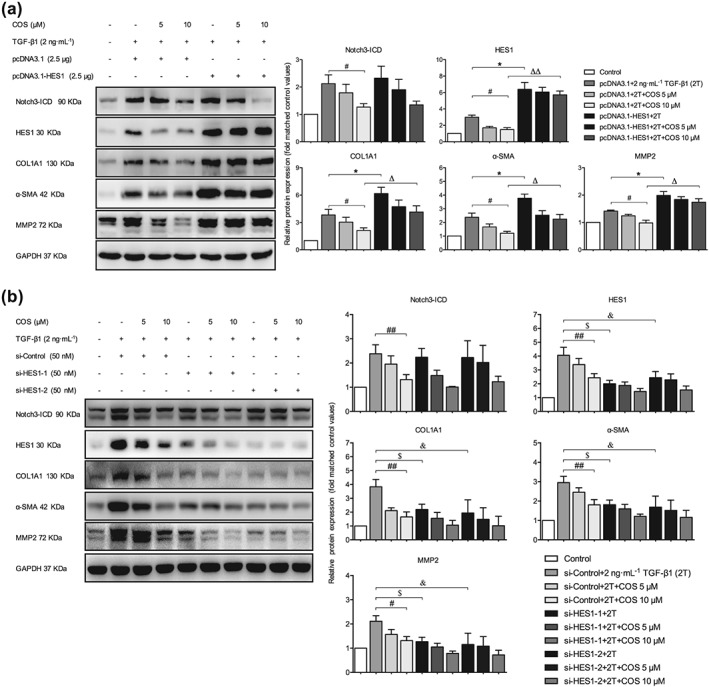
Altering HES1 expression influenced the antifibrotic activity of costunolide (COS). LX‐2 cells were transfected with (a) 2.5‐μg pcDNA3.1‐HES1 or vector. The protein expressions of Notch3‐ICD, HES1, and liver fibrosis markers were determined by immunoblotting with the indicated antibodies. LX‐2 cells were transfected with (b) 50‐nM si‐HES1‐1/2 or si‐Control. The same protein expressions were detected by western blot with the indicated antibodies. GAPDH was used as a loading control for all western blot assays. The data are expressed as the mean ± SD of five independent assays, # P < .05, significantly different from the pcDNA3.1/si‐Control + COS 10‐μM group; * P < .05, significantly different from the pcDNA3.1‐HES1 + 2T group and si‐Control + COS 10‐μM group; Δ P < .05, significantly different from the pcDNA3.1‐HES1 + COS 10‐μM group. $ P < .05, significantly different from the si‐HES1‐1 + 2T group; & P < .05, significantly different from the si‐HES1‐2 + COS 10‐μM group. ANOVA followed by Tukey's test
3.7. COS disrupted the interaction between WWP2 and PPM1G and regulated Notch3 stability
WWP2, an E3 ubiquitin‐protein ligase, has been demonstrated to promote NICD3 lysosomal degradation in ovarian cancer (Jung et al., 2014). PPM1G has also been identified as a negative regulator of WWP2 (Chaudhary & Maddika, 2014). In the present study, the interaction between WWP2 and NICD3 was consistently correlated with monoubiquitinated NICD3 levels and the binding of NICD3 to LAMP1 (Figure 5e). In addition, significant changes in the levels of either WWP2 or PPM1G were not observed, but their interaction was significantly disrupted by the COS treatment in LX‐2 cells, indicating that COS blocked the repressive effect of PPM1G on WWP2 (Figures 9a and S3A). The inhibition of PPM1G activity by CdCl2 also decreased the protein levels of fibrogenic markers but did not affect the PPM1G and WWP2 levels in either LX‐2 cells or mouse pHSCs (Pan et al., 2013). The combination of COS and CdCl2 exerted more potent antifibrotic effects on these cells than COS alone (Figures 9b,c and S3B,C). Furthermore, WWP2 overexpression induced by the transfection of pCAGGS‐WWP2 plasmids counteracted the Notch3‐related fibrogenic phenotypes and enhanced the activity of COS, while WWP2 silencing using RNA interference technology exerted opposite effects (Figures 9d,e and S4A,B). Thus, COS may down‐regulate the Notch3–HES1 pathway by blocking the interaction between WWP2 and PPM1G and subsequently suppress the progression of hepatic fibrosis.
Figure 9.
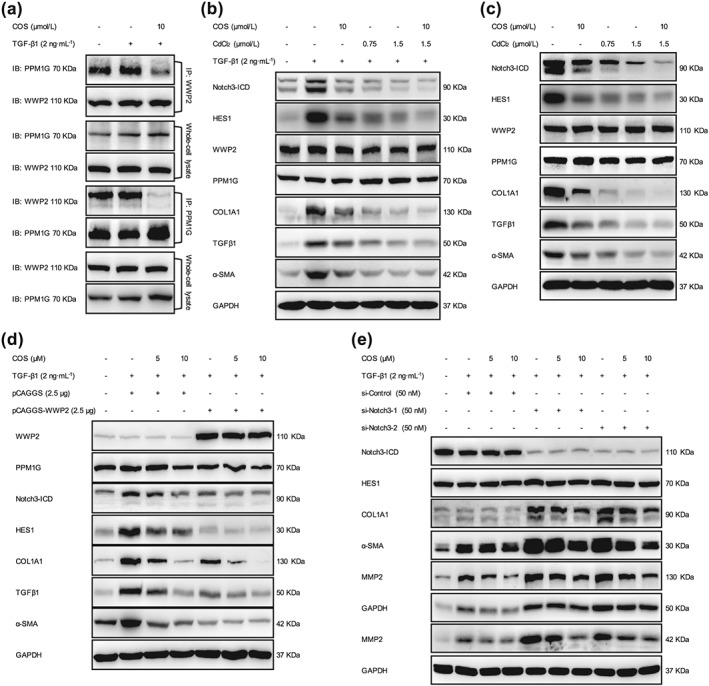
WWP2 was of significance to the antifibrotic effects of costunolide (COS). (a) The interaction between PPM1G and WWP2 was investigated using immunoprecipitation assays of LX‐2 cells. (b) LX‐2 cells and (c) mouse pHSCs were treated with COS (10 μM) and/or CdCl2 (0.75 or 1.5 μM) then the protein expressions of NICD3, HES1 and fibrogenic markers were detected by immunoblotting with the indicated antibodies. LX‐2 cells were transfected with (d) 2.5‐μg pCAGGS‐WWP2 or vector plasmids and (e) 50‐nM si‐WWP2‐1/2 or si‐Control. The same protein expressions were detected by western blot. GAPDH was used as a loading control for all western blot assays
4. DISCUSSION
As the major etiological factor in the development of liver fibrosis, persistent activation of HSCs contributes to the imbalance between fibrogenesis and fibrinolysis that leads to excessive extracellular matrix accumulation (Hernandez‐Gea & Friedman, 2011). The importance of preventing HSC activation during liver fibrosis treatment is undisputed. In the present study, we elucidated the potent effects of COS on liver fibrosis in two classic animal models, HSCs and explored the underlying mechanisms of action of COS in this respect. The effects of COS administration were verified on the basis of the following observations:‐ (a) Rats subjected to BDL and CCl4‐challenged mice treated with COS exhibited histological amelioration of the liver damage and fibrosis caused by these treatments, (b) The mRNA and protein levels of liver fibrogenic markers were down‐regulated by COS administration in vitro and in vivo, (c) COS promoted Notch3 degradation through an ubiquitin‐dependent lysosomal mechanism and subsequently inhibited HES1 expression, (d) A consistent correlation was observed between alterations in the Notch3–HES1 pathway and liver fibrogenic marker expression and (e) COS disturbed the PPM1G/WWP2 complex and blocked the inhibitory effect of PPM1G on WWP2, which destabilized Notch3 and exerted a therapeutic effect on hepatic fibrosis (Figure 10).
Figure 10.
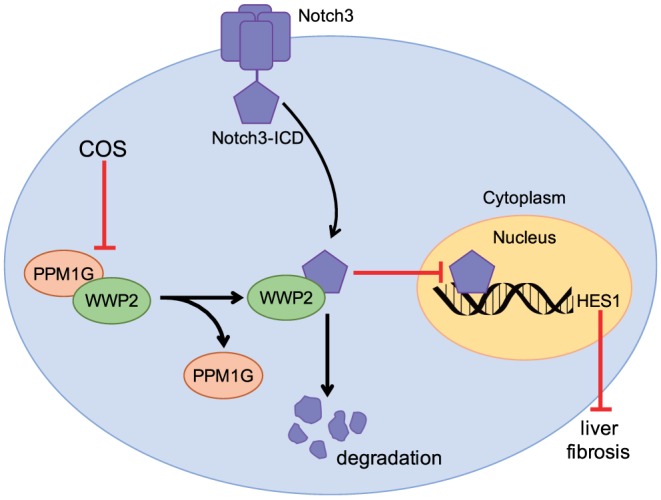
Costunolide (COS) disrupted the interaction between WWP2 and PPM1G, which enhanced the effect of WWP2 on Notch3 degradation. The increase of Notch3 degradation further inhibited Notch3/HES1 pathway exerting repressive effect on liver fibrosis
Evidence for the indispensable role of Notch3 in liver pathophysiology is accumulating. In fibrotic liver tissues and experimental animal models the level of Notch3 is markedly increased during liver fibrogenesis and decreased during the resolution of fibrosis (Chen, Weng, & Zhang, 2012). Elevated expression of Notch3 and the nuclear localization of NICD3 have been detected in HSC‐T6 cells after TGFβ1 treatment. Notch3 silencing antagonizes the TGFβ1‐induced up‐regulation of the expression of myofibroblastic markers (α‐SMA and collagen I), while overexpressing Notch3 produced adverse consequences (Chen, Zhang et al., 2012), which was in accordance with our findings (Figure 7). Previous investigations have suggested that Notch3 is more likely to be monoubiquitinated rather than polyubiquitinated (Beres et al., 2011). Since proteasomal degradation is generally initiated by the presence of polyubiquitin, implicating that this post‐translational modification did not drive NICD3 degradation within the proteasome. Certain membrane receptors are recognized and degraded by lysosomes via monoubiquitination, which functions as an endocytosis signal (Shih, Sloper‐Mould, & Hicke, 2000). Lysosomal degradation has recently been shown to account for NICD3 clearance and the attenuation of NICD3 target gene activation (Jia et al., 2009). As an important component of the Notch signaling pathway, HES1, which belongs to the highly conserved basic helix‐loop‐helix family of transcription factors and exerts its biological function by binding to N‐boxes (CACNAG), is required for cell proliferation (Rani, Greenlaw, Smith, & Galustian, 2016), differentiation (Dhanesh, Subashini, & James, 2016) and liver fibrogenesis (Zhang, Zhang et al., 2015). In the present study, COS down‐regulated the Notch3–HES1 pathway and the decrease in HES1 expression correlated with the increase in NICD3 monoubiquitination levels and lysosomal degradation.
Among the four mammalian Notch receptors only Notch3 contains the PPxY motif, which is critical for interacting with NEDD4, an E3 ubiquitin ligase, through its C‐terminal region (Bernassola, Karin, Ciechanover, & Melino, 2008). WWP2, a NEDD4‐like E3 ubiquitin ligase, serves as a negative regulator of Notch3, which directly binds to and monoubiquitinates NICD3 to target NICD3 to lysosomes for degradation (Jung et al., 2014). In LX‐2 cells, WWP2 has been shown to strongly promote the monoubiquitination of NICD3, triggering the sorting of NICD3 to lysosomes and its subsequent degradation, thereby suppressing Notch3 signaling activity. PPM1G, which is also known as PP2Cγ, is a Mg2+/Mn2+‐dependent nuclear serine/threonine phosphatase that has important roles in regulating cell survival (Foster, Langenbacher, Gao, Chen, & Wang, 2013), DNA damage responses (Khoronenkova et al., 2012) and tumourigenesis (Chaudhary & Maddika, 2014). The E3 ligase activity of WWP2 is suppressed in the presence of PPM1G, leading to the increased degradation of WWP2 substrates. Since the effect of PPM1G relies on its catalytic activity, the inhibition of PPM1G activity with CdCl2 enhances the autoubiquitination of WWP2 (Chaudhary & Maddika, 2014). Our results confirmed this PPM1G–WWP2–NICD3 regulatory mechanism. COS disrupted the interaction between WWP2 and PPM1G and promoted NICD3 degradation. Further, CdCl2 enhanced the antifibrotic activity of COS. However, the regulatory effects of WWP2 and PPM1G on liver fibrosis have not been described. Our investigation is first to reveal that both of these molecules participated in the development of liver fibrosis by regulating the Notch3–HES1 pathway.
In summary, COS, a monomeric component of traditional Chinese medicine, ameliorates liver damage and fibrosis in rats subjected to BDL and CCl4‐treated mice. We evaluated the antifibrotic effects of COS on both HSCs and liver tissues and revealed that the underlying mechanism of COS involves WWP2‐mediated Notch3 degradation via the ubiquitin‐dependent lysosomal pathway and a subsequent restriction of Notch3–HES1 pathway. This study is first to show that PPM1G and WWP2 play fundamental roles in liver fibrosis by regulating the Notch3–HES1 pathway. Based on these findings, costunolide (COS) exerts therapeutic effects on liver fibrosis in vitro and in vivo and may be a novel candidate for hepatic fibrosis treatment in the near future.
AUTHOR CONTRIBUTIONS
Mao‐xu Ge, Hong‐wei He, and Rong‐guang Shao designed the research project; Mao‐xu Ge, Dong‐ke Yu, Wei‐xiao Niu, Na Zhang, Hong‐tao Liu, and Rui Huang performed the experiment; Zhen‐ning Lu, Yun‐yang Bao, Dong‐ke Yu, and Hong‐tao Liu analyzed the data; Hong‐wei He and Rong‐guang Shao contributed the reagents and materials; Mao‐xu Ge and Hong‐wei He wrote the manuscript.
CONFLICT OF INTEREST
The authors declare they have no conflict of interest.
DECLARATION OF TRANSPARENCY AND SCIENTIFIC RIGOUR
This Declaration acknowledges that this paper adheres to the principles for transparent reporting and scientific rigour of preclinical research as stated in the BJP guidelines for https://bpspubs.onlinelibrary.wiley.com/doi/abs/10.1111/bph.14207, https://bpspubs.onlinelibrary.wiley.com/doi/abs/10.1111/bph.14208, and https://bpspubs.onlinelibrary.wiley.com/doi/abs/10.1111/bph.14206, and as recommended by funding agencies, publishers and other organisations engaged with supporting research.
Supporting information
Table S1.
Serum biochemical parameters of CCl4‐treated mice
Figure S1.Blinded quantitative assessment of hepatic inflammation in BDL‐challenged rats and CCl4‐challenged mice. The values are expressed as the mean ± SD (n = 8 of each group), #P < 0.05; significantly different from sham/control group, *P < 0.05; significantly different from BDL‐NS/CCl4‐corn oil group; ANOVA followed by Tukey's test.
Figure S2. (A) Western blot analysis of Notch1 and Notch2 expressions in LX‐2 cells. (B) COS intervention inhibited the protein expressions of Notch3 and HES1 in CCl4 mice livers. (C) COS time‐dependently repressed Notch3 and HES1 protein expressions in LX‐2 cells. (D) and (E) The protein expressions of Notch3 and HES1 were significantly down‐regulated in a dose‐ and time‐ dependent manner in mouse pHSCs. GAPDH served as a loading control. The values are expressed as the mean ± SD of five independent assays, #P < 0.05; significantly different from the control group (B and C), *P < 0.05; significantly different from the CCl4‐corn oil group (B) and TGFβ1 treatment group in LX‐2 cells (C) and the control group in mouse pHSCs (D and E); ANOVA followed by Tukey's test.
Figure S3. (A) Western blot analysis of PPM1G and WWP2 expressions in LX‐2 cells. (B) LX‐2 cells were treated with 2 ng·mL‐1 TGF‐β1 with or without 10 μM COS and/or CdCl2 (0.75 or 1.5 μM) for 24 h after no FBS starvation. The protein expressions of WWP2, PPM1G, NICD3, HES1, and liver fibrosis markers were determined by immunoblotting with the indicated antibodies.
(C) mouse pHSCs were treated with 10 μM COS and/or CdCl2 (0.75 or 1.5 μM). The same protein expressions were detected by western blot with the indicated antibodies. GAPDH was used as a loading control for all western blot assays. The data are expressed as the mean ± SD of five independent assays. #P < 0.05; significantly different from the 2 T + COS 10 μM group; *P < 0.05; significantly different from the 2 T + CdCl2 1.5 μM group; &P < 0.05; significantly different from the 2 T + COS 10 μM + CdCl2 1.5 μM group in LX‐2 cells. #P < 0.05; significantly different from the COS 10 μM group; *P < 0.05; significantly different from the CdCl2 1.5 μM group; &P < 0.05; significantly different from the COS 10 μM + CdCl2 1.5 μM group in mouse pHSCs. ANOVA followed by Tukey's test.
Figure S4. (A) LX‐2 cells were transfected with 2.5 μg pCAGGS‐WWP2 or vector and subsequently treated with 2 ng·mL‐1 TGF‐β1 with or without COS (5 or 10 μM) for 24 h after no FBS starvation. The protein expressions of WWP2, PPM1G, NICD3, HES1, and liver fibrosis markers were determined by immunoblotting with the indicated antibodies. (B) LX‐2 cells were transfected with 50 nM si‐WWP2‐1/2 or si‐Control and subsequently treated with 2 ng·mL‐1 TGF‐β1 with or without COS (5 or 10 μM) for 24 h after no FBS starvation. The same protein expressions were detected by western blot with the indicated antibodies. GAPDH was used as a loading control for all western blot assays. The data are expressed as the mean ± SD of five independent assays. #P < 0.05; significantly different from the pcDNA3.1/si‐control + COS 10 μM group; *P < 0.05; significantly different from the pCAGGS‐WWP2/si‐WWP2‐1 + 2 T group; &P < 0.05; significantly different from the si‐WWP2‐2 + 2 T group; ΔP < 0.05; significantly different from the pCAGGS‐WWP2 + 2 T + COS 10 μM group. ANOVA followed by Tukey's test.
ACKNOWLEDGEMENTS
The project was supported by grants from the Peking Union Medical College Graduate Student Innovation Fund (Grant 2018‐1007‐15), the National Natural Science Foundation of China (Grants 81673497, 81621064 and 81903695) and CAMS Innovation Fund for Medical Sciences (CIFMS; Grant 2017‐I2M‐3‐012).
Ge M, Liu H, Zhang N, et al. Costunolide represses hepatic fibrosis through WW domain‐containing protein 2‐mediated Notch3 degradation. Br J Pharmacol. 2020;177:372–387. 10.1111/bph.14873
Contributor Information
Dong‐ke Yu, Email: kkygrace2411@yahoo.com.
Rong‐guang Shao, Email: shaor@imb.pumc.edu.cn.
Hong‐wei He, Email: hehwei@imb.pumc.edu.cn.
REFERENCES
- Alexander, S. P. , Fabbro, D. , Kelly, E. , Marrion, N. V. , Peters, J. A. , Faccenda, E. , … Davies, J. A. (2017). The concise guide to PHARMACOLOGY 2017/18: Enzymes. British Journal of Pharmacology, 174(Suppl 1), S272–s359. 10.1111/bph.13877 [DOI] [PMC free article] [PubMed] [Google Scholar]
- Alexander, S. P. , Kelly, E. , Marrion, N. V. , Peters, J. A. , Faccenda, E. , Harding, S. D. , … Davies, J. A. (2017). The concise guide to PHARMACOLOGY 2017/18: Overview. British Journal of Pharmacology, 174(Suppl 1), S1–s16. 10.1111/bph.13882 [DOI] [PMC free article] [PubMed] [Google Scholar]
- Alexander, S. P. H. , Roberts, R. E. , Broughton, B. R. S. , Sobey, C. G. , George, C. H. , Stanford, S. C. , … Ahluwalia, A. (2018). Goals and practicalities of immunoblotting and immunohistochemistry: A guide for submission to the British Journal of Pharmacology. British Journal of Pharmacology, 175, 407–411. 10.1111/bph.14112 [DOI] [PMC free article] [PubMed] [Google Scholar]
- Andersson, E. R. , Sandberg, R. , & Lendahl, U. (2011). Notch signaling: Simplicity in design, versatility in function. Development (Cambridge, England), 138, 3593–3612. 10.1242/dev.063610 [DOI] [PubMed] [Google Scholar]
- Beres, B. J. , George, R. , Lougher, E. J. , Barton, M. , Verrelli, B. C. , McGlade, C. J. , … Wilson‐Rawls, J. (2011). Numb regulates Notch1, but not Notch3, during myogenesis. Mechanisms of Development, 128, 247–257. 10.1016/j.mod.2011.02.002 [DOI] [PubMed] [Google Scholar]
- Bernassola, F. , Karin, M. , Ciechanover, A. , & Melino, G. (2008). The HECT family of E3 ubiquitin ligases: Multiple players in cancer development. Cancer Cell, 14, 10–21. 10.1016/j.ccr.2008.06.001 [DOI] [PubMed] [Google Scholar]
- Chaudhary, N. , & Maddika, S. (2014). WWP2‐WWP1 ubiquitin ligase complex coordinated by PPM1G maintains the balance between cellular p73 and DeltaNp73 levels. Molecular and Cellular Biology, 34, 3754–3764. 10.1128/mcb.00101-14 [DOI] [PMC free article] [PubMed] [Google Scholar]
- Chen, Y. , Zheng, S. , Qi, D. , Zheng, S. , Guo, J. , Zhang, S. , & Weng, Z. (2012). Inhibition of Notch signaling by a γ‐secretase inhibitor attenuates hepatic fibrosis in rats. PLoS ONE, 7, e46512 10.1371/journal.pone.0046512 [DOI] [PMC free article] [PubMed] [Google Scholar]
- Chen, Y. X. , Weng, Z. H. , & Zhang, S. L. (2012). Notch3 regulates the activation of hepatic stellate cells. World Journal of Gastroenterology, 18, 1397–1403. 10.3748/wjg.v18.i12.1397 [DOI] [PMC free article] [PubMed] [Google Scholar]
- Curtis, M. J. , Alexander, S. , Cirino, G. , Docherty, J. R. , George, C. H. , Giembycz, M. A. , … Ahluwalia, A. (2018). Experimental design and analysis and their reporting II: Updated and simplified guidance for authors and peer reviewers. British Journal of Pharmacology, 175, 987–993. 10.1111/bph.14153 [DOI] [PMC free article] [PubMed] [Google Scholar]
- De Minicis, S. , Seki, E. , Uchinami, H. , Kluwe, J. , Zhang, Y. , Brenner, D. A. , & Schwabe, R. F. (2007). Gene expression profiles during hepatic stellate cell activation in culture and in vivo. Gastroenterology, 132, 1937–1946. 10.1053/j.gastro.2007.02.033 [DOI] [PubMed] [Google Scholar]
- Dhanesh, S. B. , Subashini, C. , & James, J. (2016). Hes1: The maestro in neurogenesis. Cellular and Molecular Life Sciences: CMLS, 73, 4019–4042. 10.1007/s00018-016-2277-z [DOI] [PMC free article] [PubMed] [Google Scholar]
- Dong, G. Z. , Shim, A. R. , Hyeon, J. S. , Lee, H. J. , & Ryu, J. H. (2015). Inhibition of Wnt/β‐catenin pathway by dehydrocostus lactone and costunolide in colon cancer cells. Phytotherapy Research: PTR, 29, 680–686. 10.1002/ptr.5299 [DOI] [PubMed] [Google Scholar]
- Duan, J. L. , Ruan, B. , Yan, X. C. , Liang, L. , Song, P. , Yang, Z. Y. , … Wang, L. (2018). Endothelial Notch activation reshapes the angiocrine of sinusoidal endothelia to aggravate liver fibrosis and blunt regeneration in mice. Hepatology (Baltimore, md), 68, 677–690. 10.1002/hep.29834 [DOI] [PMC free article] [PubMed] [Google Scholar]
- Fabris, L. , Cadamuro, M. , Guido, M. , Spirli, C. , Fiorotto, R. , Colledan, M. , … Strazzabosco, M. (2007). Analysis of liver repair mechanisms in Alagille syndrome and biliary atresia reveals a role for notch signaling. The American Journal of Pathology, 171, 641–653. 10.2353/ajpath.2007.070073 [DOI] [PMC free article] [PubMed] [Google Scholar]
- Fan, X. , Yao, Y. , & Zhang, Y. (2018). Calreticulin promotes proliferation and extracellular matrix expression through Notch pathway in cardiac fibroblasts. Advances in Clinical and Experimental Medicine: Official Organ Wroclaw Medical University, 27, 887–892. 10.17219/acem/74430 [DOI] [PubMed] [Google Scholar]
- Fiuza, U. M. , & Arias, A. M. (2007). Cell and molecular biology of Notch. The Journal of Endocrinology, 194, 459–474. 10.1677/joe-07-0242 [DOI] [PubMed] [Google Scholar]
- Foster, W. H. , Langenbacher, A. , Gao, C. , Chen, J. , & Wang, Y. (2013). Nuclear phosphatase PPM1G in cellular survival and neural development. Developmental Dynamics: An Official Publication of the American Association of the Anatomists, 242, 1101–1109. 10.1002/dvdy.23990 [DOI] [PMC free article] [PubMed] [Google Scholar]
- Ge, M. , Liu, H. , Zhang, Y. , Li, N. , Zhao, S. , Zhao, W. , … Shao, R. G. (2017). The anti‐hepatic fibrosis effects of dihydrotanshinone I are mediated by disrupting the yes‐associated protein and transcriptional enhancer factor D2 complex and stimulating autophagy. British Journal of Pharmacology, 174, 1147–1160. 10.1111/bph.13766 [DOI] [PMC free article] [PubMed] [Google Scholar]
- Harding, S. D. , Sharman, J. L. , Faccenda, E. , Southan, C. , Pawson, A. J. , Ireland, S. , … Davies, J. A. (2018). The IUPHAR/BPS guide to PHARMACOLOGY in 2018: Updates and expansion to encompass the new guide to IMMUNOPHARMACOLOGY. Nucleic Acids Research, 46, D1091–d1106. 10.1093/nar/gkx1121 [DOI] [PMC free article] [PubMed] [Google Scholar]
- Hernandez‐Gea, V. , & Friedman, S. L. (2011). Pathogenesis of liver fibrosis. Annual Review of Pathology, 6, 425–456. 10.1146/annurev-pathol-011110-130246 [DOI] [PubMed] [Google Scholar]
- Jia, L. , Yu, G. , Zhang, Y. , & Wang, M. M. (2009). Lysosome‐dependent degradation of Notch3. The International Journal of Biochemistry & Cell Biology, 41, 2594–2598. 10.1016/j.biocel.2009.08.019 [DOI] [PMC free article] [PubMed] [Google Scholar]
- Jiang, Y. , Wang, Y. , Ma, P. , An, D. , Zhao, J. , Liang, S. , … Qin, H. (2018). Myeloid‐specific targeting of Notch ameliorates murine renal fibrosis via reduced infiltration and activation of bone marrow‐derived macrophage. Protein & Cell, 10, 196–210. 10.1007/s13238-018-0527-6 [DOI] [PMC free article] [PubMed] [Google Scholar]
- Jung, J. G. , Stoeck, A. , Guan, B. , Wu, R. C. , Zhu, H. , Blackshaw, S. , … Wang, T. L. (2014). Notch3 interactome analysis identified WWP2 as a negative regulator of Notch3 signaling in ovarian cancer. PLoS Genetics, 10, e1004751 10.1371/journal.pgen.1004751 [DOI] [PMC free article] [PubMed] [Google Scholar]
- Kamath, B. M. , Bauer, R. C. , Loomes, K. M. , Chao, G. , Gerfen, J. , Hutchinson, A. , … Spinner, N. B. (2012). NOTCH2 mutations in Alagille syndrome. Journal of Medical Genetics, 49, 138–144. 10.1136/jmedgenet-2011-100544 [DOI] [PMC free article] [PubMed] [Google Scholar]
- Khoronenkova, S. V. , Dianova, I. I. , Ternette, N. , Kessler, B. M. , Parsons, J. L. , & Dianov, G. L. (2012). ATM‐dependent downregulation of USP7/HAUSP by PPM1G activates p53 response to DNA damage. Molecular Cell, 45, 801–813. 10.1016/j.molcel.2012.01.021 [DOI] [PMC free article] [PubMed] [Google Scholar]
- Kilkenny, C. , Browne, W. , Cuthill, I. C. , Emerson, M. , & Altman, D. G. (2010). Animal research: Reporting in vivo experiments: The ARRIVE guidelines. British Journal of Pharmacology, 160, 1577–1579. [DOI] [PMC free article] [PubMed] [Google Scholar]
- Kopan, R. , & Ilagan, M. X. (2009). The canonical Notch signaling pathway: Unfolding the activation mechanism. Cell, 137, 216–233. 10.1016/j.cell.2009.03.045 [DOI] [PMC free article] [PubMed] [Google Scholar]
- Lee, Y. A. , Wallace, M. C. , & Friedman, S. L. (2015). Pathobiology of liver fibrosis: A translational success story. Gut, 64, 830–841. 10.1136/gutjnl-2014-306842 [DOI] [PMC free article] [PubMed] [Google Scholar]
- McGrath, J. C. , & Lilley, E. (2015). Implementing guidelines on reporting research using animals (ARRIVE etc.): New requirements for publication in BJP. British Journal of Pharmacology, 172, 3189–3193. 10.1111/bph.12955 [DOI] [PMC free article] [PubMed] [Google Scholar]
- Mederacke, I. , Dapito, D. H. , Affo, S. , Uchinami, H. , & Schwabe, R. F. (2015). High‐yield and high‐purity isolation of hepatic stellate cells from normal and fibrotic mouse livers. Nature Protocols, 10, 305–315. 10.1038/nprot.2015.017 [DOI] [PMC free article] [PubMed] [Google Scholar]
- Pan, C. , Liu, H. D. , Gong, Z. , Yu, X. , Hou, X. B. , Xie, D. D. , … Sun, J. P. (2013). Cadmium is a potent inhibitor of PPM phosphatases and targets the M1 binding site. Scientific Reports, 3, 2333 10.1038/srep02333 [DOI] [PMC free article] [PubMed] [Google Scholar]
- Park, E. , Song, J. H. , Kim, M. S. , Park, S. H. , & Kim, T. S. (2016). Costunolide, a sesquiterpene lactone, inhibits the differentiation of pro‐inflammatory CD4(+) T cells through the modulation of mitogen‐activated protein kinases. International Immunopharmacology, 40, 508–516. 10.1016/j.intimp.2016.10.006 [DOI] [PubMed] [Google Scholar]
- Rani, A. , Greenlaw, R. , Smith, R. A. , & Galustian, C. (2016). HES1 in immunity and cancer. Cytokine & Growth Factor Reviews, 30, 113–117. 10.1016/j.cytogfr.2016.03.010 [DOI] [PubMed] [Google Scholar]
- Reister, S. , Kordes, C. , Sawitza, I. , & Haussinger, D. (2011). The epigenetic regulation of stem cell factors in hepatic stellate cells. Stem Cells and Development, 20, 1687–1699. 10.1089/scd.2010.0418 [DOI] [PubMed] [Google Scholar]
- Shih, S. C. , Sloper‐Mould, K. E. , & Hicke, L. (2000). Monoubiquitin carries a novel internalization signal that is appended to activated receptors. The EMBO Journal, 19, 187–198. 10.1093/emboj/19.2.187 [DOI] [PMC free article] [PubMed] [Google Scholar]
- Sun, M. , & Kisseleva, T. (2015). Reversibility of liver fibrosis. Clinics and Research in Hepatology and Gastroenterology, 39(Suppl 1), S60–S63. 10.1016/j.clinre.2015.06.015 [DOI] [PMC free article] [PubMed] [Google Scholar]
- Zhang, K. , Zhang, Y. Q. , Ai, W. B. , Hu, Q. T. , Zhang, Q. J. , Wan, L. Y. , … Wu, J. F. (2015). Hes1, an important gene for activation of hepatic stellate cells, is regulated by Notch1 and TGF‐β/BMP signaling. World Journal of Gastroenterology, 21, 878–887. 10.3748/wjg.v21.i3.878 [DOI] [PMC free article] [PubMed] [Google Scholar]
- Zhang, Q. D. , Xu, M. Y. , Cai, X. B. , Qu, Y. , Li, Z. H. , & Lu, L. G. (2015). Myofibroblastic transformation of rat hepatic stellate cells: The role of Notch signaling and epithelial‐mesenchymal transition regulation. European Review for Medical and Pharmacological Sciences, 19, 4130–4138. [PubMed] [Google Scholar]
Associated Data
This section collects any data citations, data availability statements, or supplementary materials included in this article.
Supplementary Materials
Table S1.
Serum biochemical parameters of CCl4‐treated mice
Figure S1.Blinded quantitative assessment of hepatic inflammation in BDL‐challenged rats and CCl4‐challenged mice. The values are expressed as the mean ± SD (n = 8 of each group), #P < 0.05; significantly different from sham/control group, *P < 0.05; significantly different from BDL‐NS/CCl4‐corn oil group; ANOVA followed by Tukey's test.
Figure S2. (A) Western blot analysis of Notch1 and Notch2 expressions in LX‐2 cells. (B) COS intervention inhibited the protein expressions of Notch3 and HES1 in CCl4 mice livers. (C) COS time‐dependently repressed Notch3 and HES1 protein expressions in LX‐2 cells. (D) and (E) The protein expressions of Notch3 and HES1 were significantly down‐regulated in a dose‐ and time‐ dependent manner in mouse pHSCs. GAPDH served as a loading control. The values are expressed as the mean ± SD of five independent assays, #P < 0.05; significantly different from the control group (B and C), *P < 0.05; significantly different from the CCl4‐corn oil group (B) and TGFβ1 treatment group in LX‐2 cells (C) and the control group in mouse pHSCs (D and E); ANOVA followed by Tukey's test.
Figure S3. (A) Western blot analysis of PPM1G and WWP2 expressions in LX‐2 cells. (B) LX‐2 cells were treated with 2 ng·mL‐1 TGF‐β1 with or without 10 μM COS and/or CdCl2 (0.75 or 1.5 μM) for 24 h after no FBS starvation. The protein expressions of WWP2, PPM1G, NICD3, HES1, and liver fibrosis markers were determined by immunoblotting with the indicated antibodies.
(C) mouse pHSCs were treated with 10 μM COS and/or CdCl2 (0.75 or 1.5 μM). The same protein expressions were detected by western blot with the indicated antibodies. GAPDH was used as a loading control for all western blot assays. The data are expressed as the mean ± SD of five independent assays. #P < 0.05; significantly different from the 2 T + COS 10 μM group; *P < 0.05; significantly different from the 2 T + CdCl2 1.5 μM group; &P < 0.05; significantly different from the 2 T + COS 10 μM + CdCl2 1.5 μM group in LX‐2 cells. #P < 0.05; significantly different from the COS 10 μM group; *P < 0.05; significantly different from the CdCl2 1.5 μM group; &P < 0.05; significantly different from the COS 10 μM + CdCl2 1.5 μM group in mouse pHSCs. ANOVA followed by Tukey's test.
Figure S4. (A) LX‐2 cells were transfected with 2.5 μg pCAGGS‐WWP2 or vector and subsequently treated with 2 ng·mL‐1 TGF‐β1 with or without COS (5 or 10 μM) for 24 h after no FBS starvation. The protein expressions of WWP2, PPM1G, NICD3, HES1, and liver fibrosis markers were determined by immunoblotting with the indicated antibodies. (B) LX‐2 cells were transfected with 50 nM si‐WWP2‐1/2 or si‐Control and subsequently treated with 2 ng·mL‐1 TGF‐β1 with or without COS (5 or 10 μM) for 24 h after no FBS starvation. The same protein expressions were detected by western blot with the indicated antibodies. GAPDH was used as a loading control for all western blot assays. The data are expressed as the mean ± SD of five independent assays. #P < 0.05; significantly different from the pcDNA3.1/si‐control + COS 10 μM group; *P < 0.05; significantly different from the pCAGGS‐WWP2/si‐WWP2‐1 + 2 T group; &P < 0.05; significantly different from the si‐WWP2‐2 + 2 T group; ΔP < 0.05; significantly different from the pCAGGS‐WWP2 + 2 T + COS 10 μM group. ANOVA followed by Tukey's test.


