Abstract
Background
We aimed to characterize the relationships of lymphocyte activation gene-3 (LAG-3) expression, cytotoxic T-lymphocyte-associated antigen-4 (CTLA-4) expression, and CD8+ tumor-infiltrating lymphocyte (TIL) density, and to investigate the joint prognostic impact of these three markers in patients with surgically resected esophageal squamous cell carcinoma (ESCC).
Methods
Expression of LAG-3, CTLA-4 and the density of CD8+ TILs were evaluated by immunohistochemistry in resected ESCC. The associations between LAG-3 expression and clinicopathologic characteristics, as well as patient prognoses, were analyzed.
Results
A total of 183 patients were included. LAG-3 expression was observed in 69 (37.7%) patients. Positive LAG-3 expression was significantly associated with CTLA-4 expression (P=0.004). LAG-3 positivity, CTLA-4 positivity, and low CD8+ TIL densities were significantly associated with worsening recurrence-free survival (RFS) [LAG-3: hazard ratio (HR), 1.72; 95% confidence interval (CI), 1.10–2.89; P=0.019; CTLA-4: HR, 1.69; 95% CI, 1.04–2.73; P=0.033; CD8+: HR, 0.60; 95% CI, 0.38–0.94; P=0.025] and overall survival (OS) (LAG-3: HR, 2.09; 95% CI, 1.24–3.53; P=0.006; CTLA-4: HR, 1.47; 95% CI, 0.86–2.53; P=0.161; CD8+: HR, 0.56; 95% CI, 0.33–0.95; P=0.032). Subgroup analysis revealed that the LAG-3 CTLA-4 CD8+ group had the best RFS (P<0.001) and OS (P<0.001).
Conclusions
LAG-3 expression was correlated with CTLA-4 expression on TILs. Positive LAG-3 expression was associated with poor prognoses in ESCC. A combination of LAG-3, CTLA-4 expression and CD8+ TILs density could further stratify patients into different subgroups with distinct prognoses.
Keywords: Lymphocyte activation gene-3 (LAG-3), cytotoxic T-lymphocyte-associated antigen-4 (CTLA-4), tumor-infiltrating lymphocytes (TIL), prognosis, esophageal squamous cell carcinoma (ESCC)
Introduction
Esophageal cancer is a common malignant tumor of the digestive tract. Patients with esophageal squamous cell carcinoma (ESCC) (mainly in Eastern countries) suffer from high mortality rates, with a 5-year survival rate of less than 20% (1). At present, the treatment strategies for patients with ESCC mainly include cytotoxic chemotherapy, radiotherapy, and surgery. These modalities convey small survival benefits and significant adverse effects on patients (2,3). Therefore, finding novel and more effective therapeutic strategies for patients with ESCC remains an urgent need.
The last decade has witnessed the rapid development of immunotherapy, which can reverse tumor immune escape mechanisms by suppressing immune checkpoints (4). The inhibition of cytotoxic T-lymphocyte-associated antigen-4 (CTLA-4) can activate T cells to eliminate tumors (5,6). The inhibitors of CTLA-4 have shown promising efficacy in a variety of cancers (7,8). However, the efficacy of anti-CTLA-4 antibodies is still unproven in ESCC. Moreover, less than 20% of patients are expected to benefit from anti-CTLA-4 therapy (9), which highlights the necessity for further investigation into other checkpoint modulators in patients with ESCC, especially those associated with adaptive resistance to CTLA-4 inhibition.
Lymphocyte activation gene-3 (LAG-3) is another important immune checkpoint which belongs to the immunoglobulin superfamily. LAG-3 is expressed in various kinds of immune cells, including tumor-infiltrating lymphocytes (TILs), which play a key role in inhibiting T cell proliferation, activation, and homeostasis (10,11). LAG-3 is not only a surface molecule selectively upregulated on regulatory T (Treg) cells but also a key modulator of maximal Treg activity (12,13). LAG-3 can downregulate CD4+ T cell activity through binding with the major histocompatibility complex II (MHC class II) (14,15). Similarly, CTLA-4 can enhance Treg immunosuppressive activity and downregulate CD4+ T cell activity, which may have a synergistic effect with LAG-3 (6,12,16). It has been reported that LAG-3 expression on TILs was significantly correlated with that of programmed death 1 (PD-1) on TILs and programmed death ligand 1 (PD-L1) on tumor cells (17). However, the relationship between LAG-3 and CTLA-4 on TILs has not been investigated. LAG-3 has been demonstrated to be a favorable prognostic factor in ESCC (18,19) in contrast to its negative prognostic impact in other cancers, including head and neck squamous cell carcinoma, gastric cancer, and lung cancer (17,20,21). In order to promote and optimize the future application of immunotherapy in operable ESCC, we aimed to comprehensively explore the clinicopathological features of LAG-3 expression and the association between positive LAG-3 expression and clinical outcomes in patients with ESCC after surgical resection. More importantly, we also assessed the relationships between LAG-3, CTLA-4 expression, and CD8+ TIL density and further investigated the prognostic value of the different combinations of these three markers.
Methods
Patients
We retrospectively reviewed 261 patients with esophageal cancer who underwent surgical treatment in our department in the Second Affiliated Hospital of Soochow University, China, from January 2009 to December 2014. The patients in our study had to meet the following inclusion criteria: (I) patients that had not undergone any systemic therapy before surgery, and (II) patients who were pathologically confirmed with primary squamous cell carcinoma. The exclusion criteria were (I) patients with autoimmune diseases and other kinds of esophageal cancer (e.g., adenocarcinoma), (II) patients lost to follow-up, and (III) patients with concurrent multiple primary tumors or other malignancies. According to the criteria, 78 patients were excluded, while 183 patients were included in the current study. This study was approved by the Institutional Review Board of the Second Affiliated Hospital of Soochow University. Because of the retrospective nature of this study, the informed consent of patients was waived.
Immunohistochemistry
Three serial 4-µm-thick formalin-fixed paraffin-embedded tissue sections were taken from the same tumor specimen for LAG-3, CTLA-4, and CD8+ staining. First, the sections were deparaffinized and rehydrated, and endogenous peroxidase was quenched with 10% H2O2 at room temperature for 10 min. After this, nonspecific proteins were blocked with 10% goat serum for 1 h. The sections were then rinsed and incubated with the detection antibody [LAG-3 (Abcam, ab40465, China), CTLA-4 (Biorbyt, orb385624, China) and CD8+ (Abcam, ab4055, China)] overnight at 4 °C. The DAB Horseradish Peroxidase Color Development Kit (Beyotime, China) was used for color development after incubating with horseradish peroxidase conjugated secondary antibody at room temperature for 30 min. Cell nuclei were counterstained with hematoxylin, and the slides were dehydrated in an ethanol gradient, mounted with neutral gum, and stored for downstream analyses.
Immunohistochemistry evaluation
All specimens were determined by two experienced independent pathologists who were blind to the data (Li F and Zhang Y). Five visual fields were randomly selected in each section. Cells were regarded as positive if the cell membrane and/or cytoplasm stained brown. The intensity of staining and the percentage of positive cells were evaluated in all sections, and the final score was derived from the multiplication of the two parameters. The scoring system for staining intensity was as follows: one point, absent/weak staining; two points, moderate staining; three points, strong staining. The scoring system for the percentage of positive cells was as follows: one point, 33%; two points, >33% to 66%; three points, >66%. Sections with a final overall score of ≤3 were defined as the LAG-3 or CTLA-4 negative expression group; other sections were defined as the high expression group (22,23). CD8+ TIL density was evaluated both in the tumor parenchyma and mesenchymal area and was defined as low CD8+ TIL density if infiltration was <1% in the parenchyma and <10% in the mesenchyme at the same time, and defined as high CD8+ TILs density for other values (24). A consensus was reached after discussion if there were controversies or discordance in terms of immunohistochemical evaluation.
Statistical analyses
All clinical data are shown as mean ± standard deviation and n (%). We performed the chi-square test to assess the correlation between LAG-3 and clinical pathological variables. Spearman’s rank correlation analysis was used to analyze the association between LAG-3 and CTLA-4 or CD8+. We used variables of P<0.2 for a logistic regression model to investigate the independent predictive factors of LAG-3 expression. Also, the log-rank test was used to compare the survival for distinct groups of a variable. To evaluate the independent predictive factors for recurrence free survival (RFS) and overall survival (OS), a Cox proportional hazard regression model was applied to evaluate the prognostic impact of a potentially survival-related variable. The survival curves were estimated by the Kaplan-Meier method. Statistical analyses were performed in SPSS 25.0 (IBM Corporation, Armonk, NY, USA). In addition, we used the Tumor IMmune Estimation Resource (TIMER, a website based on the Cancer Genome Atlas database, https://cistrome.shinyapps.io/timer/) to explore differential gene expression in tumors and normal tissues as well as the correlation between LAG-3 and CTLA-4, which served as external validation. In our study, a two-sided P value of less than 0.05 was considered statistically significant.
Results
Baseline information
The clinical characteristics of the 183 patients are shown in Table 1. The mean age at diagnosis was 63 years (range, 35–81 years). Patients were followed up until their death or last follow-up (median: 56 months). In our cohort, 147 patients (80.3%) were male, and 36 (19.7%) were female. Seventy-three patients (39.9%) were non-smokers. Eight (4.4%), 115 (62.8%), and 60 (32.8%) patients had upper, middle, and lower thoracic ESCC, respectively.
Table 1. Correlation between LAG-3 expression and clinicopathologic parameters.
| Variables | LAG-3 expression | P | |
|---|---|---|---|
| Negative (N=114) | Positive (N=69) | ||
| Age (years), mean ± SD | 62.1±9.5 | 64.7±8.4 | 0.058 |
| ≤65 | 70 [61] | 36 [52] | 0.220 |
| >65 | 44 [39] | 33 [48] | |
| Sex, n [%] | 0.870 | ||
| Male | 92 [81] | 55 [80] | |
| Female | 22 [19] | 14 [20] | |
| Smoking, n [%] | 0.646 | ||
| Non-smoker | 44 [39] | 29 [42] | |
| Smoker | 70 [61] | 40 [58] | |
| Tumor location, n [%] | 0.180 | ||
| Upper | 6 [5] | 2 [3] | |
| Middle | 76 [67] | 39 [57] | |
| Lower | 32 [28] | 28 [41] | |
| T stage, n [%] | 0.635 | ||
| T1 | 6 [5] | 5 [7] | |
| T2 | 43 [38] | 31 [45] | |
| T3 | 57 [50] | 28 [41] | |
| T4 | 8 [7] | 5 [7] | |
| N stage, n [%] | 0.051 | ||
| N0 | 80 [70] | 37 [54] | |
| N1 | 27 [24] | 28 [41] | |
| N2 | 7 [6] | 4 [6] | |
| Pathologic differentiation, n [%] | 0.170 | ||
| High | 10 [9] | 2 [3] | |
| Moderate | 79 [69] | 46 [67] | |
| Poor | 25 [22] | 21 [30] | |
| Vascular invasion, n [%] | 0.982 | ||
| Absent | 99 [87] | 60 [87] | |
| Present | 15 [13] | 9 [13] | |
| Perineural involvement, n [%] | 0.360 | ||
| Absent | 101 [89] | 64 [93] | |
| Present | 13 [11] | 5 [7] | |
| Surgical type, n [%] | 0.212 | ||
| Sweet | 39 [34] | 27 [39] | |
| Ivor-Lewis | 42 [37] | 30 [43] | |
| McKeown | 33 [29] | 12 [17] | |
| CTLA-4 expression, n [%] | <0.001 | ||
| Negative | 72 [63] | 25 [36] | |
| Positive | 42 [37] | 44 [64] | |
| CD8 expression, n [%] | 0.013 | ||
| Negative | 51 [45] | 44 [64] | |
| Positive | 63 [55] | 25 [36] | |
LAG-3, lymphocyte activation gene-3; CTLA-4, cytotoxic T-lymphocyte-associated antigen-4; TIL, tumor-infiltrating lymphocyte.
Associations between LAG-3 expression and clinicopathological characteristics
According to the chi-square test, no statistically significant association was found between LAG-3 expression and age, sex, smoking status, tumor location, T stage, N stage, pathological differentiation, vascular invasion, perineural involvement, or surgical type (Table 1). However, the results of Spearman’s rank correlation analysis showed that LAG-3 positivity was significantly associated with N stage (r=0.154, P=0.038) (Table S1).
Table S1. Correlation between LAG-3 expression and clinicopathological parameters.
| Variables | Correlation with LAG-3, r | P |
|---|---|---|
| Age | 0.091 | 0.233 |
| Sex | 0.012 | 0.871 |
| Smoking | −0.034 | 0.648 |
| Tumor location | 0.134 | 0.070 |
| T stage | −0.081 | 0.277 |
| N stage | 0.154 | 0.038 |
| Pathologic differentiation | 0.127 | 0.087 |
| Vascular invasion | −0.002 | 0.982 |
| Perineural involvement | −0.068 | 0.363 |
| Surgical type | −0.099 | 0.180 |
| CTLA-4 | 0.261 | <0.001 |
| CD8 | −0.185 | 0.012 |
LAG-3, lymphocyte activation gene-3; CTLA-4, cytotoxic T-lymphocyte-associated antigen-4; TIL, tumor-infiltrating lymphocyte.
Associations between LAG-3, CTLA-4 and CD8+ expression
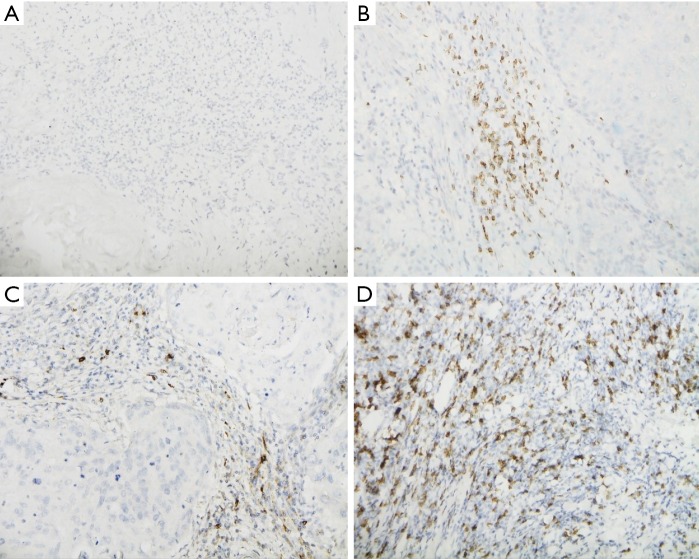
As shown in Figure 1, LAG-3, CTLA-4, and CD8+ were expressed on TILs but were not found on tumor cells. Positive LAG-3, CTLA-4, and CD8+ expression was detected in 69 (37.7%), 86 (47.0%), and 88 (48.1%) patients, respectively. LAG-3 positivity was significantly associated with positive CTLA-4 expression (P<0.001) and high CD8+ TIL density (P=0.013, Table 1). Spearman’s rank correlation analyses also demonstrated the same results (LAG-3 and CTLA-4: r=0.261, P<0.001; LAG-3 and CD8+: r=−0.185, P=0.012) (Table S1). Moreover, further multivariate logistic regression analysis indicated that only CTLA-4 positivity [odds ratio (OR), 0.38; 95% CI, 0.20–0.74; P=0.004] was an independent predictive factor for LAG-3 expression (Table 2).
Figure 1.
LAG-3 negative expression on TILs and positive IHC staining for LAG-3, CTLA-4, and CD8+. (A) LAG-3 negative expression on TILs; (B) IHC positivity for LAG-3; (C) IHC positivity for CTLA-4; (D) IHC positivity for CD8+. (Photograph magnification: ×400).TILs, tumor-infiltrating lymphocytes; IHC, immunochemistry; LAG-3, lymphocyte activation gene-3; CTLA-4, cytotoxic T-lymphocyte-associated antigen-4.
Table 2. Multivariate logistic regression model for LAG-3 expression in patients with esophageal squamous cell carcinoma.
| Variables | Multivariate | |
|---|---|---|
| OR (95% CI) | P | |
| Tumor location (upper vs. middle & lower) | 0.60 (0.11–3.34) | 0.559 |
| N stage (N0 vs. N1-2) | 0.55 (0.29–1.06) | 0.076 |
| Pathologic differentiation (high vs. moderate & poor) | 0.24 (0.05–1.25) | 0.091 |
| CTLA-4 expression (negative vs. positive) | 0.38 (0.20–0.74) | 0.004 |
| CD8 expression (negative vs. positive) | 1.81 (0.94–3.47) | 0.075 |
LAG-3, lymphocyte activation gene-3; CTLA-4, cytotoxic T-lymphocyte-associated antigen-4; TIL, tumor-infiltrating lymphocyte; OR, odds, ratio.
Prognostic value of LAG-3, CTLA-4 and CD8+ expression
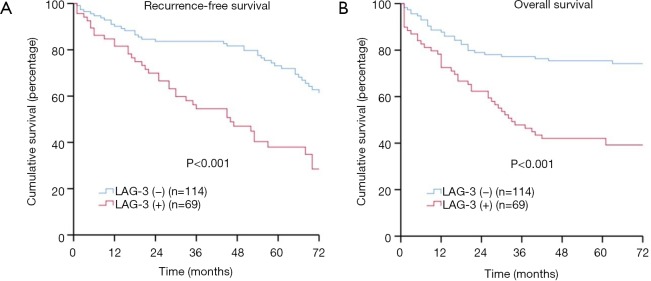
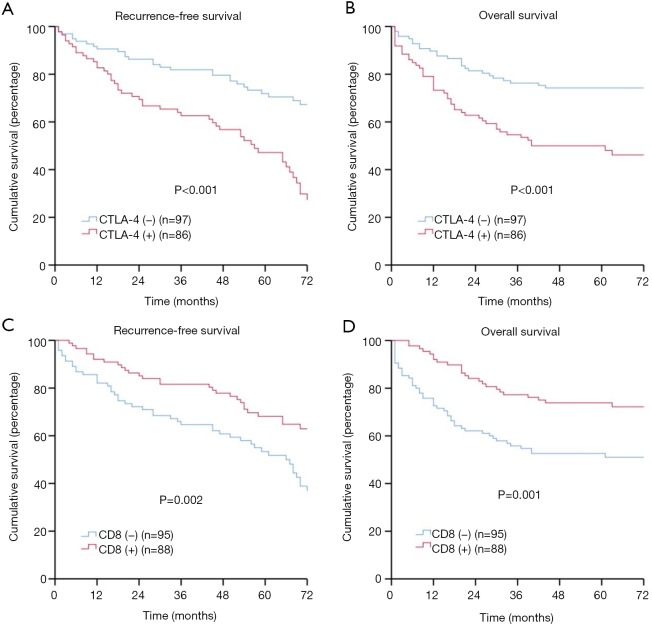
As shown in Figure 2A,B, the log-rank tests revealed that patients with negative LAG-3 expression had significantly better RFS (5-year rate: 58.8% versus 40.6%, P<0.001) and OS (5-year rate: 74.6% versus 42.0%, P<0.001) compared with those with positive LAG-3 expression. Meanwhile, patients with CTLA-4 negative expression had significantly better survival compared to those with positive CTLA-4 expression (5-year RFS rate: 60.8% versus 43.0%, P<0.001; 5-year OS rate: 74.2% versus 47.7%, P<0.001) (Figure S1A,B). Additionally, patients with low CD8+ TIL density had significantly lower survival when compared to those with high CD8+ TIL density (5-year RFS rate: 44.2% versus 61.4%, P=0.002; 5-year OS rate: 51.6% versus 72.7%, P=0.001) (Figure S1C,D).
Figure 2.
LAG-3 positivity, recurrence-free survival (RFS), and overall survival (OS) in patients with esophageal squamous cell carcinoma (ESCC). (A) RFS by LAG-3; (B) OS by LAG-3. LAG-3, lymphocyte activation gene-3.
Correlation between a combination of LAG-3 and CTLA-4 expression and/or CD8+ TIL density, and clinical outcomes
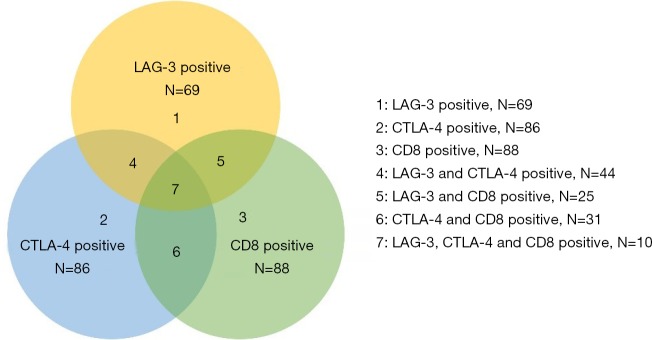
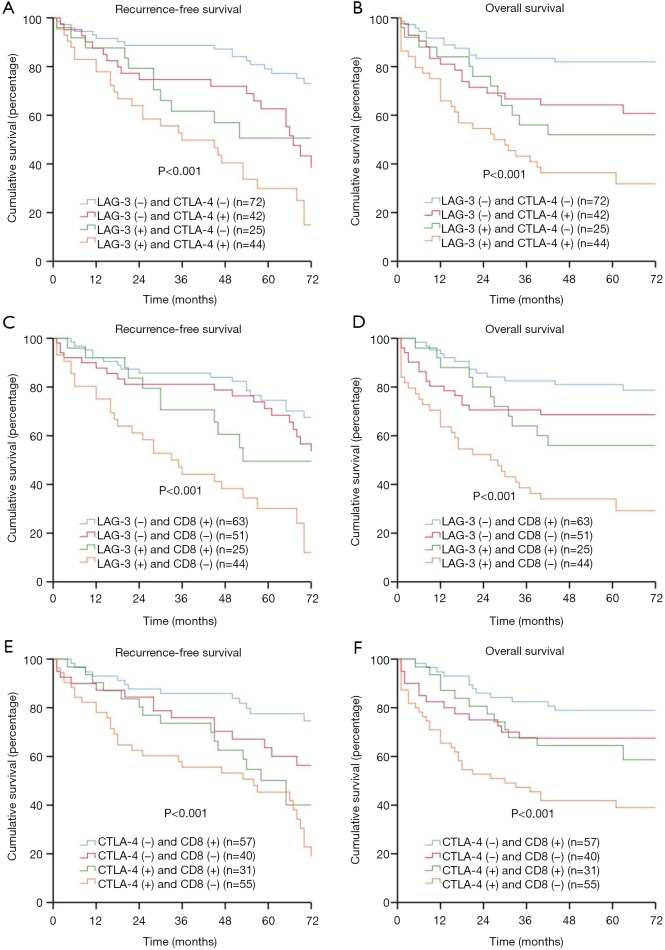
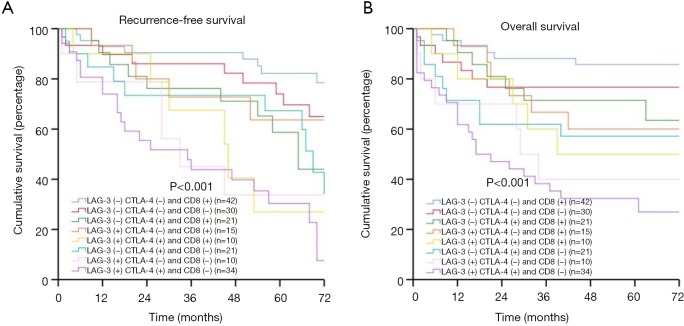
Co-expression of LAG-3, CTLA-4, and CD8+ was present in different combinations in our patient group. We had (I) 44 patients with LAG-3+ CTLA-4+, (II) 25 patients with LAG-3+ CD8+, (III) 31 patients with CTLA-4+ CD8+, (IV) 10 patients with LAG-3+ CTLA-4+ CD8+ (Figure S2). The combination of LAG-3 and/or CTLA-4 expression or CD8+ TIL density could be used to further stratify patients into subgroups with distinct prognoses. Patients with LAG-3− CTLA-4− had the best prognoses, patients with LAG-3+ CTLA-4− or LAG-3− CTLA-4+ had moderate prognoses, and patients with LAG-3+ CTLA-4+ had the worst prognoses (RFS: P<0.001; OS: P<0.001) (Figure 3A,B). Patients with LAG-3−/CTLA-4− CD8+ had the best prognoses, patients with LAG-3+/CTLA-4+ CD8+ or LAG-3−/CTLA-4− CD8− had moderate prognoses, and patients with LAG-3+/CTLA-4+ CD8− had the worst prognoses (RFS: P<0.001/P<0.001; OS: P<0.001/P<0.001) (Figure 3C,D,E,F). Moreover, patients with LAG-3− CTLA-4− CD8+ had the best prognoses, and patients with LAG-3+ CTLA-4+ CD8− had the worst prognoses (RFS: P<0.001; OS: P<0.001) (Figure 4A,B).
Figure S2.
Description of LAG-3, CTLA-4, CD8+ expression, and co-expression. LAG-3, lymphocyte activation gene-3; CTLA-4, cytotoxic T-lymphocyte-associated antigen-4.
Figure 3.
LAG-3, CTLA-4, CD8+, recurrence-free survival (RFS), and overall survival (OS) in patients with esophageal squamous cell carcinoma (ESCC). (A) RFS by LAG-3 and CTLA-4; (B) OS by LAG-3 and CTLA-4; (C) RFS by LAG-3 and CD8+; (D) OS by LAG-3 and CD8; (E) RFS by CTLA-4 and CD8. (F) OS by CTLA-4 and CD8+. LAG-3, lymphocyte activation gene-3; CTLA-4, cytotoxic T-lymphocyte-associated antigen-4.
Figure 4.
LAG-3, CTLA-4, CD8+, and recurrence-free survival (RFS), overall survival (OS) in patients with esophageal squamous cell carcinoma ESCC). (A) RFS by LAG-3, CTLA-4, and CD8+; (B) OS by LAG-3, CTLA-4, and CD8+. LAG-3, lymphocyte activation gene-3; CTLA-4, cytotoxic T-lymphocyte-associated antigen-4.
Multivariate analysis of RFS and OS
We included the variables of P<0.2 [RFS: age (P=0.164), N stage (P<0.001), LAG-3 expression (P<0.001), CTLA-4 expression (P<0.001), and CD8+ expression (P=0.002); OS: age (P=0.153), N stage (P<0.001), perineural involvement (P=0.141), LAG-3 expression (P<0.001), CTLA-4 expression (P<0.001), and CD8+ expression (P=0.001)] in the univariate analyses and survival-associated variables into the Cox regression analyses. As shown in Table 3, regional lymph node metastasis [hazard ratio (HR), 1.88; 95% CI, 1.20–2.94; P=0.006), LAG-3 positivity (HR, 1.72; 95% CI, 1.10–2.89; P=0.019) and CTLA-4 positivity (HR, 1.69; 95% CI, 1.04–2.73; P=0.033) were independent prognostic factors of worsening RFS. Conversely, high CD8+ TIL density (HR, 0.60; 95% CI, 0.38–0.94; P=0.025) was a favorable indicator of superior RFS. Moreover, regional lymph node metastasis (HR, 1.97; 95% CI, 1.20–3.23; P=0.007) and LAG-3 positivity (HR, 2.09; 95% CI, 1.24–3.53; P=0.006) were independent risk factors of worsening OS, whereas high CD8+ TIL density (HR, 0.56; 95% CI, 0.33–0.95; P=0.032) represented a favorable predictor for better OS.
Table 3. Cox proportional-hazards regression model for recurrence-free survival (RFS) and overall survival (OS) in all patients.
| Variables | Recurrence-free survival | Overall survival | |||||||
|---|---|---|---|---|---|---|---|---|---|
| Univariate | Multivariate | Univariate | Multivariate | ||||||
| P | HR (95% CI) | P | P | HR (95% CI) | P | ||||
| Age (> 65 vs. ≤65) | 0.164 | 1.12 (0.72–1.75) | 0.625 | 0.153 | 1.24 (0.76–2.03) | 0.386 | |||
| Sex (female vs. male) | 0.724 | 0.844 | |||||||
| Smoking (current or ex vs. non-smoker) | 0.243 | 0.240 | |||||||
| Tumor location (middle & lower vs. upper) | 0.959 | 0.93 (0.29–3.01) | 0.903 | 0.411 | 2.31 (0.48–11.20) | 0.299 | |||
| T stage (T2-4 vs. T1) | 0.255 | 2.34 (0.67–8.12) | 0.181 | 0.396 | 1.48 (0.43–5.13) | 0.538 | |||
| N stage (N1-2 vs. N0) | <0.001 | 1.88 (1.20–2.94) | 0.006 | <0.001 | 1.97 (1.20–3.23) | 0.007 | |||
| Pathologic differentiation (moderate & poor vs. high) | 0.724 | 0.94 (0.36–2.44) | 0.892 | 0.377 | 1.22 (0.37–4.04) | 0.746 | |||
| Vascular invasion (present vs. absent) | 0.401 | 0.282 | |||||||
| Perineural involvement (present vs. absent) | 0.624 | 0.141 | 0.42 (0.15–1.19) | 0.102 | |||||
| Surgical type (McKeown vs. Sweet & Ivor-Lewis) | 0.485 | 1.20 (0.71–2.05) | 0.493 | 0.387 | 1.55 (0.88–2.71) | 0.128 | |||
| LAG-3 (positive vs. negative) | <0.001 | 1.72 (1.10–2.89) | 0.019 | <0.001 | 2.09 (1.24–3.53) | 0.006 | |||
| CTLA-4 (positive vs. negative) | <0.001 | 1.69 (1.04–2.73) | 0.033 | <0.001 | 1.47 (0.86–2.53) | 0.161 | |||
| CD8 (positive vs. negative) | 0.002 | 0.60 (0.38–0.94) | 0.025 | 0.001 | 0.56 (0.33–0.95) | 0.032 | |||
Variables with P value <0.2 in univariate models and variables clinically considered to have an impact on survival were analyzed in a multivariate analysis model. LAG-3, lymphocyte activation gene-3; CTLA-4, cytotoxic T-lymphocyte-associated antigen-4; TIL, tumor-infiltrating lymphocyte; HR, hazard ratio.
Discussion
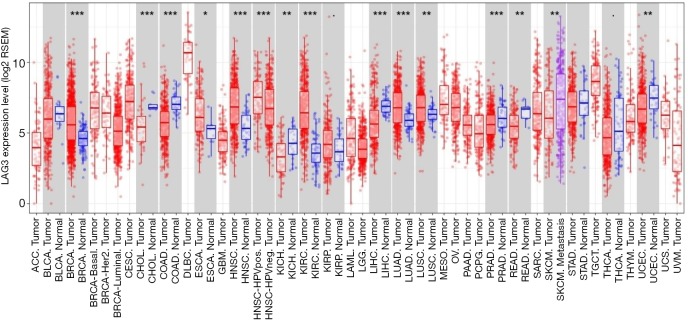
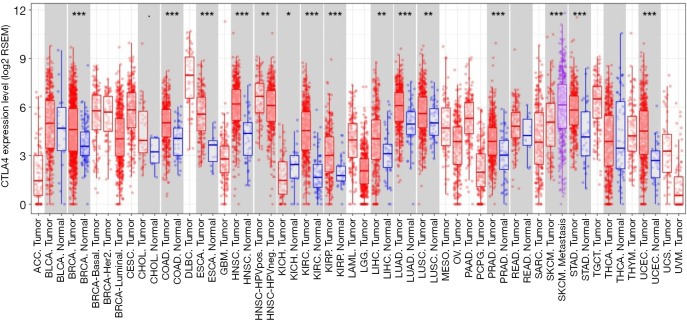
As shown using TIMER, the respective expression level of LAG-3 and CTLA-4 in tumor tissues was significantly higher than that in normal tissues (LAG-3: P<0.05; CTLA-4: P<0.001) in patients with esophageal cancer (Figures S3,S4). Furthermore, LAG-3 expression levels were significantly correlated with CTLA-4 expression levels in tumor tissues (r=0.781; P<0.001) (Figure S5), which partly supported our results. To the best of our knowledge, this is the first study to characterize LAG-3 and CTLA-4 expression, along with their prognostic significance in patients with surgically resected ESCC. We found that CTLA-4 positivity was an independent predictive factor for LAG-3 expression. Moreover, positive LAG-3 expression, positive CTLA-4 expression, and low CD8+ TIL density were independent predictors of worsening RFS and OS. The combination of these three markers could further stratify patients into different subgroups with distinct prognoses.
Figure S3.
The expression levels of LAG-3 in different cancers. LAG-3, lymphocyte activation gene-3.
Figure S4.
The expression levels of CTLA-4 in different cancers. CTLA-4, cytotoxic T-lymphocyte-associated antigen-4.
Figure S5.

Correlation between LAG-3 expression levels and CTLA-4 expression levels in patients with esophageal cancer. LAG-3, lymphocyte activation gene-3; CTLA-4, cytotoxic T-lymphocyte-associated antigen-4.
The use of immunotherapy is a milestone for cancer treatment, which activates the immune system to eradicate tumor cells. However, the exact clinical utility of immunotherapy for ESCC is still unclear. LAG-3 is a promising target because it is one of the key inhibitory receptors that contributes to T-cell exhaustion (25). Anti-LAG-3 inhibitors can activate T effector cells and reduce the immunosuppressive activity of Tregs, whereas anti-PD-1 and anti-PD-L1 inhibitors do not reduce the activity of Tregs (26). Furthermore, studies have reported that LAG-3 plays an important role in the immune response and the relative safety of anti-LAG-3 inhibitors in animal models (27).
Additionally, LAG-3 inhibitors (such as Relatlimab, IMP321, BMS-986016, LAG525, MK-4280, TSR-032) have entered clinical trials for different cancers, either alone or in combination, and are showing promising efficacy (28-30). It was reported that the blockade of LAG-3 and other checkpoints could synergistically enhance T-cell activity and anti-tumor immunity (31). However, there has been no study characterizing the relationships between LAG-3 and CTLA-4. Since LAG-3 and CTLA-4 have similar effects in suppressing the immune system by down-regulating CD4+ T cells and enhancing Tregs, blockade of LAG-3 may help overcome the adaptive resistance of CTLA-4 inhibitors, which could also be helpful in improving CTLA-4 inhibition-based therapy. Therefore, anti-LAG-3 inhibitors may exhibit greater efficacy in the future immunotherapy of ESCC patients with positive LAG-3 expression (32).
Two previous studies have demonstrated that LAG-3 was a favorable prognostic factor for patients with ESCC (18,19), which conflicts with our results. The potential reason for this discrepancy may be attributed to the following: (I) different analytical methods and (II) different definitions of positive LAG-3 expression. Specifically, expression levels based on immunohistochemical staining may be different from those measured by mRNA microarrays. Also, an optional cut-off value for defining high and low LAG-3 expression may affect the survival analysis of the patients. More importantly, the two studies mentioned above demonstrated that the expression of LAG-3 in tumor tissues was significantly higher than that in surrounding tissues, and blocking LAG-3 could activate CTLs, suggesting that LAG-3 may be involved in tumorigenesis, and therefore, the blockade of LAG-3 may activate the immune system.
As shown in our study, positive LAG-3 expression significantly correlated with positive CTLA-4 expression. The combination of different expression levels among LAG-3, CTLA-4, and CD8+ could stratify patients into more detailed subgroups. According to the Kaplan-Meier curves for RFS and OS, the expression of a single immune checkpoint is not enough to determine the use of an immune inhibitor. For instance, when CTLA-4 and CD8+ expression was positive, the prognosis was not affected regardless of LAG-3 expression. Therefore, when positive LAG-3 expression was detected alone, substantial survival benefit would not be obtained in patients treated with anti-LAG-3 inhibitors alone. More importantly, for ESCC expressing both LAG-3 and CTLA-4, combined immunotherapy targeting LAG-3 and CTLA-4 could be more effective, especially for those infiltrated with abundant CD8+ T cells. This is because the cytotoxicity of pre-existing T cells would be turned off by LAG-3 and CTLA-4 engagement. Taken together, for current immunotherapy, the expression levels of multiple immune checkpoints should be monitored. A combination of LAG-3 inhibitors and CTLA-4 inhibitors may be an effective method for patients with ESCC. Additionally, the combination of LAG-3 and PD-1/PD-L1 may be a future direction of more attempts.
There are some limitations to our study. First, because of the retrospective nature of this study, selection bias and performance bias were inevitable. Second, the number of patients enrolled in our study was limited, which potentially affected our subgroup analyses, as patients with esophageal adenocarcinoma were not included in our study. Further prospective multicenter studies are warranted to address these limitations.
Conclusions
In summary, LAG-3 is expressed on TILs in patients with ESCC. Positive LAG-3 expression was significantly associated with positive CTLA-4 expression and poor prognosis in ESCC. LAG-3, CTLA-4 expression, and CD8+ TIL density were independent prognostic factors for clinical outcomes of ESCC patients. Furthermore, we found that diverse prognostic features were exhibited among subgroups stratified by the expression levels of LAG-3, CTLA-4, and CD8+. The combined expression of LAG-3, CTLA-4, and CD8+ in ESCC may serve as predictive biomarkers for immunotherapy in the future.
Figure S1.
CTLA-4 positivity, CD8+, and recurrence-free survival (RFS), overall survival (OS) in patients with esophageal squamous cell carcinoma (ESCC). (A) RFS by LAG-3; (B) OS by LAG-3; (C) RFS by CD8+; (D) OS by CD8+. CTLA-4, cytotoxic T-lymphocyte-associated antigen-4.
Acknowledgments
We want to thank Dr. Feng Li for his substantial aid in the review of the paraffin sections.
Funding: This work was supported by the Suzhou Key Discipline for Medicine (SZXK201803), the Suzhou Key Laboratory of Thoracic Oncology (SZS201907), the Municipal Program of People’s Livelihood Science and Technology in Suzhou (SS2019061), and the Municipal Program of Science and Technology in Suzhou (SYS201725).
Ethical Statement: The authors are accountable for all aspects of the work in ensuring that questions related to the accuracy or integrity of any part of the work are appropriately investigated and resolved. This study was approved by the Institutional Review Board of the Second Affiliated Hospital of Soochow University.
Footnotes
Conflicts of Interest: The authors have no conflicts of interest to declare.
References
- 1.Ferlay J, Colombet M, Soerjomataram I, et al. Estimating the global cancer incidence and mortality in 2018: GLOBOCAN sources and methods. Int J Cancer 2019;144:1941-53. 10.1002/ijc.31937 [DOI] [PubMed] [Google Scholar]
- 2.Gebski V, Burmeister B, Smithers BM, et al. Survival benefits from neoadjuvant chemoradiotherapy or chemotherapy in oesophageal carcinoma: a meta-analysis. Lancet Oncol 2007;8:226-34. 10.1016/S1470-2045(07)70039-6 [DOI] [PubMed] [Google Scholar]
- 3.Nguyen NP, Krafft SP, Vinh-Hung V, et al. Feasibility of tomotherapy to reduce normal lung and cardiac toxicity for distal esophageal cancer compared to three-dimensional radiotherapy. Radiother Oncol 2011;101:438-42. 10.1016/j.radonc.2011.07.015 [DOI] [PubMed] [Google Scholar]
- 4.Couzin-Frankel J. Cancer Immunotherapy. Science 2013;342:1432-3. 10.1126/science.342.6165.1432 [DOI] [PubMed] [Google Scholar]
- 5.Pitt JM, Marabelle A, Eggermont A, et al. Targeting the tumor microenvironment: removing obstruction to anticancer immune responses and immunotherapy. Ann Oncol 2016;27:1482-92. 10.1093/annonc/mdw168 [DOI] [PubMed] [Google Scholar]
- 6.Pardoll DM. The blockade of immune checkpoints in cancer immunotherapy. Nat Rev Cancer 2012;12:252-64. 10.1038/nrc3239 [DOI] [PMC free article] [PubMed] [Google Scholar]
- 7.Hodi FS, Chiarion-Sileni V, Gonzalez R, et al. Nivolumab plus ipilimumab or nivolumab alone versus ipilimumab alone in advanced melanoma (CheckMate 067): 4-year outcomes of a multicentre, randomised, phase 3 trial. Lancet Oncol 2018;19:1480-92. 10.1016/S1470-2045(18)30700-9 [DOI] [PubMed] [Google Scholar]
- 8.Sharma P, Allison JP. The future of immune checkpoint therapy. Science 2015;348:56-61. 10.1126/science.aaa8172 [DOI] [PubMed] [Google Scholar]
- 9.Dempke WCM, Fenchel K, Uciechowski P, et al. Second- and third-generation drugs for immuno-oncology treatment-The more the better? Eur J Cancer 2017;74:55-72. 10.1016/j.ejca.2017.01.001 [DOI] [PubMed] [Google Scholar]
- 10.Kisielow M, Kisielow J, Capoferri-Sollami G, et al. Expression of lymphocyte activation gene 3 (LAG-3) on B cells is induced by T cells. Eur J Immunol 2005;35:2081-8. 10.1002/eji.200526090 [DOI] [PubMed] [Google Scholar]
- 11.Grosso JF, Kelleher CC, Harris TJ, et al. LAG-3 regulates CD8+T cell accumulation and effector function in murine self- and tumor-tolerance systems. J Clin Invest 2007;117:3383-92. 10.1172/JCI31184 [DOI] [PMC free article] [PubMed] [Google Scholar]
- 12.Huang CT, Workman CJ, Flies D, et al. Role of LAG-3 in regulatory T cells. Immunity 2004;21:503-13. 10.1016/j.immuni.2004.08.010 [DOI] [PubMed] [Google Scholar]
- 13.Goldberg MV, Drake CG. LAG-3 in Cancer Immunotherapy. Curr Top Microbiol Immunol 2011;344:269-78. 10.1007/82_2010_114 [DOI] [PMC free article] [PubMed] [Google Scholar]
- 14.Huard B, Prigent P, Pages F, et al. T cell major histocompatibility complex class II molecules down-regulate CD4(+) T cell clone responses following LAG-3 binding. Eur J Immunol 1996;26:1180-6. 10.1002/eji.1830260533 [DOI] [PubMed] [Google Scholar]
- 15.Hannier S, Triebel F. The MHC class II ligand lymphocyte activation gene-3 is co-distributed with CD8 and CD3-TCR molecules after their engagement by mAb or peptide-MHC class I complexes. Int Immunol 1999;11:1745-52. 10.1093/intimm/11.11.1745 [DOI] [PubMed] [Google Scholar]
- 16.He Y, Rivard CJ, Rozeboom L, et al. Lymphocyte-activation gene-3, an important immune checkpoint in cancer. Cancer Sci 2016;107:1193-7. 10.1111/cas.12986 [DOI] [PMC free article] [PubMed] [Google Scholar]
- 17.He Y, Yu H, Rozeboom L, et al. LAG-3 Protein Expression in Non-Small Cell Lung Cancer and Its Relationship with PD-1/PD-L1 and Tumor-Infiltrating Lymphocytes. J Thorac Oncol 2017;12:814-23. 10.1016/j.jtho.2017.01.019 [DOI] [PubMed] [Google Scholar]
- 18.Zhang Y, Liu YD, Luo YL, et al. Prognostic Value of Lymphocyte Activation Gene-3 (LAG-3) Expression in Esophageal Squamous Cell Carcinoma. J Cancer 2018;9:4287-93. 10.7150/jca.26949 [DOI] [PMC free article] [PubMed] [Google Scholar]
- 19.Sun N, Li Y, He J. Clinical relevance of common inhibitory immune checkpoint genes in esophageal squamous cell carcinoma. Zhonghua Yi Xue Za Zhi 2018;98:1703-6. [DOI] [PubMed] [Google Scholar]
- 20.Takaya S, Saito H, Ikeguchi M. Upregulation of Immune Checkpoint Molecules, PD-1 and LAG-3, on CD4+and CD8+T Cells after Gastric Cancer Surgery. Yonago Acta Medica 2015;58:39-44. [PMC free article] [PubMed] [Google Scholar]
- 21.Deng WW, Mao L, Yu GT, et al. LAG-3 confers poor prognosis and its blockade reshapes antitumor response in head and neck squamous cell carcinoma. Oncoimmunology 2016;5:e1239005. 10.1080/2162402X.2016.1239005 [DOI] [PMC free article] [PubMed] [Google Scholar]
- 22.Shan B, Man H, Liu J, et al. TIM-3 promotes the metastasis of esophageal squamous cell carcinoma by targeting epithelial-mesenchymal transition via the Akt/GSK-3/Snail signaling pathway. Oncol Rep 2016;36:1551-61. 10.3892/or.2016.4938 [DOI] [PubMed] [Google Scholar]
- 23.Loos M, Hedderich DM, Ottenhausen M, et al. Expression of the costimulatory molecule B7-H3 is associated with prolonged survival in human pancreatic cancer. BMC Cancer 2009;9:463. 10.1186/1471-2407-9-463 [DOI] [PMC free article] [PubMed] [Google Scholar]
- 24.Duan J, Xie Y, Qu L, et al. A nomogram-based immunoprofile predicts overall survival for previously untreated patients with esophageal squamous cell carcinoma after esophagectomy. J Immunother Cancer 2018;6:100. 10.1186/s40425-018-0418-7 [DOI] [PMC free article] [PubMed] [Google Scholar]
- 25.Wherry EJ. T cell exhaustion. Nat Immunol 2011;12:492-9. 10.1038/ni.2035 [DOI] [PubMed] [Google Scholar]
- 26.Gagliani N, Magnani CF, Huber S, et al. Coexpression of CD49b and LAG-3 identifies human and mouse T regulatory type 1 cells. Nat Med 2013;19:739-46. 10.1038/nm.3179 [DOI] [PubMed] [Google Scholar]
- 27.Rotte A, Jin JY, Lemaire V. Mechanistic overview of immune checkpoints to support the rational design of their combinations in cancer immunotherapy. Ann Oncol 2018;29:71-83. 10.1093/annonc/mdx686 [DOI] [PubMed] [Google Scholar]
- 28.Vandenabeele P, Vandecasteele K, Bachert C, et al. Immunogenic Apoptotic Cell Death and Anticancer Immunity. Adv Exp Med Biol 2016;930:133-49. 10.1007/978-3-319-39406-0_6 [DOI] [PubMed] [Google Scholar]
- 29.Ascierto PA, Bono P, Bhatia S, et al. Efficacy of BMS-986016, a monoclonal antibody that targets lymphocyte activation gene-3 (LAG-3), in combination with nivolumab in pts with melanoma who progressed during prior anti-PD-1/PD-L1 therapy (mel prior IO) in all-comer and biomarker-enriched populations. Ann Oncol 2017;28:v605-49. 10.1093/annonc/mdx440.011 [DOI] [Google Scholar]
- 30.Andrews LP, Marciscano AE, Drake CG, et al. LAG3 (CD223) as a cancer immunotherapy target. Immunol Rev 2017;276:80-96. 10.1111/imr.12519 [DOI] [PMC free article] [PubMed] [Google Scholar]
- 31.Woo SR, Turnis ME, Goldberg MV, et al. Immune Inhibitory Molecules LAG-3 and PD-1 Synergistically Regulate T-cell Function to Promote Tumoral Immune Escape. Cancer Res 2012;72:917-27. 10.1158/0008-5472.CAN-11-1620 [DOI] [PMC free article] [PubMed] [Google Scholar]
- 32.Topalian SL, Hodi FS, Brahmer JR, et al. Safety, Activity, and Immune Correlates of Anti-PD-1 Antibody in Cancer. N Engl J Med 2012;366:2443-54. 10.1056/NEJMoa1200690 [DOI] [PMC free article] [PubMed] [Google Scholar]


