Abstract
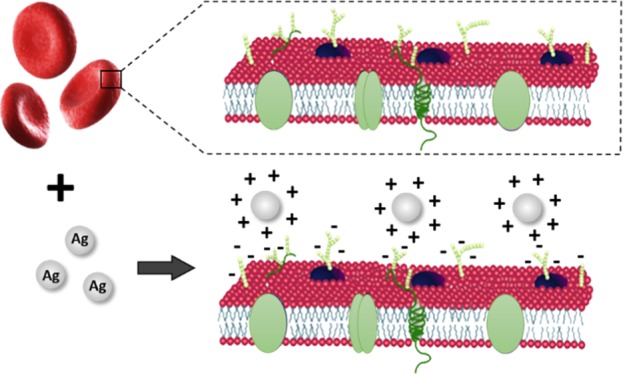
Advancements in the field of nanotechnology have resulted in the emergence of a large variety of engineered nanomaterials for innumerable applications. Despite the ubiquitous use of nanomaterials in daily life, concerns regarding the potential toxicity and safety of these materials have also been raised. There is a high demand for assessing the unwanted effects of both gold and silver nanoparticles, which is increasingly being used in biomedical applications. This paper deals with the study of stress due to silver and gold nanoparticles of varying size on red blood cells (RBCs) using Raman tweezers spectroscopy. RBCs were incubated with nanoparticles of size in the 10–100 nm range with the same concentrations, and micro-Raman spectra were recorded by optically trapping the nanoparticle-treated live RBCs. Spectral modifications implicating hemoglobin deoxygenation were observed in all nanoparticle-treated RBCs. One of the probable reason for the deoxygenation trend can be the adhesion of nanoparticles onto the cell surface causing imbalance in cell functioning. Moreover, the higher spectral variations observed for silver nanoparticles indicate that oxidative stress is involved in cell damage. These mechanisms lead to the modification in the hemoglobin structure because of changes in the pH of cytoplasm, which can be detected using Raman spectroscopy.
Introduction
Nanoscience and technology has become one of the leading disciplines because of unique chemical and physical properties of nanomaterials. Nanomaterials have gathered high attention owing to their applications in different arenas of medicine and biology such as bio-imaging, cancer therapy, drug delivery, biosensors, agriculture, and so forth.1−11 Nanoparticles can enter human body in different ways such as ingestion or through skin.12,13 The application of nanoparticles in drug delivery and cosmetics may result in intrusion of nanoparticles in the human body.14 Once the nanoparticles enter into the human body, they can interact with tissues, cells, and biomolecules present in body fluids.15−17 Even though nanomaterials have been widely used, there is a lack of information regarding the nanoparticle–cell interactions and its implications on health. For the nanoparticles to enter the cell, it has to make its way across the cell membrane. Therefore, one of the key factors while considering nanoparticle toxicity is their interaction with the cell membrane18. Interaction of metal nanoparticles can occur through different mechanisms; it can enter cells either by active or passive uptake depending on the cell type.19 Phagocyte cells such as neutrophils, macrophages, and monocytes engulf the particles.20 Passive transport is adopted by the cells lacking endocytosis machinery such as red blood cells (RBCs).21
Investigation of cellular responses toward the presence of these foreign agents is of paramount importance in recognizing the biological functioning under stress factors and further cellular regulation. The size of the nanoparticles plays an important role in determining their interaction with biological cells.19 Internalization mechanism, uptake efficiency, and subcellular distribution of nanoparticles depend on properties of nanoparticles including the size. A size-dependent cell–nanoparticle interaction study was reported for gold, silver, polystyrene, and iron oxide nanoparticles.19,22−24 Maximum nanoparticle uptake was observed for the particles with the size range from 30 to 50 nm in the case of active uptake.19 In the case of passive uptake, polystyrene nanoparticles below 200 nm were observed to enter the cell. Also, gold nanoparticles of size 4–5 nm could enter the RBCs through the passive uptake root.25
Among different nanoparticles, silver and gold nanoparticles are well known and are being used in many applications. Zhang et al. suggested that distribution and toxicity of gold nanoparticles depend on the size of the nanoparticles based on a study conducted on mice.26 The antimicrobial property of silver nanoparticles is due to silver ions and causes inhibition of culture of bacteria such as Escherichia coli.27 Even the antibacterial property of silver nanoparticles was found to be size-dependent28.
In general, the size is not the only factor which decides the toxicity. For example, positively charged nanoparticles are more toxic compared to negative or neutral nanoparticles because the negatively charged membrane can attract positively charged nanoparticles.29−31 Larger nanoparticles have higher ligand to receptor interactions compared to small nanoparticles because they require many nanoparticles to interact with the receptor simultaneously to trigger the membrane wrapping process.32 In contrast, a single large nanoparticle can induce uptake by acting as the cross-linking agent to cluster receptors. Earlier reports on the nanoparticle-induced toxicity with respect to the size of the nanoparticles are mostly using transmission electron microscopy, confocal laser scanning microscopy, and so forth. Different toxicity assessments such as necrosis assay, apoptosis assay, and oxidative stress measurements have been used.19,33−36 In vivo studies include analyzing bio-distribution and clearance, hematology and serum chemistry, histopathology, and so forth.37 Nanotoxicity of metallic nanoparticles on fish RBCs has also been reported.38 Winnik and Maysinger have detailed various mechanisms of quantum dot-induced cytotoxicity, where cadmium-containing quantum dots are able to exert genotoxic, epigenetic, and metalloestrogenic effects. It was also suggested that even minute concentrations of quantum dots may raise transgenerational effects.39
Raman spectroscopy is a widely accepted and highly effective spectroscopic technique, which provides the molecular fingerprints of biological samples in a wide range of applications.40−43 The flow cell-based Raman spectroscopic technique was recently reported in order to tackle the probable photodamage in blood and provides reproducible results from flowed blood lysates with a high signal to noise ratio.44 The study has displayed the ability of detecting very small variations in the hemoglobin oxygenation state because of the aging effect in blood. However, the extension of conventional Raman spectroscopy for RBC studies experience limitations because of the Brownian motion of these micrometer-sized biological cells suspended in liquid media. Conventional physical and chemical cell immobilization techniques can vary the cell environment and adversely impact its functioning. In view of these, the use of optical tweezers which permits live cell manipulation under physiological conditions is escalating in biomedical research community. This technique in combination with Raman spectroscopy can thus enables the users to conduct characterization of live cells without the need of any chemical fixative agents/external stains.
Increasing concerns of potential toxicity on mankind via the use of metallic nanoparticles for diverse applications highlight the necessity of conducting systematic investigations on its detrimental effects. The use of Raman tweezers for investigating the effects of metallic nanoparticles on biological cells remains limited, and moreover, the choice of gold nanoparticles still remains unexplored.45−47 Besides, single-cell Raman characterization in combination with optical trapping have not yet been explored for evaluating size-dependent effects of metallic nanoparticles. The current study investigates the in vitro interaction of both silver and gold nanoparticles of different sizes with human live RBCs. Here, we utilize optical tweezers combined with the micro-Raman spectroscopic tool to evaluate the nanoparticle-induced stress effects on RBCs. RBCs can be treated as a model system to investigate the passive uptake of nanoparticles because RBCs lack endocytosis machinery and different organelles such as nucleus, mitochondria, and so forth. Raman tweezers spectroscopy enables investigation of cell–nanoparticle interaction at the single cell level. Raman spectra were acquired from trapped RBCs post incubation with the nanoparticles. Close investigations of the spectral variations show that nanoparticles can alter intracellular hemoglobin oxygen binding ability to RBCs regardless of their size. The present work demonstrates the capability of Raman tweezers spectroscopy technique for monitoring interactions of live human RBCs with exogenous stress agents.
Materials and Methods
Experimental Setup
Raman tweezers setup with the 785 nm laser (Starbright Diode Laser, Torsana Laser Tech, Denmark) was used for spectral measurements (Figure 1). Both trapping and Raman spectroscopy were carried out using the same laser. The beam expander was used for increasing the beam diameter (nearly 8 mm) so as to overfill the back aperture of the microscope aperture, after which the beam was directed into an inverted microscope (Nikon Eclipse, Ti-U, Japan). A dichroic mirror was used to reflect the 785 nm into a 100× oil immersion microscope objective (MO). The beam was focused into the single cell for trapping. Backscattered light from the trapped particle or cell was directed into the spectrometer (HORIBA Jobin Yvon iHR320 with 1200 grooves/mm grating blazed at 750 nm) via the same MO. Raman signal detection was enabled via liquid nitrogen-cooled CCD (Symphony CCD-1024x256-OPEN-1LS). Polystyrene beads were used for calibrating the sample. For visualizing the sample, a camera was fixed at one of the exit ports of the microscope. A detailed explanation for the instrumentation of the setup can be referred elsewhere.45 Baseline correction of the recorded spectra was performed by means of the asymmetric least squares smoothing method.48,49 The vector normalization method was used for normalizing the spectra.49,50
Figure 1.
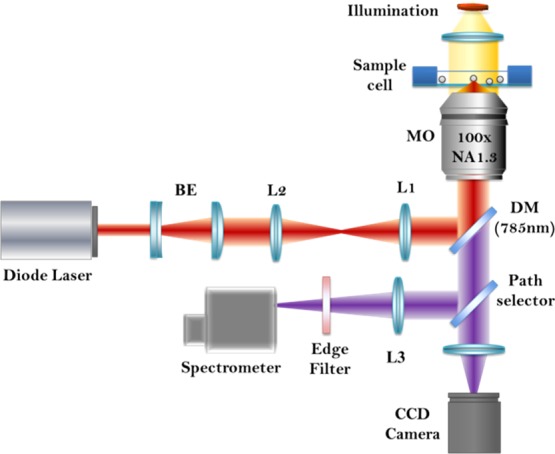
Schematic diagram of Raman tweezers setup.
Sample Preparation
Ethical clearance was obtained from Manipal Institutional Ethics Committee, Kasturba Hospital, to draw blood from healthy volunteers (IEC 294/2013). Informed consent was obtained from the volunteers prior experiments. Blood cells were separated by centrifuging whole blood at 3000 rpm for 5 min. RBCs were taken in a phosphate-buffered saline (PBS) solution in order to obtain a dilute suspension of the live erythrocytes and used for further studies. Both Au and Ag nanoparticles of sizes 10, 30, 50, 80, and 100 nm (Sigma-Aldrich) were used for the present study on RBC–nanoparticle interactions. The characterization was performed on selected nanoparticles to confirm the specifications provided (Supporting Information I—Figure S1) by SigmaAldrich. RBCs were diluted in PBS solution (25 μL in 2 mL) and then treated with 50 μL (0.015 mg) of nanoparticles and incubated in CO2 using an incubator. For the concentration-dependent study, nanoparticles were incubated with varying concentrations such as 25 μL (0.0075 mg), 50 μL (0.015 mg), and 100 μL (0.03 mg) of both Au and Ag nanoparticles. Raman spectroscopic measurements were performed after 24 and 48 h of incubation. Control spectra, that is, RBCs incubated without nanoparticles, were also recorded.
Results and Discussion
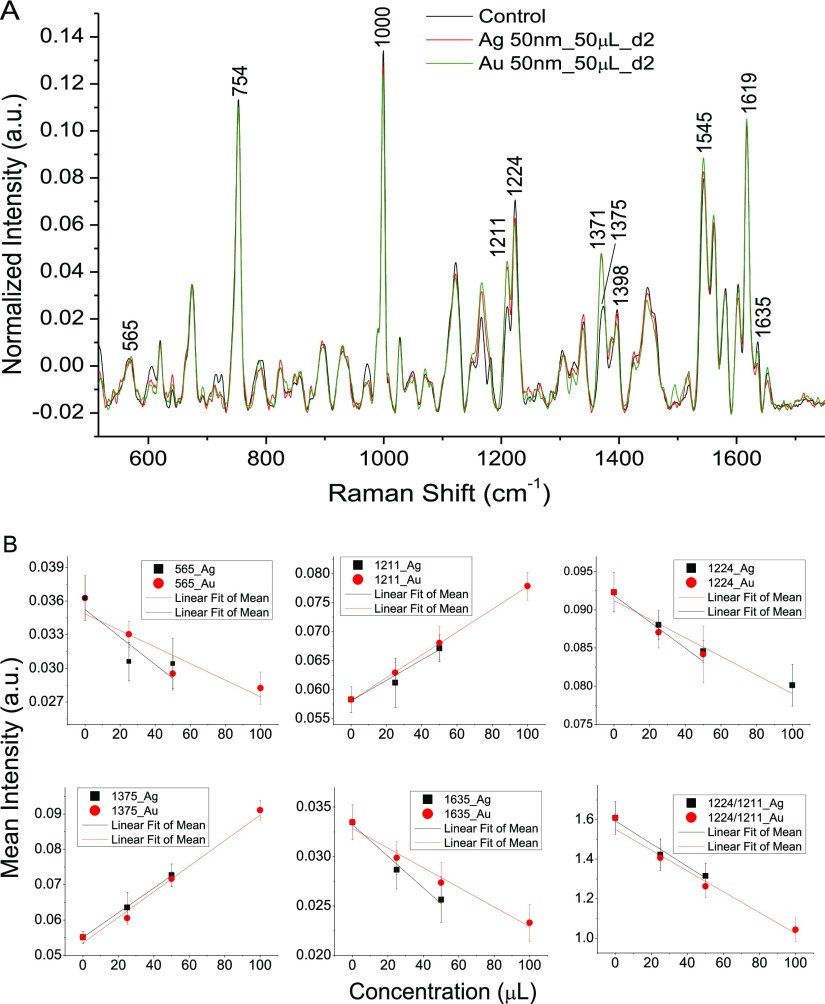
Initially RBCs were treated with varying concentrations of both 50 nm silver and gold nanoparticles in order to examine the concentration-dependent stress effects on RBC. All the spectra were recorded in the region 510–1700 cm–1 with a laser power of ∼10 mW and 4 minutes of acquisition time. We have already carried out experiments to study the laser-induced variation in the Raman spectrum of RBCs for different laser powers in the previous literature. With the current experimental setup used, 10 mW laser power was found to be the safe limit.50Figure 2A shows average Raman spectra of RBCs treated with silver and gold nanoparticles of 50 nm size. Each spectrum is an average of 10 spectra obtained from different RBCs, and only the spectra of RBCs treated with 50 μL (0.015 mg) for 48 h are shown in Figure 2A. Variations were observed for the peaks at 565, 753, 1000, 1375, 1398, 1545, 1619, and 1635 cm–1. The spectral variations obtained for certain bands (565, 1211, 1224, 1375, and 1635 cm–1) after nanoparticle incubation (48 h) in a dose-dependent manner are plotted in Figure 2B. Raman band assignments for the peaks showing changes are listed in Table 1. The decrease in the RBC oxyhemoglobin status with a higher nanoparticle concentration is evident from the ratio of deoxy/oxy marker bands (1224–1211 cm–1) plotted in Figure 2B. An increase in 1211 cm–1 accompanied by a decline in 1224 cm–1 is observed in the presence of nanoparticles, which indicates the modification of oxygenated hemoglobin to the deoxygenated state inside the cell. These peaks attributed to methine C–H deformation in heme are considered as the crucial marker bands for evaluation of the hemoglobin oxygenation status inside RBCs.51 These peaks are highly sensitive to any conformational modifications occurring in RBC hemoglobin. The oxy–deoxy transition is also evident from the decrease in oxygenation marker 1635 cm–1. As expected, Raman spectral variations were maximum for a higher concentration of nanoparticles, and a linear relationship was also obtained between the nanoparticle concentration and intensity of few Raman bands. Also, very little spectral changes were observed after 24 h of incubation. RBCs treated with 100 μL of silver nanoparticles were ruptured after 48 h of incubation. Hence, the Raman spectroscopy study could not be conducted. Further experiments were performed with 50 μL of nanoparticles.
Figure 2.
(A) Raman spectra of normal RBCs and RBCs treated with silver and gold nanoparticles of size 50 nm. (B) Intensity of the Raman bands (565, 1211, 1224, 1375, 1635 cm–1, and the ratio of 1224–1211 cm–1) plotted vs the concentration of nanoparticles.
Table 1. Raman Band Assignment for the RBC Peaks Showing Changes after Incubating with Nanoparticlesa52−55.
| Raman frequency band (cm–1) | peak assignment |
|---|---|
| 565 | ν(Fe–O2) |
| 663 | P: C–S str., polypeptide |
| 674 | ν7, P: C–S vibrations |
| 753 | ν15, γ1, Trp., L: O–P–O sym. str. |
| 970 | γ(CaH), phospholipid |
| 1166 | ν30, P: NH3+, L: CH2 wag, C–O–C antisym. str. |
| 1211 | ν5+, ν18, Tyr, Phe |
| 1224 | ν13 or ν42 |
| 1245 | amide III, phospholipid |
| 1265 | L: ν(P=O) |
| 1375 | ν4, x |
| 1545 | ν11, polypeptide |
| 1561 | ν38, Trp |
| 1619 | ν10, ν(C= =C)venyl, Tyr., Phe. |
| 1635 | ν10, P: amide I |
L: Lipid; P: protein; Trp: Tryptophan; Phe: Phenylalanine; Tyr: Tyrosine; sym: symmetric; antisym: antisymmetric; str: stretch; ν and δ: In-plane modes; γ: Out-of-plane modes.
Effect of Silver Nanoparticles of Different Sizes on RBCs
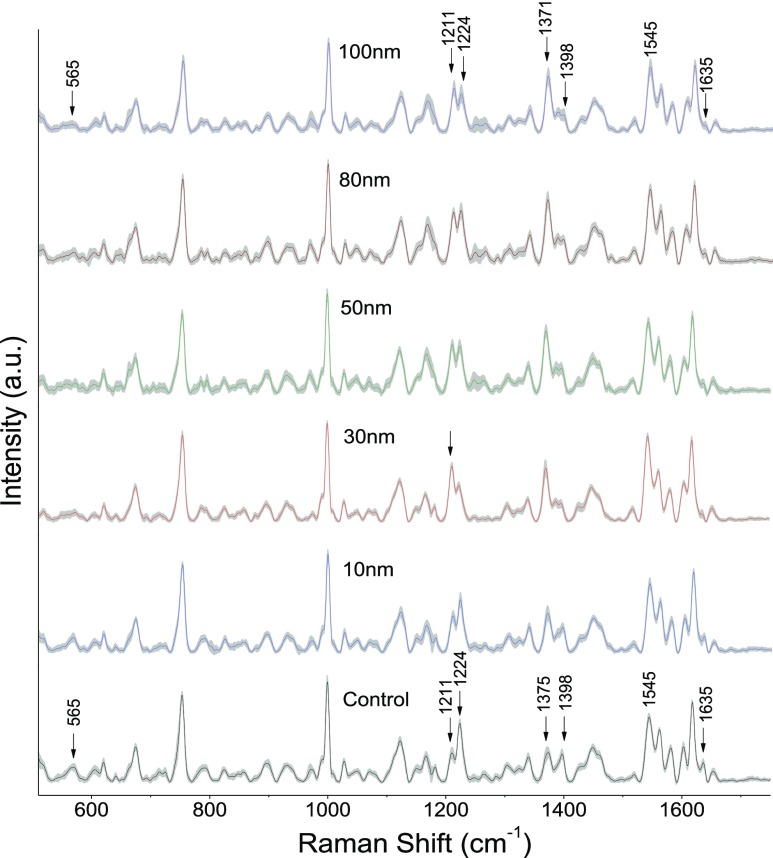
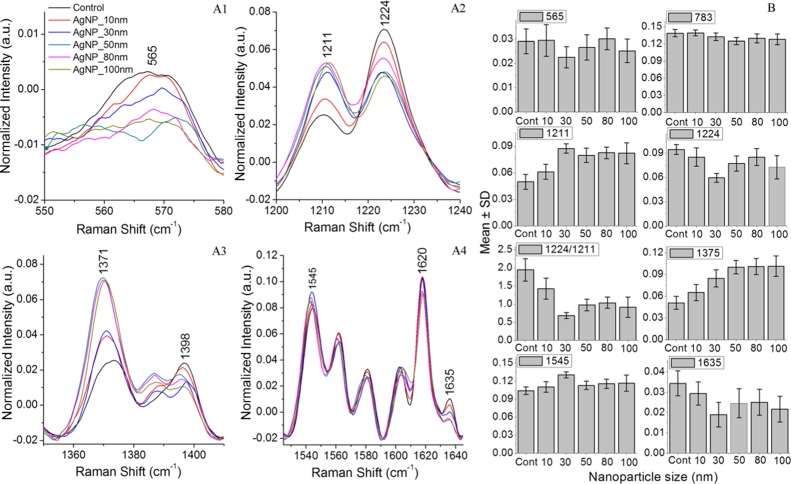
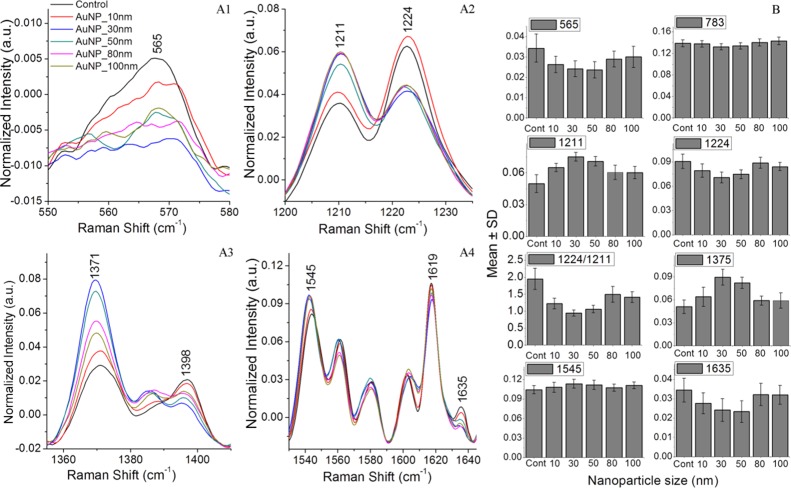
Experiments to evaluate the AgNP size-dependent stress impact on RBCs were carried out using silver nanoparticles of average sizes in the range of 10–100 nm. Figure 3 shows the average spectra of control RBCs and RBCs treated with silver nanoparticles. The shaded region shows the standard deviation from the mean. Each spectrum is the average of 25 Raman spectra from different RBCs recorded after 48 h of incubation in nanoparticles. As evident from Figure 3, variations in the intensity of Raman bands at 565, 753, 1224, 1375, 1398, and 1635 cm–1 were observed. The intensity decline observed in both the Fe–O2 stretch at 565 cm–1 and the oxygen concentration marker band at 1635 cm–1 clearly indicates the adverse effects of nanoparticles on hemoglobin oxygen ligation. Besides, deoxygenated hemoglobin formation is also validated from the intensity enhancement of peaks present at 1211 and 1545 cm–1. Comparison of the major spectral variations is shown in Figure 4A1–A4. Figure 4B represents the mean intensity value of particular peaks obtained for different sizes of silver nanoparticles compared to control RBCs. Each value represents mean value ± standard deviation for 25 Raman spectra recorded from different RBCs. Raman spectral changes at 565, 1635, 1211, and 1224 cm–1 were more prominent in 30 nm silver nanoparticle-treated RBCs, whereas RBCs treated with 50, 80, and 100 nm nanoparticles displayed a maximum variation for the pyrrole band present at 1375 cm–1.
Figure 3.
Average Raman spectra (shown with standard deviation) from normal RBCs and RBCs treated with silver nanoparticles of average sizes 10, 30, 50, 80, and 100 nm.
Figure 4.
(A1–A4)—Average Raman spectra from normal RBCs and RBCs treated with silver nanoparticles of average sizes 10, 30, 50, 80, and 100 nm shown in the region where maximum spectral variations are observed. (B)—Mean value for different peaks is plotted for control RBCs and RBCs treated with silver nanoparticles.
Effect of Gold Nanoparticles of Different Sizes on RBCs
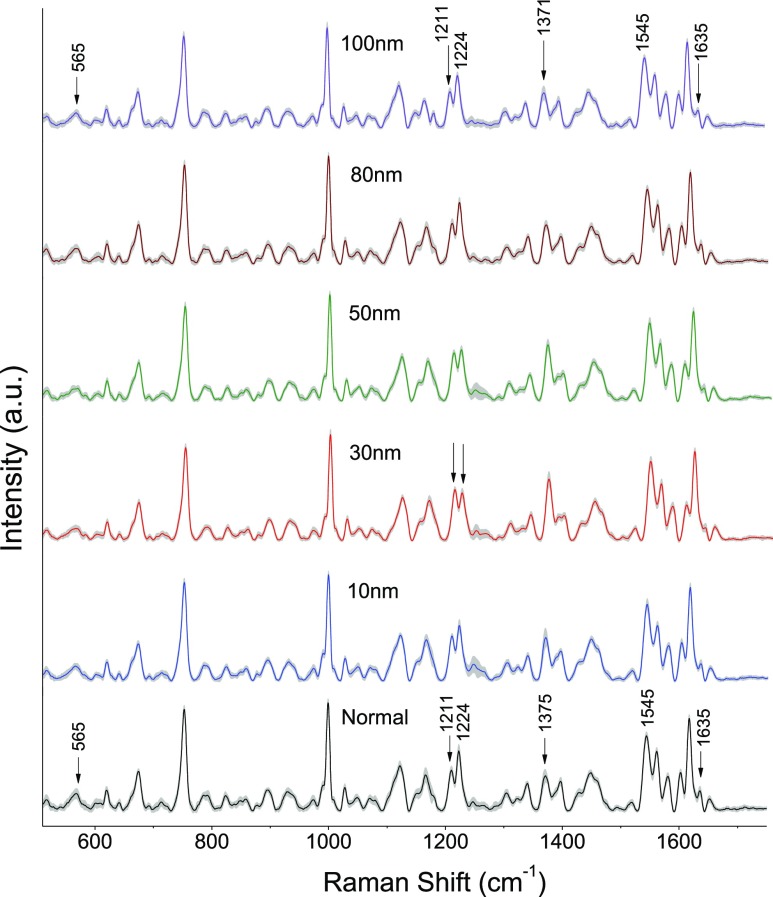
The experiment was also repeated with gold nanoparticles of sizes 10, 30, 50, 80, and 100 nm. The average spectra of control RBCs and RBCs treated with different gold nanoparticles are shown in Figure 5. Each Raman spectrum is an average of 25 spectra from different RBCs recorded after 48 h of incubation. The peaks displaying notable changes are shown in Figure 6A1–A4. Hemoglobin oxygenation marker bands present at 565, 1211, 1375, 1398, and 1635 cm–1 showed an intensity variation upon nanoparticle treatment. The mean value obtained for the abovementioned bands in the spectra for nanoparticles of different sizes is given in Figure 6B, in order to clearly distinguish the spectral variations. Maximum intensity changes were observed in the Raman spectra of RBCs treated with 30 nm, whereas 10 nm nanoparticle-treated RBCs have shown minimum spectral variations.
Figure 5.
Mean Raman spectra (shown with standard deviation) from normal RBCs and RBCs treated with gold nanoparticles of sizes 10, 30, 50, 80, and 100 nm. All the spectra were recorded with 4 min of acquisition time and 10 mW laser power.
Figure 6.
(A1–A4)—Mean Raman spectra from normal RBCs and RBCs treated with gold nanoparticles of average sizes 10, 30, 50, 80, and 100 nm shown in the region where maximum spectral variations are observed. (B)—Mean value of various peaks is plotted for control RBCs and RBCs treated with gold nanoparticles.
Comparison of Stress Effects due To Silver and Gold Nanoparticles
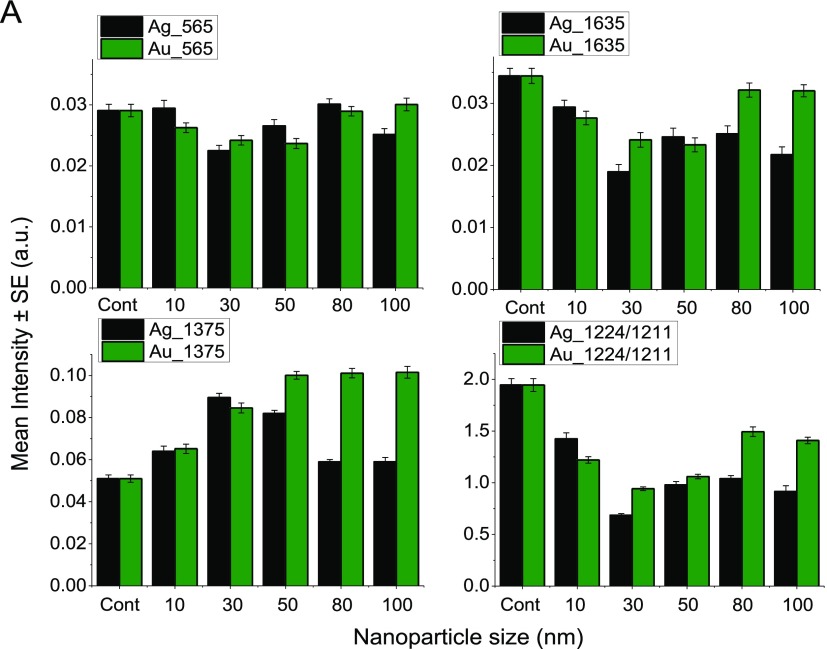
A comparative analysis of the size-dependent effect of silver and gold nanoparticles of different sizes on RBCs has been performed. The mean value of Raman peaks at 565, 1375, and 1635 cm–1 obtained for the control and both AgNP- and AuNP-treated RBCs is shown in Figure 7A. Because the peaks at 753 and 1545 cm–1 were showing negligible variations, they were excluded in this plot. Also shown in the figure is the ratio of 1224–1211 cm–1 because an increase in the intensity of 1211 cm–1 is observed with a concomitant decrease in the intensity of the peak at 1224 cm–1. Silver nanoparticle-treated RBCs showed more prominent changes except for the 1375 cm–1 peak. The concentration of the nanoparticles was kept constant at 50 μL (0.015 mg/mL) in the case of all the abovementioned experiments. Silver nanoparticle-treated RBCs displayed higher spectral variations compared to gold nanoparticle-treated RBCs. Besides, the spectral variations were dominant in ∼30 nm size nanoparticles. It is evident from the figure that silver nanoparticles can be more harmful than gold in influencing the hemoglobin oxygen binding affinity of RBCs.
Figure 7.
(A) Mean value of the intensity of different peaks from Raman spectra of RBCs recorded after treating with silver and gold nanoparticles of varying sizes.
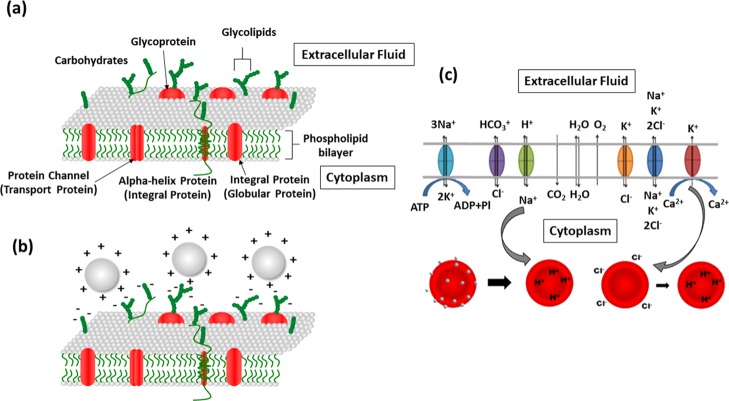
There are different explanations for cell–nanoparticle interactions and possible toxicity on the cells. Cell–nanoparticle interactions can be primarily assessed through two different scenarios. One of the probable mechanisms is the adhesion of the nanoparticle on the cell membrane.47 The RBC membrane has a lipid bilayer which has proteins and glycoproteins embedded in it. These sialic acid-rich glycoproteins are negatively charged and are responsible for the electronegativity of the RBC membrane.56 This nature of the RBC membrane makes them electrostatically attract positively charged nanoparticles. The positively charged or neutral nanoparticles tend to be adsorbed on the cell membrane.57 The cell membrane is responsible for many functions including exchange of gas molecules such as O2 and CO2 and small molecules such as urea and water.58 Passive transport facilitates exchange of ions and polar molecules via integral membrane proteins. Obstruction in these channels due to nanoparticle adherence may lead to impairment of cell membrane properties, pH imbalances, and so forth.47 Blockade in the Na+/H+ channels which is responsible for removing H+ and maintaining pH inside the cells can result in the decrease in the pH of the RBC cytoplasm (known as the Bohr effect).59 This can finally affect the oxygen binding affinity of hemoglobin and hence results in the conversion of hemoglobin from the oxygenated state to the deoxygenated state.47 The adverse trends observed in the case of nanoparticle-treated cells points out that the mechanism involved in RBC damage may be due to the adherence of nanoparticles on the cell membrane.
The probability of reactive oxygen species (ROS) production which can harm cells by lipid peroxidation cannot be ruled out in the case of cell–nanoparticle interactions.60 This mechanism can induce damage on proteins and other biomolecules.61,62 Thiol values are measured in order to verify the possibility of oxidative stress in the presence of nanoparticles. Notable changes observed in thiol values (Supporting Information III—Figure S2) point out the oxidative stress generation in the case of RBCs treated with nanoparticles. Higher Raman spectral variations observed in AgNP-treated RBCs as compared to gold-treated RBCs can be thus linked to its reduced thiol content. The reduced thiol content observed in the case of silver nanoparticles indicates the higher oxidative stress induced by them on RBCs. Oxidative stress can stimulate Ca2+ pump of the plasma membrane and trigger Ca2+-sensitive K+ channels. This can lead to hyperpolarization of the RBC membrane and causes Cl– loss. In this case, the cell tries to maintain the ratio [Cl]o/[Cl]i in order to equalize the [H+]i/[H+]o ratio. Thus, the cell becomes progressively acidified and obviously results in the conversion of oxygenated to deoxygenated hemoglobin. On the whole, both the above-mentioned mechanisms can pave way for the oxy–deoxy transition of hemoglobin in RBCs. The RBC membrane structure depicted in Figure 8a–c shows the above proposed mechanisms involved in nanoparticle-induced stress effects on RBCs.
Figure 8.
(a) Schematic diagram depicting the RBC membrane structure. (b) Positively charged nanoparticles can get attracted to the negatively charged cell membrane. (c) Mechanism of metal nanoparticle toxicity on erythrocytes (because of nanoparticle adhesion on cell membrane and oxidative stress triggering K+ channels).
Raman experiments were also performed to verify the heating effect on RBCs in the presence of laser nanoparticle interaction. A series of three spectra were recorded continuously from three sets of samples—control RBCs, RBCs with AgNP, and RBCs with AuNP. The heating effect on RBCs was evaluated by monitoring the peak intensities of 663 and 1245 cm–1 vibrational frequencies which is regarded as heme-aggregation markers. As evident from the Supporting Information Figure S3, much difference in spectra was not observed for nanoparticle-treated cells as compared to control cells. Also, the wavelength of the probe laser does not coincide with the absorption wavelength of the treated nanoparticles (Supporting Information I—Figure S1). From these results, it can be concluded that the entire spectral changes in the presence of nanoparticles are not associated with the heat effect. This will also substantiate the above described two mechanisms: (a) nanoparticle adherence on the cell membrane and (b) oxidative stress generation in silver and gold nanoparticle-treated RBCs. Particularly in the case of erythrocytes which lack endocytosis mechanism, the nanoparticle stress effects is because of membrane–nanoparticle interaction or ROS. Because of ROS, the silver nanoparticles can induce maximum perturbation in blood cells. Thus, the Raman tweezers study of silver and gold nanoparticles of different sizes and their interaction with RBCs show higher stress effects for the larger nanoparticles studied here.
Conclusions
Nanoparticle-induced stress on RBCs has been studied using the Raman tweezers spectroscopy technique for different sizes of gold and silver nanoparticles. RBC–nanoparticle interaction has altogether adversely influenced the oxygen binding ability of hemoglobin, which is evident from the enhancement in deoxygenated hemoglobin markers accompanied with a reduction in the oxyhemoglobin markers. Apart from this, the silver nanoparticles have a comparatively higher adverse effect on RBCs than gold nanoparticles. The oxidative stress induced by silver nanoparticles prompts greater changes in the cell and hence higher spectral variations. As the nanoparticle interaction with RBCs leads to changes in the hemoglobin structures which can be traced by Raman spectroscopy, the technique can be used for assessing adverse effects induced by metallic nanoparticles. Our study corroborates the two mechanisms involved in metal nanoparticle-induced hemoglobin deoxygenation on RBCs—adherence of nanoparticles on the RBC membrane and oxidative stress generation. Any information regarding various sized nanoparticle-induced stress effects on blood components is crucial and valuable in the selection of nanoparticles of specific size in biomedical applications. This study also raises the possibility of health issues during the exposure of metallic nanoparticles to the human system.
Acknowledgments
Authors are thankful to the Department of Biotechnology (DBT) of the Government of India for the Raman tweezers facility under the grant BT/PR6413/MED/14/802/2005, and S.B. is thankful to the Manipal Academy of Higher Education for the Dr. TMA Pai fellowship for Ph.D. Program and SPIE (International Society for Optics and Photonics) for an SPIE education scholarship. S.C. is thankful for financial support from the DST-FIST programme for other laboratory facilities used in this study. Authors are grateful to Anupama, Dr. Nalini, and Dr. Krishnananda Prabhu, Department of Biochemistry, KMC, for their help in conducting experiments related to oxidative stress measurements.
Supporting Information Available
The Supporting Information is available free of charge at https://pubs.acs.org/doi/10.1021/acsomega.9b02988.
Nanoparticle characterization, oxidative stress measurements, and possibilities of heating due to irradiation of nanoparticles with laser (PDF)
The authors declare no competing financial interest.
Supplementary Material
References
- Brigger I.; Dubernet C.; Couvreur P. Nanoparticles in cancer therapy and diagnosis. Adv. Drug Delivery Rev. 2002, 54, 631–651. 10.1016/s0169-409x(02)00044-3. [DOI] [PubMed] [Google Scholar]
- Liu Y.; Miyoshi H.; Nakamura M. Nanomedicine for drug delivery and imaging: a promising avenue for cancer therapy and diagnosis using targeted functional nanoparticles. Int. J. Cancer 2007, 120, 2527–2537. 10.1002/ijc.22709. [DOI] [PubMed] [Google Scholar]
- Gu F. X.; Karnik R.; Wang A. Z.; Alexis F.; Levy-Nissenbaum E.; Hong S.; Langer R. S.; Farokhzad O. C. Targeted nanoparticles for cancer therapy. Nano today 2007, 2, 14–21. 10.1016/s1748-0132(07)70083-x. [DOI] [Google Scholar]
- Cho K.; Wang X.; Nie S.; Chen Z.; Shin D. M. Therapeutic nanoparticles for drug delivery in cancer. Clin. Cancer Res. 2008, 14, 1310–1316. 10.1158/1078-0432.ccr-07-1441. [DOI] [PubMed] [Google Scholar]
- Soppimath K. S.; Aminabhavi T. M.; Kulkarni A. R.; Rudzinski W. E. Biodegradable polymeric nanoparticles as drug delivery devices. J. Controlled Release 2001, 70, 1–20. 10.1016/s0168-3659(00)00339-4. [DOI] [PubMed] [Google Scholar]
- Ghosh P.; Han G.; De M.; Kim C.; Rotello V. Gold nanoparticles in delivery applications. Adv. Drug Delivery Rev. 2008, 60, 1307–1315. 10.1016/j.addr.2008.03.016. [DOI] [PubMed] [Google Scholar]
- Lismont M.; Dreesen L. Comparative study of Ag and Au nanoparticles biosensors based on surface plasmon resonance phenomenon. Mater. Sci. Eng. C 2012, 32, 1437–1442. 10.1016/j.msec.2012.04.023. [DOI] [PubMed] [Google Scholar]
- Liu J.; Lu Y. A colorimetric lead biosensor using DNAzyme-directed assembly of gold nanoparticles. J. Am. Chem. Soc. 2003, 125, 6642–6643. 10.1021/ja034775u. [DOI] [PubMed] [Google Scholar]
- Luo X.; Morrin A.; Killard A. J.; Smyth M. R. Application of nanoparticles in electrochemical sensors and biosensors. Electroanalysis 2006, 18, 319–326. 10.1002/elan.200503415. [DOI] [Google Scholar]
- Pingarrón J. M.; Yáñez-Sedeño P.; González-Cortés A. Gold nanoparticle-based electrochemical biosensors. Electrochim. Acta 2008, 53, 5848–5866. 10.1016/j.electacta.2008.03.005. [DOI] [Google Scholar]
- Ram P.; Vivek K.; Kumar S. P. Nanotechnology in sustainable agriculture: present concerns and future aspects. Afr. J. Biotechnol. 2014, 13, 705–713. 10.5897/ajbx2013.13554. [DOI] [Google Scholar]
- Vogt A.; Combadiere B.; Hadam S.; Stieler K. M.; Lademann J.; Schaefer H.; Autran B.; Sterry W.; Blume-Peytavi U. 40nm, but not 750 or 1,500 nm, nanoparticles enter epidermal CD1a+ cells after transcutaneous application on human skin. J. Invest. Dermatol. 2006, 126, 1316–1322. 10.1038/sj.jid.5700226. [DOI] [PubMed] [Google Scholar]
- Smijs T. G. M.; Bouwstra J. A. Focus on skin as a possible port of entry for solid nanoparticles and the toxicological impact. J. Biomed. Nanotechnol. 2010, 6, 469–484. 10.1166/jbn.2010.1146. [DOI] [PubMed] [Google Scholar]
- Medina C.; Santos-Martinez M.; Radomski A.; Corrigan O.; Radomski M. Nanoparticles: pharmacological and toxicological significance. Br. J. Pharmacol. 2009, 150, 552–558. 10.1038/sj.bjp.0707130. [DOI] [PMC free article] [PubMed] [Google Scholar]
- Monopoli M. P.; Åberg C.; Salvati A.; Dawson K. A. Biomolecular coronas provide the biological identity of nanosized materials. Nat. Nanotechnol. 2012, 7, 779–786. 10.1038/nnano.2012.207. [DOI] [PubMed] [Google Scholar]
- Lynch I.; Dawson K. A. Protein-nanoparticle interactions. Nano today 2008, 3, 40–47. 10.1016/s1748-0132(08)70014-8. [DOI] [Google Scholar]
- Bartczak D.; Muskens O. L.; Nitti S.; Sanchez-Elsner T.; Millar T. M.; Kanaras A. G. Interactions of Human Endothelial Cells with Gold Nanoparticles of Different Morphologies. Small 2012, 8, 122–130. 10.1002/smll.201101422. [DOI] [PubMed] [Google Scholar]
- Verma A.; Uzun O.; Hu Y.; Hu Y.; Han H.-S.; Watson N.; Chen S.; Irvine D. J.; Stellacci F. Surface-structure-regulated cell-membrane penetration by monolayer-protected nanoparticles. Nat. Mater. 2008, 7, 588–595. 10.1038/nmat2202. [DOI] [PMC free article] [PubMed] [Google Scholar]
- Shang L.; Nienhaus K.; Nienhaus G. U. Engineered nanoparticles interacting with cells: size matters. J. Nanobiotechnol. 2014, 12, 5. 10.1186/1477-3155-12-5. [DOI] [PMC free article] [PubMed] [Google Scholar]
- Bocca C.; Caputo O.; Cavalli R.; Gabriel L.; Miglietta A.; Gasco M. R. Phagocytic uptake of fluorescent stealth and non-stealth solid lipid nanoparticles. Int. J. Pharm. 1998, 175, 185–193. 10.1016/s0378-5173(98)00282-8. [DOI] [Google Scholar]
- Wang T.; Bai J.; Jiang X.; Nienhaus G. U. Cellular uptake of nanoparticles by membrane penetration: a study combining confocal microscopy with FTIR spectroelectrochemistry. ACS Nano 2012, 6, 1251–1259. 10.1021/nn203892h. [DOI] [PubMed] [Google Scholar]
- Pan Y.; Neuss S.; Leifert A.; Fischler M.; Wen F.; Simon U.; Schmid G.; Brandau W.; Jahnen-Dechent W. Size-dependent cytotoxicity of gold nanoparticles. Small 2007, 3, 1941–1949. 10.1002/smll.200700378. [DOI] [PubMed] [Google Scholar]
- Kim T.-H.; Kim M.; Park H.-S.; Shin U. S.; Gong M.-S.; Kim H.-W. Size-dependent cellular toxicity of silver nanoparticles. J. Biomed. Mater. Res., Part A 2012, 100, 1033–1043. 10.1002/jbm.a.34053. [DOI] [PubMed] [Google Scholar]
- Brown D. M.; Wilson M. R.; MacNee W.; Stone V.; Donaldson K. Size-dependent proinflammatory effects of ultrafine polystyrene particles: a role for surface area and oxidative stress in the enhanced activity of ultrafines. Toxicol. Appl. Pharmacol. 2001, 175, 191–199. 10.1006/taap.2001.9240. [DOI] [PubMed] [Google Scholar]
- Verma A.; Uzun O.; Hu Y.; Hu Y.; Han H.-S.; Watson N.; Chen S.; Irvine D. J.; Stellacci F. Surface structure-regulated cell membrane penetration by monolayer protected nanoparticles. Nat. Mater. 2008, 7, 588. 10.1038/nmat2202. [DOI] [PMC free article] [PubMed] [Google Scholar]
- Zhang X.-D.; Wu D.; Shen X.; Liu P.-X.; Yang N.; Zhao B.; Zhang H.; Sun Y.-M.; Zhang L.-A.; Fan F.-Y. Size-dependent in vivo toxicity of PEG-coated gold nanoparticles. Int. J. Nanomed. 2011, 6, 2071–2081. 10.2147/ijn.s21657. [DOI] [PMC free article] [PubMed] [Google Scholar]
- Sondi I.; Salopek-Sondi B. Silver nanoparticles as antimicrobial agent: a case study on E. coli as a model for Gram-negative bacteria. J. Colloid Interface Sci. 2004, 275, 177–182. 10.1016/j.jcis.2004.02.012. [DOI] [PubMed] [Google Scholar]
- Martínez-Castañón G. A.; Niño-Martínez N.; Martínez-Gutierrez F.; Martínez-Mendoza J. R.; Ruiz F. Synthesis and antibacterial activity of silver nanoparticles with different sizes. J. Nanopart. Res. 2008, 10, 1343–1348. 10.1007/s11051-008-9428-6. [DOI] [Google Scholar]
- Goodman C. M.; McCusker C. D.; Yilmaz T.; Rotello V. M. Toxicity of gold nanoparticles functionalized with cationic and anionic side chains. Bioconjugate Chem. 2004, 15, 897–900. 10.1021/bc049951i. [DOI] [PubMed] [Google Scholar]
- Badawy A. M. E.; Silva R. G.; Morris B.; Scheckel K. G.; Suidan M. T.; Tolaymat T. M. Surface charge-dependent toxicity of silver nanoparticles. Environ. Sci. Technol. 2011, 45, 283–287. 10.1021/es1034188. [DOI] [PubMed] [Google Scholar]
- Hühn D.; Kantner K.; Geidel C.; Brandholt S.; De C. I.; Soenen S. J.; Rivera G. P.; Montenegro J.-M.; Braeckmans K.; Mullen K. Polymer-coated nanoparticles interacting with proteins and cells: focusing on the sign of the net charge. ACS Nano 2013, 7, 3253–3263. 10.1021/nn3059295. [DOI] [PubMed] [Google Scholar]
- Vertegel A. A.; Siegel R. W.; Dordick J. S. Silica nanoparticle size influences the structure and enzymatic activity of adsorbed lysozyme. Langmuir 2004, 20, 6800–6807. 10.1021/la0497200. [DOI] [PubMed] [Google Scholar]
- Rothen-Rutishauser B. M.; Schürch S.; Haenni B.; Kapp N.; Gehr P. Interaction of fine particles and nanoparticles with red blood cells visualized with advanced microscopic techniques. Environ. Sci. Technol. 2006, 40, 4353–4359. 10.1021/es0522635. [DOI] [PubMed] [Google Scholar]
- Vranic S.; Boggetto N.; Contremoulins V.; Mornet S.; Reinhardt N.; Marano F.; Baeza-Squiban A.; Boland S. Deciphering the mechanisms of cellular uptake of engineered nanoparticles by accurate evaluation of internalization using imaging flow cytometry. Part. Fibre Toxicol. 2013, 10, 2. 10.1186/1743-8977-10-2. [DOI] [PMC free article] [PubMed] [Google Scholar]
- Huang K.; Ma H.; Liu J.; Huo S.; Kumar A.; Wei T.; Zhang X.; Jin S.; Gan Y.; Wang P. C.; He S.; Zhang X.; Liang X.-J. Size-dependent localization and penetration of ultrasmall gold nanoparticles in cancer cells, multicellular spheroids, and tumors in vivo. ACS Nano 2012, 6, 4483–4493. 10.1021/nn301282m. [DOI] [PMC free article] [PubMed] [Google Scholar]
- Lewinski N.; Colvin V.; Drezek R. Cytotoxicity of Nanoparticles. Small 2008, 4, 26–49. 10.1002/smll.200700595. [DOI] [PubMed] [Google Scholar]
- Marquis B. J.; Love S. A.; Braun K. L.; Haynes C. L. Analytical methods to assess nanoparticle toxicity. Analyst 2009, 134, 425–439. 10.1039/b818082b. [DOI] [PubMed] [Google Scholar]
- Chen L. Q.; Fang L.; Ling J.; Ding C. Z.; Kang B.; Huang C. Z. Nanotoxicity of silver nanoparticles to red blood cells: size dependent adsorption, uptake, and hemolytic activity. Chem. Res. Toxicol. 2015, 28, 501–509. 10.1021/tx500479m. [DOI] [PubMed] [Google Scholar]
- Winnik F. M.; Maysinger D. Quantum Dot Cytotoxicity and Ways To Reduce It. Acc. Chem. Res. 2013, 46, 672. 10.1021/ar3000585. [DOI] [PubMed] [Google Scholar]
- Eberhardt K.; Stiebing C.; Matthäus C.; Schmitt M.; Popp J. Advantages and limitations of Raman spectroscopy for molecular diagnostics: an update. Expert Rev. Mol. Diagn. 2015, 15, 773–787. 10.1586/14737159.2015.1036744. [DOI] [PubMed] [Google Scholar]
- Krafft C.; Steiner G.; Beleites C.; Salzer R. Disease recognition by infrared and Raman spectroscopy. J. Biophotonics 2009, 2, 13–28. 10.1002/jbio.200810024. [DOI] [PubMed] [Google Scholar]
- Neugebauer U.; Clement J. H.; Bocklitz T.; Krafft C.; Popp J. Identification and differentiation of single cells from peripheral blood by Raman spectroscopic imaging. J. Biophotonics 2010, 3, 579–587. 10.1002/jbio.201000020. [DOI] [PubMed] [Google Scholar]
- Chan J. W. Recent advances in laser tweezers Raman spectroscopy (LTRS) for label-free analysis of single cells. J. Biophotonics 2013, 6, 36–48. 10.1002/jbio.201200143. [DOI] [PubMed] [Google Scholar]
- Hansson B.; Allen C. H.; Qutob S.; Behr B.; Nyiri B.; Chauhan V.; Murugkar S. Development of a flow cell based Raman spectroscopy technique to overcome photodegradation in human blood. Biomed. Opt. Express 2019, 10, 2275–2288. 10.1364/boe.10.002275. [DOI] [PMC free article] [PubMed] [Google Scholar]
- Bankapur A.; Krishnamurthy R. S.; Zachariah E.; Santhosh C.; Chougule B.; Praveen B.; Valiathan M.; Mathur D. Micro-Raman spectroscopy of silver nanoparticle induced stress on optically-trapped stem cells. PLoS One 2012, 7, e35075 10.1371/journal.pone.0035075. [DOI] [PMC free article] [PubMed] [Google Scholar]
- Wang F.; Gao F.; Lan M.; Yuan H.; Huang Y.; Liu J. Oxidative stress contributes to silica nanoparticle-induced cytotoxicity in human embryonic kidney cells. Toxicol. In Vitro 2009, 23, 808–815. 10.1016/j.tiv.2009.04.009. [DOI] [PubMed] [Google Scholar]
- Bankapur A.; Barkur S.; Chidangil S.; Mathur D. A Micro-Raman Study of Live, Single Red Blood Cells (RBCs) Treated with AgNO3 Nanoparticles. PLoS One 2014, 9, e103493 10.1371/journal.pone.0103493. [DOI] [PMC free article] [PubMed] [Google Scholar]
- Eilers P. H.; Boelens H. F.. Baseline Correction with Asymmetric Least Squares Smoothing. Leiden University Medical Centre Report; Leiden University Medical Centre, 2005.
- Barkur S.; Bankapur A.; Pradhan M.; Chidangil S.; Mathur D.; Ladiwala U. Probing differentiation in cancer cell lines by single-cell micro-Raman spectroscopy. J. Biomed. Opt. 2015, 20, 085001. 10.1117/1.jbo.20.8.085001. [DOI] [PubMed] [Google Scholar]
- Barkur S.; Bankapur A.; Chidangil S.; Mathur D. Effect of infrared light on live blood cells: Role of β-carotene. J. Photochem. Photobiol., B 2017, 171, 104–116. 10.1016/j.jphotobiol.2017.04.034. [DOI] [PubMed] [Google Scholar]
- Atkins C. G.; Schulze H. G.; Chen D.; Devine D. V.; Blades M. W.; Turner R. F. B. Using Raman spectroscopy to assess hemoglobin oxygenation in red blood cell concentrate: an objective proxy for morphological index to gauge the quality of stored blood?. Analyst 2017, 142, 2199–2210. 10.1039/c7an00349h. [DOI] [PubMed] [Google Scholar]
- Bankapur A.; Zachariah E.; Chidangil S.; Valiathan M.; Mathur D. Raman tweezers spectroscopy of live, single red and white blood cells. PLoS One 2010, 5, e10427 10.1371/journal.pone.0010427. [DOI] [PMC free article] [PubMed] [Google Scholar]
- Parker F. S.Applications of Infrared, Raman, and Resonance Raman Spectroscopy in Biochemistry; Springer Science & Business Media, 1983. [Google Scholar]
- Wood B. R.; Caspers P.; Puppels G. J.; Pandiancherri S.; McNaughton D. Resonance Raman spectroscopy of red blood cells using near-infrared laser excitation. Anal. Bioanal. Chem. 2007, 387, 1691–1703. 10.1007/s00216-006-0881-8. [DOI] [PubMed] [Google Scholar]
- Hu S.; Smith K. M.; Spiro T. G. Assignment of protoheme resonance Raman spectrum by heme labeling in myoglobin. J. Am. Chem. Soc. 1996, 118, 12638–12646. 10.1021/ja962239e. [DOI] [Google Scholar]
- Durocher J. R.; Payne R. C.; Conrad M. E. Role of sialic acid in erythrocyte survival. Blood 1975, 45, 11–20. 10.1182/blood.v45.1.11.11. [DOI] [PubMed] [Google Scholar]
- Zhang Y.; Yang M.; Portney N. G.; Cui D.; Budak G.; Ozbay E.; Ozkan M.; Ozkan C. S. Zeta potential: a surface electrical characteristic to probe the interaction of na.noparticles with normal and cancer human breast epithelial cells. Biomed. Microdevices 2008, 10, 321–328. 10.1007/s10544-007-9139-2. [DOI] [PubMed] [Google Scholar]
- Horton H. R.; Moran L. A.; Ochs R. S.; Rawn J. D.; Scrimgeour K. G.. Principles of biochemistry; Prentice Hall Upper: Saddle River, NY, 1996. [Google Scholar]
- Orlowski J.; Grinstein S. Na+/H+ exchangers of mammalian cells. J. Biol. Chem. 1997, 272, 22373–22376. 10.1074/jbc.272.36.22373. [DOI] [PubMed] [Google Scholar]
- Foldbjerg R.; Olesen P.; Hougaard M.; Dang D. A.; Hoffmann H. J.; Autrup H. PVP-coated silver nanoparticles and silver ions induce reactive oxygen species, apoptosis and necrosis in THP-1 monocytes. Toxicol. Lett. 2009, 190, 156–162. 10.1016/j.toxlet.2009.07.009. [DOI] [PubMed] [Google Scholar]
- Nel A.; Xia T.; Mädler L.; Li N. Toxic potential of materials at the nanolevel. Science 2006, 311, 622–627. 10.1126/science.1114397. [DOI] [PubMed] [Google Scholar]
- Yu K.-N.; Yoon T.-J.; Minai-Tehrani A.; Kim J.-E.; Park S. J.; Jeong M. S.; Ha S.-W.; Lee J.-K.; Kim J. S.; Cho M.-H. Zinc oxide nanoparticle induced autophagic cell death and mitochondrial damage via reactive oxygen species generation. Toxicol. In Vitro 2013, 27, 1187–1195. 10.1016/j.tiv.2013.02.010. [DOI] [PubMed] [Google Scholar]
Associated Data
This section collects any data citations, data availability statements, or supplementary materials included in this article.


