

Abstract

Mouse–mouse hybridoma cell lines producing stable, highly specific monoclonal antibodies with good affinity for the cardiac glycoside digoxin (DIG) were established to construct an indirect enzyme-linked immunosorbent assay and lateral-flow immunochromatographic strip to detect DIG in human blood. The hapten DIG was coupled to bovine serum albumin or chicken ovalbumin by sodium periodate oxidation. The highest sensitivity and specificity antibody had a median inhibitory concentration (IC50) of 0.45 ng/mL, a linear range of detection of 0.293–0.7 ng/mL, and low cross-reactivity with several DIG analogues. The cut-off value of the lateral-flow immunochromatographic strip was 5 ng/mL when the strip was tested with human blood. The immunochromatographic lateral flow strip test provides a quick and convenient method for determining DIG in plasma which can be visually observed in only 5 min to promote rational drug use.
1. Introduction
Digoxin (DIG) is a cardiac glycoside extracted from the leaf of the Digitalis lanata plant that binds Na+/K+-ATPase and inhibits its activity. It is the most frequently used digitalis-based cardiac-active drug for the treatment of congestive heart failure (HF) and supraventricular arrhythmias.1,2 HF remains a huge medical problem, with unacceptably high morbidity and mortality rates, despite optimal medical and mechanical treatment. DIG significantly reduced the risk of all-cause hospital admission in patients with HF during a mean follow-up period of 37 months and reduced the left ventricular ejection fraction.3,4 However, its mechanism of action is complex, its therapeutic index is low, and its effective therapeutic range is narrow (only 0.8–2.0 ng mL–1), so any small increase in plasma levels can have serious adverse effects, and the optimal blood concentration is 0.5–0.8 ng mL–1. Therefore, the patient’s plasma DIG levels must be monitored during its clinical use.5,6 The therapeutic dose is very close to the toxic amount (60% of the poisoning dose), so the safety factor is small, and individual differences in the responses of different patients to DIG treatment are extremely large. Therefore, the conventional dose of DIG sometimes also causes poisoning, and the clinical manifestations of overdosing and underdosing are similar. Consequently, the incidence of poisoning during its clinical application is high.7,8
In the past few years, the analytical methods commonly used to monitor the blood concentrations of DIG have predominantly included liquid chromatography (LC)–fluorescence detection,9 high-performance LC,10 gas chromatography–mass spectrometry (MS),11 laborious radio-immunoassays,12 LC–MS, and LC–tandem MS (LC–MS/MS).13 The main technique adopted in China is the fluorescence polarization immunoassay, which is fast, accurate, sensitive, and specific, but expensive. This immunoassay is highly sensitive in detecting DIG concentrations in vivo, requires smaller than usual samples, is simple and rapid, can be performed in batches, and is widely used in clinical practice. Therefore, this is still the main direction taken in the development of therapeutic drug monitoring technologies.14,15
The enzyme-linked immunosorbent assay (ELISA) provides the ability to process huge numbers of samples with high sensitivity and specificity and convenience.16−18 The most effective way to prevent DIG poisoning is to apply an anti-DIG antibody.19,20 In recent years, anti-DIG antibodies also play an important role in molecular biology hybridization techniques and can be used to detect all nucleic acids, proteins, and carbohydrates labeled by DIG, for example, Teles et al. developed an in situ hybridization assay to detect the MDM2 gene amplification by using a dinitrophenyl-labeled MDM2 probe and a DIG-labeled CHR12 probe on an automated slide staining platform at Ventana Medical Systems.21,22 Although polyclonal antibodies are sensitive and specific, they are not widely used in the market because they have poor reproducibility. Furthermore, anti-DIG monoclonal antibodies (mAbs) have been shown to be more useful than polyclonal antisera in the clinical management of patients with heart disease and in reversing the toxicity of digitalis. Therefore, a highly sensitive and specific-mAb-based indirect competitive ELISA (ic-ELISA) for the detection of DIG is essential. The lateral-flow immunochromatographic strip, which is established on the competitive format of the ic-ELISA, is undoubtedly most convenient for on-site analyses and high-throughput sample processing, and has been widely adopted for the analysis of chemicals.23−26
To ensure the safety of DIG in clinical use and improve the rational level of its use, we established lateral-flow immunochromatographic strip which was based on highly sensitive and specific mAb to detect the concentration of DIG in plasma. It provides a simple, fast, sensitive, and accurate measurement of the blood concentration of DIG for use in clinical monitoring and research.
2. Results and Discussion
2.1. Electrophoresis Characterization
DIG has a relative molecular mass of about 781 and is not immunogenic, so it is a hapten. Therefore, this small-molecule hapten must be coupled to a macromolecular protein to prepare an artificial DIG antigen. DIG was coupled to bovine serum albumin (BSA) or ovalbumin (OVA) by sodium periodate oxidation to produce the immunogen and the coating antigen for immunochromatographic strips. In this study, we used electrophoresis to characterize the antigen. The results of their characterization are shown in Figure 2.
Figure 2.

Electrophoresis of different antigens. (a) 1: BSA, 2: DIG–BSA and (b) 1: OVA, 2: DIG–OVA.
2.2. Preparation and Characterization of mAb
After the fifth immunization with the immunogen, the mouse with the highest serum antibody titer and lowest IC50 (5 ng/mL) were selected for cell fusion. The hybridomas were screened with an ic-ELISA and isolated with the limiting dilution method.
In this study, three anti-DIG cell lines 1H2, 1H3, and 2D12 were produced, and 1H3 had the highest sensitivity and specificity. The standard curve (Figure 3) was established for mAb 1H3 with the equation y = 0.293 + 1.496/(1 + [x/0.453]3.102) and the linear regression correlation coefficient (R2) was 0.999. The IC50 value was 0.45 ng/mL and the linear range was 0.293–0.7 ng/mL.
Figure 3.
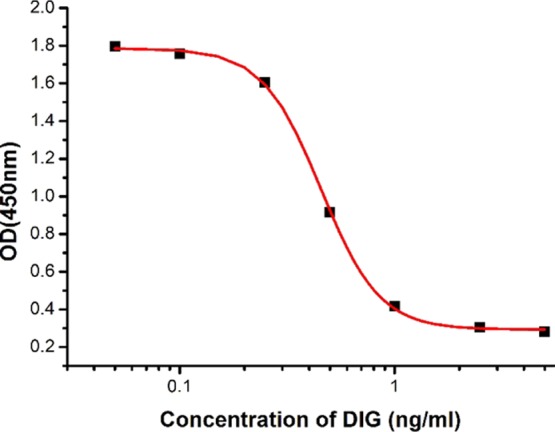
Standard curve obtained by ic-ELISA based on antibody 1H3.
2.3. Cross-Reactivity
The cross-reactivity (CR) of an antibody, which is its ability to recognize other similar or different substances, is a measure of its specificity. To evaluate the mAb specificity, its CR with digitoxin, cortisol, estradiol, dexamethasone, testosterone, progesterone, estrone, and ouabain was measured. As shown in Table 1, 1H3 is the most cross-reactive with digitoxin among these substances closely related to DIG, but digitoxin is not a natural compound of human blood, its presence in tested samples accords to pharmaceutical application and is known before the assay, and the CR with other DIG analogues does not exceed 2.3%. Therefore, we inferred that the mAb produced was highly specific.
Table 1. Cross-Reaction Results of mAb 1H3.

2.4. Characterization of the Immunochromatographic Strip for DIG with Human Blood
As can be seen in Figure 4, among the three cell lines isolated in this study (1H2, 1H3, and 2D12), 1H3 was most effective, and was used in the subsequent experiments.
Figure 4.
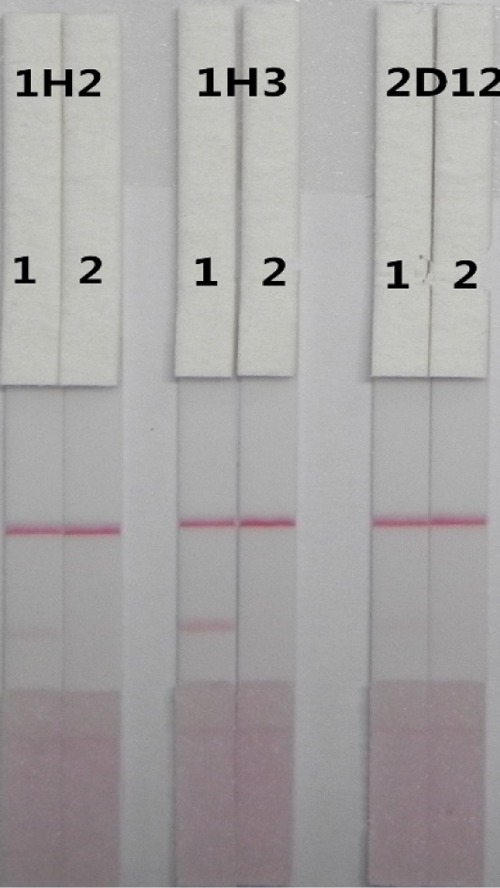
Detection of three anti-DIG cell lines 1H2, 1H3, and 2D12 by lateral-flow immunochromatographic assay (ICA) strip in PBS sample (1 = 0 ppb, 2 = 0.5 ppb).
Phosphate-buffered saline (PBS) samples and serum samples spiked with different concentrations of DIG were analyzed with the lateral-flow immunochromatographic strip (Figure 5). It can be seen from Figure 5 that the visual limit of detection of the sample is less than 0.5 ng/mL, which is lower than the optimal blood concentration of the human body and has practical detection significance.
Figure 5.
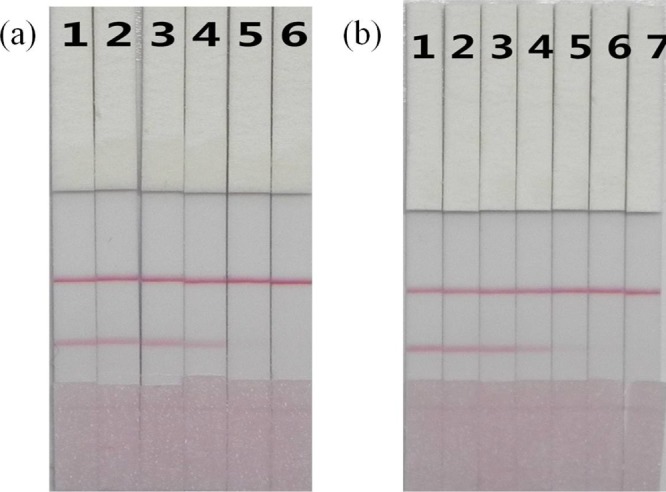
DIG detection by lateral-flow ICA strip in PBS sample (a) and human blood sample (a) 1 = 0 ng/mL, 2 = 0.25 ng/mL, 3 = 0.5 ng/mL, 4 = 1 ng/mL, 5 = 2.5 ng/mL, and 6 = 5 ng/mL; the cut-off value for DIG was 5 ng/mL. (b) 1 = 0 ng/mL, 2 = 0.1 ng/mL, 3 = 0.25 ng/mL, 4 = 0.5 ng/mL, 5 = 1 ng/mL, 6 = 2.5 ng/mL and 7 = 5 ng/mL; the cut-off value for DIG was 5 ng/mL.
The cut-off values for the serum samples were essentially the same as those for the PBS samples, indicating that there was little matrix interference when actual samples were tested. Therefore, the developed lateral-flow immunochromatographic strip is suitable for the detection of DIG in actual samples.
2.5. DIG Recovery Test in Serum Samples
The concentrations of DIG mixed into the serum samples were 3, 5, and 7 ng/mL. As shown in Table 2, the recovery rates were 95.7–105.4% and the coefficients of variation were 5.37–8.42%, indicating that the developed method is stable, accurate, and can be used for the detection of DIG in serum samples.
Table 2. Recovery of DIG in Serum by ic-ELISA and Strip Assay.
| ic-ELISA |
test
strips |
|||||
|---|---|---|---|---|---|---|
| sample | spiked level (ng/mL) | mean ± SD | recovery rate (%) | CV (%) | C line | T line |
| serum | 3 | 0.287 ± 0.004 | 95.7 ± 1.3 | 6.21 | +++ | ++ |
| 5 | 0.527 ± 0.003 | 105.4 ± 0.6 | 5.37 | +++ | + | |
| 7 | 0.681 ± 0.013 | 97.3 ± 1.8 | 8.42 | +++ | ––– | |
3. Conclusions
The hapten DIG was conjugated to BSA or OVA by sodium periodate oxidation in this experiment. A mAb, 1H3, with high specificity and maximum sensitivity for DIG, was successfully produced with this hapten, and was used to develop a colloidal gold test strip. The IC50 value of mAb DIG-1H3 was 0.45 ng/mL, its linear range was 0.293–0.7 ng/mL, and it showed low CR with several DIG analogues. Furthermore, our DIG-1H3-based immunochromatographic strip directly detected DIG in serum samples, and therefore is more rapid than other methods, with visible results produced in only 5 min. It also showed good stability and sensitivity in serum samples. Therefore, the DIG-1H3-based immunochromatographic lateral-flow strip test developed here provides a rapid and convenient method for detecting the concentration of DIG in plasma, and should improve the rational use of this drug.
4. Materials and Methods
4.1. Reagents and Instruments
DIG, sodium borohydride (NaBH4), sodium periodate, polyethylene glycol 1450, hypoxanthin–aminopterin–thymidine (50×), hypoxanthine and thymidine (100×), BSA, OVA, Freund’s complete adjuvant, Freund’s incomplete adjuvant, and a goat anti-mouse IgG antibody were all purchased from Sigma-Aldrich (Shanghai, China). Tetramethylbenzidine, and horseradish peroxidase (HRP) were purchased from Aladdin Chemistry Co., Ltd (Shanghai, China). Fetal bovine serum and RPMI 1640 were purchased from Sunshine Biotechnology Co., Ltd (Nanjing, China). Polyvinylchloride (PVC) pads, absorbance pads (H5079), sample pads (glass-fiber membrane, GL-b01), and nitrocellulose (NC) membranes were obtained from Jieyi Biotechnology Co., Ltd (Shanghai, China). All other analytical-grade reagents and chemicals were from the Sinopharm Chemical Reagent Co., Ltd (Beijing, China). Multiskan MKS microplate reader was purchased from Thermo Labsystems Company (Beijing, China). Electrophoresis instrument and gel imaging system was purchased from Bio-Rad Laboratories Co., Ltd (Shanghai, China).
4.2. Solutions
The coating buffer contained 50 mM carbonate bicarbonate (CB, pH 9.6). The blocking buffer consisted of 0.2% gelatin in CB. The assay buffer was PBS (0.01 M phosphate, pH 7.4), and the washing buffer was prepared by 0.05% Tween 20 in 0.01 M PBS. The color buffer contained solution A (9.33 g of citric acid, 36.8 g of Na2HPO4, and 180 μL of 30% H2O2 per 1000 mL) and solution B [0.06% (v/v) 3,3′,5,5′-tetramethylbenzidine in ethylene glycol] mixed in a 5:1 (v/v) ratio. Human plasma was obtained from the Second People’s Hospital of Wuxi City (Wuxi, China).
4.3. Preparation and Characterization of Antigens
The hapten DIG was coupled to BSA or chicken OVA by sodium periodate oxidation, briefly as follows: 219 mg of DIG (0.28 mol) was added dropwise to 10 mL of absolute ethanol; 10 mL of 0.1 mol L–1 NaIO4 solution was mixed and stirred at room temperature for 1 h. Ethylene glycol (1 mol L–1, 0.6 mL) was spiked and the solution was stirred continuously for 5 min. The reaction mixture was then added dropwise to a 2.8% (2.8 g/100 mL) BSA solution (pH 9.0–9.5, adjusted with 5% K2CO3) with stirring, and stirring was continued for 1 h until the pH had stabilized. NaBH4 (150 mg) was added to deoxygenize for 16 h. Formic acid (1 mol L–1) was then added, the pH was adjusted to 6.5, and the reaction was incubated at room temperature for 1 h. The reaction mixture was dialyzed in water overnight (pH 8.5, adjusted with 5% NH4OH). The pH of the dialysate was then adjusted to 4.8–5.1 with 0.1 mol L–1 HCl to maximize precipitation. The precipitate was allowed to stand at room temperature for 1 h or at 4 °C for 3 h. The precipitate was centrifuged at 4 °C for 8 min (1.2 × 10⁴g) and the supernatant was abandoned. The sediment was dissolved in 0.15 mol L–1 NaHCO3, and the solution was collected in a dialysis bag for further separation and purification. The coating antigen was prepared with the same method, except that the carrier protein BSA was replaced with OVA. The structures of the antigen synthesized in this study are shown in Figure 1. The antigens were characterized with electrophoresis.
Figure 1.

Synthesis of the DIG hapten.
4.4. Characterization Anti-DIG mAb
The DIG–BSA complex described above was used as the immunogen and the method of immunization was as previously reported.27 Briefly, female BALB/c mice (8–10 weeks old) were injected with the immunogen (DIG–BSA) to produce polyclonal antibodies against DIG. After the third immunization, the sera were collected from the mice and examined with ic-ELISA. The procedure was described briefly as follows:28 the coating antigen (DIG–OVA) was diluted to 0.3, 0.1, 0.03 μg/mL and was encapsulated in a 96-well plate with a coating solution and a blocking solution. Standard potassium PBS (K+PBS; 50 μL/well) was then added, together with diluted mouse serum, and the plate was transferred to 37 °C incubator for 30 min. Then HRP-labeled goat anti-mouse IgG antibody was added to each well and the plates were incubated at 37 °C for 30 min. Color buffer (100 μL) was added to each well and incubated for 30 min in the dark, after which 50 μL of pure sulfuric acid (2 M) was added to terminate the reaction. The absorbance of each well at 450 nm was measured with a microplate reader. After the fifth immunization with the immunogen, the mouse with the highest serum antibody titer and lowest IC50 were selected for cell fusion. The hybridomas were screened with an ic-ELISA and selected with the limiting dilution method. The ascites were purified by octanoic acid–ammonium sulfate precipitation to isolate the mAbs, dialyzed against PBS at 4 °C for 3 days. All animal studies in this work were performed according to institutional ethical guidelines and were approved by the Committee on Animal Welfare of Jiangnan University.
Digitoxin, cortisol, estradiol, dexamethasone, testosterone, progesterone, estrone, and ouabain were tested with the ic-ELISA. The CR values were calculated with the following equation29
4.5. Preparation of the Immunochromatographic Strip
Gold nanoparticles were prepared with a previously reported method.30 First, 100 mL of chloroauric acid solution (HAuCl4, 0.01%, w/v) was heated in an Erlenmeyer flask and stirred vigorously to the boiling point. Then, 5 mL of freshly prepared 1% (w/v) trisodium citrate solution was immediately added while stirring until the solution was burgundy. The solution was boiled 15 min and cooled to room temperature and stored at 4 °C until use. Gold nanoparticles have an average diameter of 17 ± 2 nm, and transmission electron microscopy was used to characterize gold nanoparticles.
The mAb solution (1 mg/mL) was spiked to 20 mL colloidal gold solution and the pH was adjusted 8.2 with 0.1 M K2CO3. The surfaces of the untreated gold particles were blocked with BSA (10%, 100 mL) at room temperature for 2 h. After centrifugation at 8000g for 30 min at 4 °C, the precipitate was resuspended in 0.1 mL ultrapure water and stored at 4 °C until use.31
4.6. Analysis of Blood Samples with Immunochromatographic Strip
The immunochromatographic test strip is established on a specific antigen–antibody reaction. The antibody with a positive point is electrostatically adsorbed onto the gold nanoparticles with negative sites to form a gold-labeled mAb for detecting a specific substance. The immunochromatographic strip consisted of five sections: a sample pad, a PVC backing card, a conjugate pad (glass fiber), an absorbent pad, and a NC membrane. The top of the PVC backing plate is fixed with an absorbent pad, an NC film is attached to the middle, and a conjugation pad and a sample pad are pasted to the bottom. Goat anti-mouse IgG antibody and an optimum concentration of coating antigen were sprayed onto the NC membrane, forming a test line (T line) and control line (C line). Finally, the pad was cut longitudinally into 3 mm strips.
Human plasma samples (5 mL) were centrifuged for 5 min at 16 000g. The supernatant was diluted 10 times, transferred to another centrifuge tube, and examined immediately. The liquid sample was mixed into the sample pad and immediately moved to the absorbent pad, and the consequence was detected visually after 5 min. In positive samples, DIG competed with the antigen for the gold-labeled mAb on the T line. Conversely, if the sample solution contained no DIG, the gold-labeled anti-DIG mAb was captured by the antigen immobilized on the T line, causing the T line to become colored. The C line always showed obvious color because the free gold-labeled mAb or mAb conjugate was captured by the anti-mouse IgG antibody.32 Therefore, as the DIG in the sample increased, the color of the T line decreased. When the amount of DIG reached a certain concentration, it reacted with all the gold-labeled anti-DIG mAb and the T line disappeared.
Acknowledgments
This work is financially supported by National Key R&D Program (2017YFC1601102) and by the Postgraduate Research & Practice Innovative Program of Jiangsu Province (KYCX18_1756).
The authors declare no competing financial interest.
References
- Lopes R. D.; Rordorf R.; De Ferrari G. M.; Leonardi S.; Thomas L.; Wojdyla D. M.; et al. Digoxin and Mortality in Patients With Atrial Fibrillation. J. Am. Coll. Cardiol. 2018, 71, 1063–1074. 10.1016/j.jacc.2017.12.060. [DOI] [PubMed] [Google Scholar]
- Shahouzehi B.; Nasri H. R.; Masoumi-Ardakani Y. The effect of different digoxin concentrations on heart tissue and antioxidant status in iron-overloaded rats. ARYA Atheroscler. 2018, 14, 46–52. 10.22122/arya.v14i2.1642. [DOI] [PMC free article] [PubMed] [Google Scholar]
- van Veldhuisen D. J.; Rienstra M.; van der Meer P. Value of digoxin in patients with heart failure: new pieces to the puzzle. Eur. J. Heart Failure 2018, 20, 1146–1147. 10.1002/ejhf.1200. [DOI] [PubMed] [Google Scholar]
- Lam P. H.; Bhyan P.; Arundel C.; Dooley D. J.; Sheriff H. M.; Mohammed S. F.; et al. Digoxin use and lower risk of 30-day all-cause readmission in older patients with heart failure and reduced ejection fraction receiving beta-blockers. Clin. Cardiol. 2018, 41, 406–412. 10.1002/clc.22889. [DOI] [PMC free article] [PubMed] [Google Scholar]
- Wagner A. D.; Kolb J. M.; Özbal C. C.; Herbst J. J.; Olah T. V.; Weller H. N.; et al. Ultrafast mass spectrometry based bioanalytical method for digoxin supporting an in vitro P-glycoprotein (P-gp) inhibition screen. Rapid Commun. Mass Spectrom. 2011, 25, 1231–1240. 10.1002/rcm.4984. [DOI] [PubMed] [Google Scholar]
- Rao Z.; Qin H.; Wei Y.; Zhou Y.; Zhang G.; Zhang F.; et al. Development of a dynamic multiple reaction monitoring method for determination of digoxin and six active components of Ginkgo biloba leaf extract in rat plasma. J. Chromatogr. B: Anal. Technol. Biomed. Life Sci. 2014, 959, 27–35. 10.1016/j.jchromb.2014.03.028. [DOI] [PubMed] [Google Scholar]
- Xu R.; Lin G.; Wang W.; Liu M.; Zhan S.; Wang L.; Zhang K.; Zhang R.; Li J. Application of an ELISA-elution assay to dissociate digoxin-antibody complexes in immunoaffinity chromatography. Scand. J. Immunol. 2010, 71, 55–60. 10.1111/j.1365-3083.2009.02333.x. [DOI] [PubMed] [Google Scholar]
- Gheorghiade M.; Harinstein M.; Filippatos G. Digoxin for the treatment of chronic and acute heart failure syndromes. Acute Card. Care 2009, 11, 83–87. 10.1080/17482940902883246. [DOI] [PubMed] [Google Scholar]
- Omidfar K.; Kia S.; Kashanian S.; Paknejad M.; Besharatie A.; Kashanian S.; et al. Colloidal nanogold-based immunochromatographic strip test for the detection of digoxin toxicity. Appl. Biochem. Biotechnol. 2010, 160, 843–855. 10.1007/s12010-009-8535-x. [DOI] [PubMed] [Google Scholar]
- Kwon H.-J.; Sim H.-J.; Lee S.-i.; Lee Y.-M.; Park Y.-D.; Hong S.-P. HPLC method validation for Digitalis and its analogue by pulsed amperometric detection. J. Pharm. Biomed. Anal. 2011, 54, 217–221. 10.1016/j.jpba.2010.07.037. [DOI] [PubMed] [Google Scholar]
- Josephs R. D.; Daireaux A.; Westwood S.; Wielgosz R. I. Simultaneous determination of various cardiac glycosides by liquid chromatography-hybrid mass spectrometry for the purity assessment of the therapeutic monitored drug digoxin. J. Chromatogr. A 2010, 1217, 4535–4543. 10.1016/j.chroma.2010.04.060. [DOI] [PubMed] [Google Scholar]
- Li S.; Liu G.; Jia J.; Miao Y.; Gu S.; Miao P.; et al. Therapeutic monitoring of serum digoxin for patients with heart failure using a rapid LC-MS/MS method. Clin. Biochem. 2010, 43, 307–313. 10.1016/j.clinbiochem.2009.09.025. [DOI] [PubMed] [Google Scholar]
- Li X.; Wang Y.; Zhou Q.; Yu Y.; Chen L.; Zheng J. A sensitive method for digoxin determination using formate-adduct ion based on the effect of ionization enhancement in liquid chromatograph-mass spectrometer. J. Chromatogr. B: Anal. Technol. Biomed. Life Sci. 2015, 978–979, 138–144. 10.1016/j.jchromb.2014.11.023. [DOI] [PubMed] [Google Scholar]
- Yamada T.; Suzuki K.; Iguchi K.; Kanada Y.; Kanada R.; Ijiri Y.; Nishihara M.; Murakami S.; Hayashi T.; Tamai H.; Tanaka K. Interference between eplerenone and digoxin in fluorescence polarization immunoassay, microparticle enzyme immunoassay, and affinity column-mediated immunoassay. Therapeutic Drug Monitoring 2010, 32, 774–777. 10.1097/ftd.0b013e3181e649a0. [DOI] [PubMed] [Google Scholar]
- Fink S. L.; Robey T. E.; Tarabar A. F.; Hodsdon M. E. Rapid detection of convallatoxin using five digoxin immunoassays. Clin. Toxicol. 2014, 52, 659–663. 10.3109/15563650.2014.932366. [DOI] [PMC free article] [PubMed] [Google Scholar]
- Zeng L.; Jiang W.; Liu L.; Song S.; Kuang H. Development of ic-ELISA and lateral-flow immunochromatographic strip for detection of vitamin B2 in an energy drink and vitamin tablets. Food Agric. Immunol. 2017, 29, 121–132. 10.1080/09540105.2017.1360257. [DOI] [Google Scholar]
- Zhang X.; Zhuang H.; Wan X. Hapten Syntheses, Antibody Generation, and Ultrasensitive Enzyme-Linked Immunosorbent Assay for the Determination of Tonalid in Human Blood. Anal. Lett. 2018, 51, 1874–1889. 10.1080/00032719.2017.1392546. [DOI] [Google Scholar]
- Ge J.; Cui X.; Shi Y.; Zhao L.; Wei C.; Wen S.; et al. Development and application of an indirect enzyme-linked immunosorbent assay based on recombinant capsid protein for the detection of mink circovirus infection. BMC Vet. Res. 2018, 14, 29. 10.1186/s12917-018-1337-z. [DOI] [PMC free article] [PubMed] [Google Scholar]
- Lin C.-C.; Yang C.-C.; Phua D.-H.; Deng J.-F.; Lu L.-H. An Outbreak of Foxglove Leaf Poisoning. J. Chin. Med. Assoc. 2010, 73, 97–100. 10.1016/s1726-4901(10)70009-5. [DOI] [PubMed] [Google Scholar]
- Schaeffer T. H.; Mlynarchek S. L.; Stanford C. F.; Delgado J.; Holstege C. P.; Olsen D.; et al. Treatment of chronically digoxin-poisoned patients with a newer digoxin immune fab--a retrospective study. J. Am. Osteopath. Assoc. 2010, 110, 587–592. [PubMed] [Google Scholar]
- Teles F. R. F.; Teles R. P.; Siegelin Y.; Paster B.; Haffajee A. D.; Socransky S. S. RNA-oligonucleotide quantification technique (ROQT) for the enumeration of uncultivated bacterial species in subgingival biofilms. Mol. Oral Microbiol. 2011, 26, 127–139. 10.1111/j.2041-1014.2010.00603.x. [DOI] [PMC free article] [PubMed] [Google Scholar]
- Zhang W.; McElhinny A.; Nielsen A.; Wang M.; Miller M.; Singh S.; et al. Automated Brightfield Dual-Color In Situ Hybridization for Detection of Mouse Double Minute 2 Gene Amplification in Sarcomas. Appl. Immunohistochem. Mol. Morphol. 2011, 19, 54–61. 10.1097/pai.0b013e3181ee8e14. [DOI] [PubMed] [Google Scholar]
- Peng J.; Meng X.; Deng X.; Zhu J.; Kuang H.; Xu C. Development of a monoclonal antibody-based sandwich ELISA for the detection of ovalbumin in foods. Food Agric. Immunol. 2012, 25, 1–8. 10.1080/09540105.2012.716398. [DOI] [Google Scholar]
- Urusov A. E.; Gubaidullina M. K.; Petrakova A. V.; Zherdev A. V.; Dzantiev B. B. A new kind of highly sensitive competitive lateral flow immunoassay displaying direct analyte-signal dependence. Application to the determination of the mycotoxin deoxynivalenol. Microchim. Acta 2018, 185, 29. 10.1007/s00604-017-2576-6. [DOI] [PubMed] [Google Scholar]
- Chen Y.; Guo L.; Liu L.; Song S.; Kuang H.; Xu C. An ultrasensitive immunochromatographic strip for fast screening of twenty-seven sulfonamides in honey and pork liver samples based on a monoclonal antibody. J. Agric. Food Chem. 2017, 65, 8248–8255. 10.1021/acs.jafc.7b03190. [DOI] [PubMed] [Google Scholar]
- Lei X.; Song S.; Tao H.; Liu L.; Zheng Q.; Xu C.; et al. Development of Indirect Competitive Enzyme-Linked Immunosorbent and Immunochromatographic Strip Assays for Tiamulin Detection in Chicken. ACS Omega 2018, 3, 3581–3586. 10.1021/acsomega.8b00289. [DOI] [PMC free article] [PubMed] [Google Scholar]
- Wang W.; Feng M.; Kong D.; Liu L.; Song S.; Xu C. Development of an immunochromatographic strip for the rapid detection ofPseudomonas syringae pv. maculicolain broccoli and radish seeds. Food Agric. Immunol. 2015, 26, 738–745. 10.1080/09540105.2015.1023266. [DOI] [Google Scholar]
- Jiang W.; Zeng L.; Liu L.; Song S.; Kuang H. Immunochromatographic strip for rapid detection of phenylethanolamine A. Food Agric. Immunol. 2017, 29, 182–192. 10.1080/09540105.2017.1364709. [DOI] [Google Scholar]
- Kong D.; Xie Z.; Liu L.; Song S.; Kuang H.; Xu C. Development of ic-ELISA and lateral-flow immunochromatographic assay strip for the detection of vancomycin in raw milk and animal feed. Food Agric. Immunol. 2017, 28, 414–426. 10.1080/09540105.2017.1293014. [DOI] [Google Scholar]
- Wang Z.; Xie Z.; Cui G.; Liu L.; Song S.; Kuang H.; et al. Development of an indirect competitive enzyme-linked immunosorbent assay and immunochromatographic assay for hydrocortisone residues in milk. Food Agric. Immunol. 2017, 28, 476–488. 10.1080/09540105.2017.1297779. [DOI] [Google Scholar]
- Wang Z.; Zou S.; Xing C.; Song S.; Liu L.; Xu C. Preparation of a monoclonal antibody against testosterone and its use in development of an immunochromatographic assay. Food Agric. Immunol. 2016, 27, 547–558. 10.1080/09540105.2015.1137276. [DOI] [Google Scholar]
- Yan L.; Dou L.; Bu T.; Huang Q.; Wang R.; Yang Q.; et al. Highly sensitive furazolidone monitoring in milk by a signal amplified lateral flow assay based on magnetite nanoparticles labeled dual-probe. Food Chem. 2018, 261, 131–138. 10.1016/j.foodchem.2018.04.016. [DOI] [PubMed] [Google Scholar]