Abstract
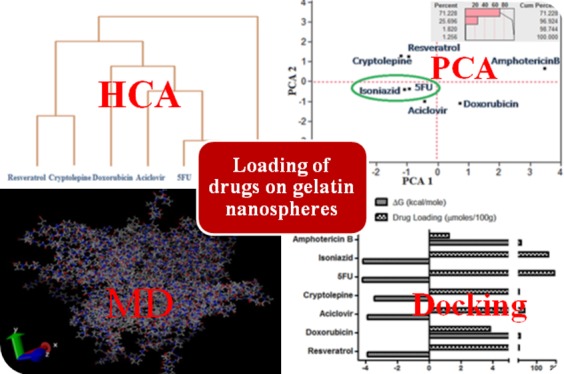
The delivery of drugs is a topic of intense research activity in both academia and industry with potential for positive economic, health, and societal impacts. The selection of the appropriate formulation (carrier and drug) with optimal delivery is a challenge investigated by researchers in academia and industry, in which millions of dollars are invested annually. Experiments involving different carriers and determination of their capacity for drug loading are very time-consuming and therefore expensive; consequently, approaches that employ computational/theoretical chemistry to speed have the potential to make hugely beneficial economic, environmental, and health impacts through savings in costs associated with chemicals (and their safe disposal) and time. Here, we report the use of computational tools (data mining of the available literature, principal component analysis, hierarchical clustering analysis, partial least squares regression, autocovariance calculations, molecular dynamics simulations, and molecular docking) to successfully predict drug loading into model drug delivery systems (gelatin nanospheres). We believe that this methodology has the potential to lead to significant change in drug formulation studies across the world.
1. Introduction
The global market for drug delivery systems is a multibillion-dollar industry, demand for which is growing in both developed and emerging economies (in part, driven by aging societies and rapid urbanization).1−9 Drug delivery systems deliver drugs at rates controlled by specific features of the systems, particularly their chemical composition (e.g., inorganic/organic components, molecular weights of their constituents, cross-linking density of polymers, etc.).10−12
The selection of the appropriate system (carrier and drug) to obtain optimal delivery is a challenge investigated by researchers in academia and industry, in which millions of dollars are invested annually.13 Experiments involving different carriers and determination of their capacity for drug loading are very time-consuming and therefore expensive. Consequently, approaches that exploit multivariate statistical methods, molecular simulations, docking methods, and mining the data in the literature14−19 have the potential to make hugely beneficial economic, environmental, and health impacts through savings in costs associated with chemicals (and their safe disposal) and time.
Computational/theoretical chemists/biochemists, biomedical/chemical engineers, and pharmacists have developed a variety of methodologies that can be applied to understand drug formulations. Principal component analysis (PCA) and hierarchical clustering analysis (HCA) are considered exploratory data analysis and unsupervised machine learning methods, where these techniques extract patterns from the independent factors (x-variables) only and irrelevant to the y-outcomes. Partial least squares (PLS) is a supervised pattern recognition method correlating the inputs with outputs and subsequently leads to the generation of a model.20 This data mining approach (through a retrospective analysis) combined with computer-aided analysis and simulation extracts knowledge from complex variables and responses obtained from historical records. The significant advantage of this approach is the possibility of uncovering interactions and linear relationships that might not be easily detectable with conventional experimental designs.21 Although not yet fully explored in drug formulation/delivery, multivariate statistical methods such as PCA and agglomerative HCA were previously used to develop drug delivery formulations. For example, PCA was utilized to generate a quantitative composition–permeability relationship for microemulsion formulations used to deliver testosterone transdermally, with a linear relationship between the lower-dimensionality data generated from the main principal component and the permeability coefficients of the different formulations.22 PCA and HCA were used to extract stable SMEDDS (self-microemulsifying drug delivery systems) and SNEDDS (self-nanoemulsifying drug delivery systems) formulations of lovastatin and glibenclamide, respectively,23,24 and PCA and PLS analysis were used to assess the qualitative and quantitative effects of different variables such as lipid/surfactant type and their concentrations on parameters related to storage stability.25 Furthermore, PLS was successfully employed to predict the sizes and polydispersity index (PDI) for lipid nanocapsules based on the quantitative mixture composition.26
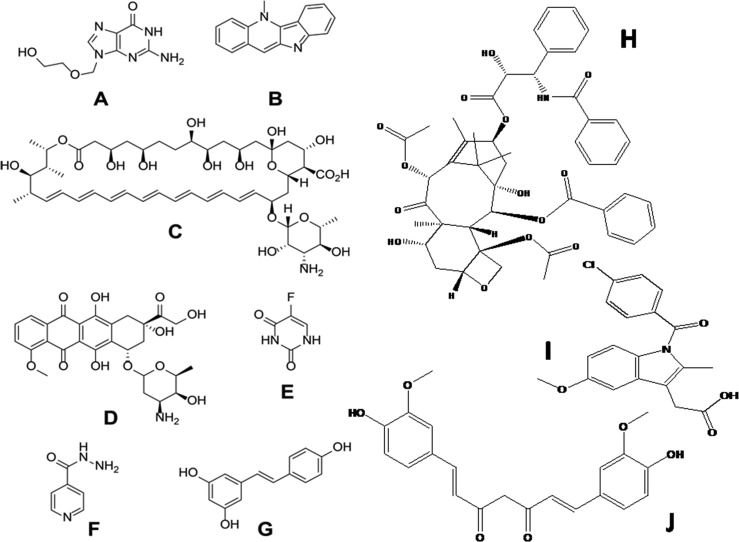
Here, we extend these exciting studies by combining PCA, HCA, and PLS with molecular dynamics and docking analysis27 to give valuable insight into drug loading in a polymer matrix. As a model polymer matrix, we use protein-based nanoparticulate drug delivery systems (i.e., nanospheres composed of collagen-derived gelatin). Gelatin is an abundant and inexpensive protein,28 which is amphiphilic in nature due to its amino acid contents (ca. 12% anionic glutamic and aspartic acid, ca. 13% cationic lysine and arginine amino acids, and ca. 11% hydrophobic leucine, isoleucine, methionine, and valine),29 and gelatin-based matrices can in principle be used to deliver both small molecules and macromolecules.30−36 In this study, we focus on a selection of low-molecular-weight drugs used in the clinic, as depicted in Figure 1.
Figure 1.
Chemical structures of the substances studied herein: (A) acyclovir, (B) cryptolepine, (C) amphotericin B, (D) doxorubicin, (E) 5-fluorouracil (5FU), (F) isoniazid, (G) resveratrol, (H) paclitaxel, (I) indomethacin, and (J) curcumin.
2. Materials and Methods
2.1. Data Set
The data set contained four input variables (descriptors) and one output response (mass of drug loaded per 100 mg gelatin nanospheres determined experimentally) for different drugs. Data mining was performed through different databases such as PubMed and Web of Science to obtain the output response for 10 drugs: acyclovir,37 amphotericin B,38 cryptolepine,39 doxorubicin,40 5-fluorouracil (5FU),41 isoniazid,42 resveratrol,43 curcumin,17 paclitaxel,44 and indomethacin.45
2.2. Calculation of Molecular Descriptors
The drugs were analyzed using Bioclipse version 2.6 (Bioclipse project, Uppsala University, Sweden).39 The four descriptors chosen were constitutional (molecular weight), electronic (number of hydrogen bond donors and number of hydrogen bond acceptors), and physicochemical (xLogP).
2.3. Hierarchical Clustering Analysis (HCA)
The molecular descriptors generated using Bioclipse version 2.6 were subjected to hierarchical clustering analysis using JMP 7.0 (SAS, Cary, NC, USA). Ward’s minimum variance method was adopted to join the clusters and generate a dendrogram. Ward’s method is considered an agglomerative hierarchical technique where the merging in the dendrogram starts at the final clusters (leaves) and merging occurs stepwise until it reaches the trunk. Ward’s minimum variance criterion minimizes the total within-cluster variance. At each step, the pair of clusters possessing the minimum between-cluster distance is merged (i.e., the pair of clusters that leads to the minimum increase in the total within-cluster variance after merging is selected).45
2.4. Principal Component Analysis (PCA)
PCA was used to extract patterns using an exploratory data analysis method that deals with the variances in sample observations. PCA was performed using JMP 7.0. Four principal components were calculated by taking a linear combination of an eigenvector of the correlation matrix built up from standardized original variables. The dimensionality of the data was reduced by extracting two main principal components possessing the two highest eigenvalues and plotting the data with respect to these two new orthogonal axes.
2.5. Partial Least Squares Analysis (PLS) for Model Generation and Validation of the Model
PLS was used to study correlations between the molecular descriptors and the output response. PLS was performed using JMP 7.0 using four latent vectors. The PLS generated model was validated by checking the differences between the mean actual and predicted response values using t-test statistical analysis at P < 0.05 using GraphPad Prism v.5.0 (GraphPad software Inc., San Diego, CA, USA) and by performing a k-fold (5-fold) cross-validation (leave-two-out) to check the predictability of the model and its ability to navigate the experimental space. The value of Q2 (predicted R-squared) was calculated as follows
where PRESS represents the predicted residual error sum of squares, while ISS stands for the total initial sum of squares. Moreover, a predicted versus actual correlation was obtained.
2.6. Molecular Dynamics Simulations (MDS) of the Gelatin Matrix
Molecular dynamics simulations (MDS) were carried out using the GROMACS46 v. 4.6.5 freeware (http://www.gromacs.org/). To prepare the gelatin system, 48 peptide molecules were constructed, with 18 amino acids in each molecule. The primary sequence of the peptides was AGPRGQ(Hyp)GPAGPDGQ(Hyp)GP. Six hypothetical probe molecules (with a calculated molecular weight of 767.13) were added at random positions to the system. The force-field parameters were obtained from CgenFF47 (https://cgenff.paramchem.org/). The system was energy minimized by the steepest descent method. Molecular dynamics was subsequently carried out, with a time step of 2 fs, full periodic boundary conditions, and a cutoff distance of 1.2 nm for van der Waals and electrostatic interactions.48 PME was chosen to handle long-range electrostatic interactions. All bonds were constrained by the LINCS algorithm. The MDS were carried out for 3 ns at 373 K and 1 bar using a v-rescale thermostat and a Berendsen barostat, respectively.49
2.7. Drug Docking in Simulated Gelatin Nanospheres
The chemical structures of the studied drugs were drawn using ChemDraw Ultra version 10 (Cambridgesoft, Waltham, MA, USA). The corresponding “.mol2” files needed for docking experiments were obtained using Chem3D Ultra version 10 (Cambridgesoft, Waltham, MA, USA) after energy minimization using the MM2 force field of the same program. Docking analysis was generated by Argus Lab version 4.0.1 (Mark Thompson and Planaria Software LLC, Seattle, WA, USA). The hypothetical probe molecules were utilized to construct corresponding binding sites on the carrier (gelatin-probe), and the AScore was utilized for calculating the scoring function. The size of the display box in the x, y, and z dimensions were 15 × 15 × 15 Å as these dimensions were suitable to the size of the docked molecules and ensured a central position for them inside the gelatin matrix. Additionally, the genetic algorithm was used as the docking engine with 150 maximum poses. The type of calculation and ligand (as chosen using the software options) were Dock and Flexible, respectively, and the binding energies (ΔG, kcal/mol) reflecting the docking efficiencies were calculated.
3. Results
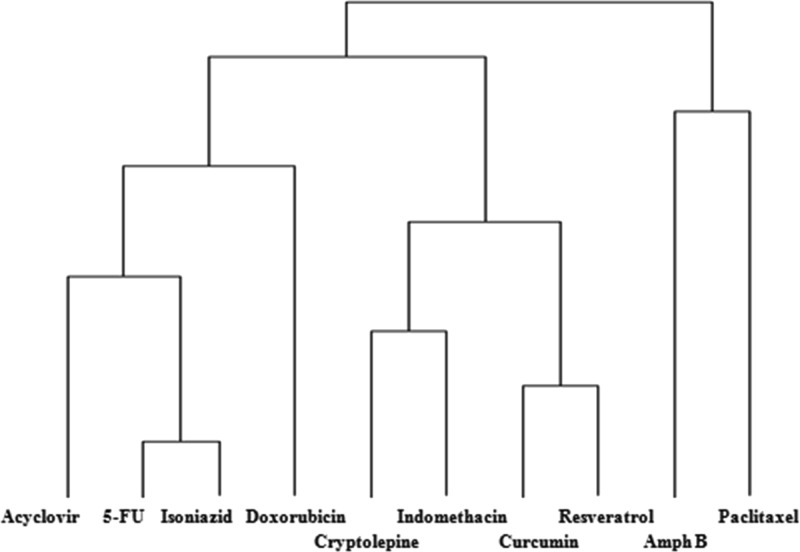
Table 1 reports the molecular descriptors (number of hydrogen bond donors, number of hydrogen bond acceptors, xLogP, and molecular weight) for the investigated drugs. The dendrogram classifying these drugs according to HCA using Ward’s minimum variance method (an agglomerative type of analysis) is displayed in Figure 2. Isoniazid and 5FU were clustered together according to their four descriptors, Resveratrol and cryptolepine clustered together, whereas doxorubicin, acyclovir, and amphotericin B constituted separate clusters. Importantly, the loading pattern followed this classification (see Table 1) where 5FU and isoniazid scored the highest loading masses followed by acyclovir, which is closest to the aforementioned drugs in the dendrogram. Cryptolepine and resveratrol were very close, with doxorubicin near to them. Amphotericin B had the lowest mass loaded into the nanospheres, which was clear from its separate branch (furthest distance) in the dendrogram.
Table 1. Descriptors of the Drugs, Amounts of Loaded Drug, and the Obtained Binding Energies from Docking of the Drugs on a Simulated Gelatin Matrix.
| drug | xLogP | no. H-bond donors | no. H-bond acceptors | molecular weight (g/mol) | actual amount of drug loaded (mg/100 mg gelatin) | Lamarckian genetic algorithm ΔG (kcal/mol) |
|---|---|---|---|---|---|---|
| acyclovir | –1.650 | 3 | 8 | 225.21 | 8.74 | –3.94 |
| amphotericin B | 2.068 | 12 | 18 | 923.49 | 1.16 | 144.4 |
| cryptolepine | 2.180 | 0 | 2 | 233.30 | 2.00 | –3.81 |
| doxorubicin | –1.900 | 6 | 9 | 543.52 | 2.10 | 58.29 |
| 5-fluorouracil | –0.760 | 2 | 4 | 130.00 | 25.07 | –4.19 |
| isoniazid | –0.683 | 3 | 4 | 137.14 | 22.00 | –4.16 |
| resveratrol | 2.050 | 3 | 3 | 228.24 | 1.96 | –3.74 |
| curcumin | 1.95 | 2 | 6 | 368.13 | 3.50 | –2.59 |
| paclitaxel | 6.15 | 4 | 14 | 853.33 | 0.52 | 173.5 |
| indomethacin | 3.78 | 1 | 4 | 338.14 | 1.91 | –1.99 |
Figure 2.
Hierarchical clustering analysis (HCA) of the investigated drugs with respect to four constitutional, electronic, and physicochemical descriptors: number of hydrogen bond donors, number of hydrogen bond acceptors, xLogP, and molecular weight.
A score plot of the drugs with respect to their descriptors after projecting the data into two main principal components is displayed in Figure 3, where principal component 1 and principal component 2 reflect 69.72 and 26.95% of the data variation, respectively (corresponding to 96.68% of total variance; Figure 3, top right panel), and 5FU and isoniazid are clustered together with acyclovir having the nearest score, and amphotericin B the furthest score. Figure 4 depicts the loading plots of the two main principal components. It is obvious that principal component 1 is mainly composed of the descriptors: the molecular weight, the number of the H-bond donors, and the number of the number of H-bond acceptors, while principal component 2 mainly depends on the remaining descriptor, xLogP. These results confirm the presentation of the four investigated variables in the two generated principal components.
Figure 3.
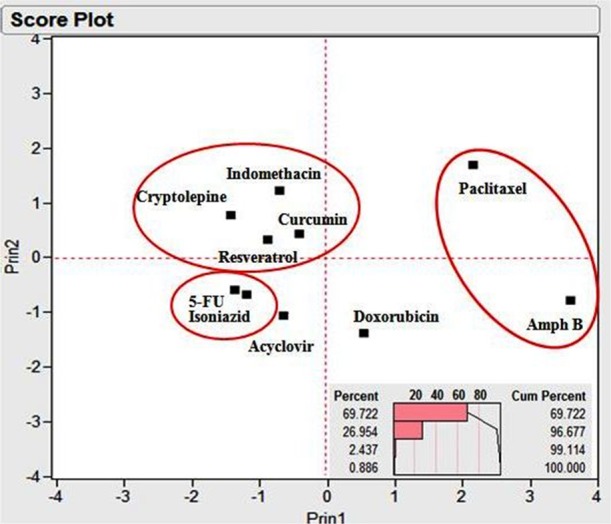
Principal component analysis (PCA) score plot of the investigated drugs with respect to four constitutional, electronic, and physicochemical descriptors: number of hydrogen bond donors, number of hydrogen bond acceptors, xLogP, and molecular weight, displaying only two main combined components. The upper panel depicts the scree plot revealing the percentage variation of each extracted component (combined from the four descriptors).
Figure 4.
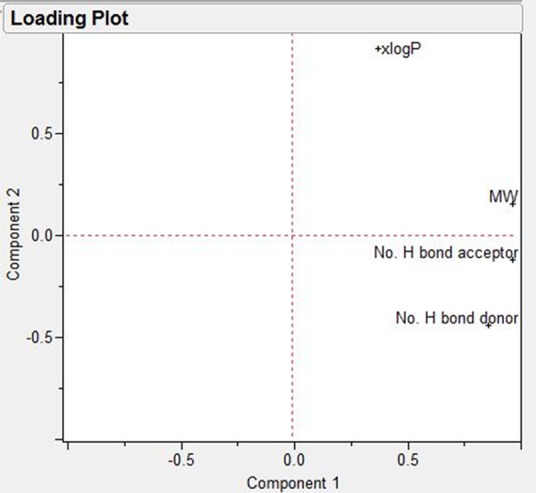
Principal component analysis (PCA) loading plot of the two main principal components.
The relationship between the obtained combined x-scores (combining the contribution from the four x-variables viz. descriptors) and y-scores is displayed in Figure 5, and the screen plot (Figure 5, bottom right) depicts the contribution of each individual latent factor to the combined x-scores with the first two factors accounting for 96.64% of the obtained scores.
Figure 5.
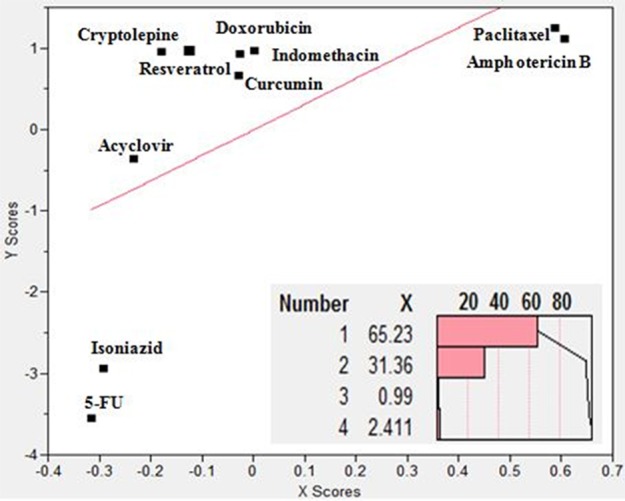
Partial least squares regression analysis (PLS) of the investigated drugs with four constitutional, electronic, and physicochemical descriptors: number of hydrogen bond donors, number of hydrogen bond acceptors, xLogP, and molecular weight as the x-factors and the mass of loaded drug per 100 mg gelatin nanoparticles as the y-factor. The lower panel depicts the contribution of each latent x-factor (combined factor) to the x-scores representing the combined x-dimension.
It is noteworthy that the generated x- and y-scores represent the distances of the points in space of all the dimensions to the main vector summarizing the final dimension (in the current case, there is a principal component or vector for the x-dimension comprising all the descriptors and another for the y-dimension representing the loaded mass). Therefore, the aforementioned scores can be negative numbers. Consequently, a generated model was developed, where
 |
1 |
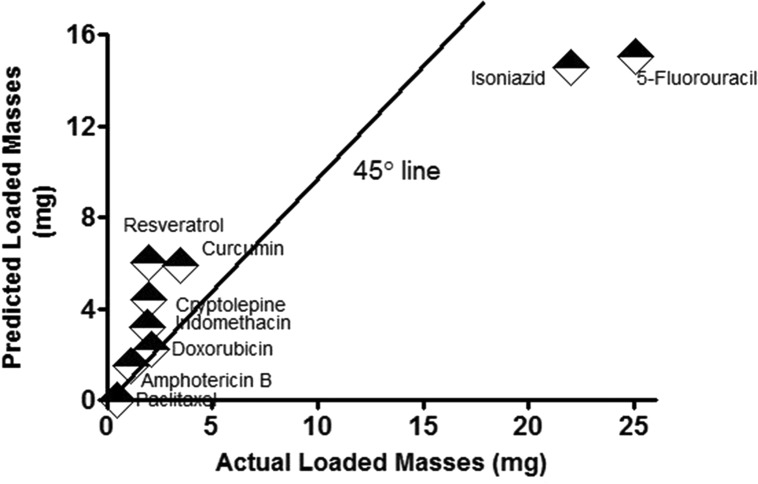
The values and the signs of the coefficients of the x-factors in the equation were indicative of the importance of increasing the number H-bond acceptors in the drug chemical structure in the presence of a balanced xLogP and low molecular weight to increase the loading of the drug. The model was validated by performing t-test statistical analysis between the actual experimental results for drug loading and the predicted drug loading using the model where no significant difference was obtained between the means at P < 0.05. The calculated Q2 or the predicted R-squared after 5-fold cross-validation scored a value of 0.721 (a highly acceptable value).50Figure 6 further demonstrates the predicted versus actual relationship, where it is observed that most of the points are scattered around the 45° line. Proximity of the points to this line usually indicates the favorable similarity of the results. Accordingly, the developed model can be exploited in predicting the loaded mass of any new physically loaded or entrapped investigated drug molecule in a gelatin matrix after projecting its structure to the aforementioned four descriptors (Table 1).
Figure 6.
Predicted versus actual drug loading in gelatin nanospheres.
4. Discussion
In the HCA utilized and studied method (Ward’s method), the distance between two clusters is the ANOVA sum of squares between the two clusters added up over all the variables. At each generation, the within-cluster sum of squares is minimized over all partitions obtainable by merging two clusters from the previous generation. The sums of squares are usually easily interpreted when they are divided by the total sum of squares to give the proportions of variance (squared semipartial correlations). Ward’s method works under the assumptions of spherical covariance matrices and the condition of equal sampling probabilities. Distances between clusters in Ward’s method are calculated according to the squared Euclidean distance. It is considered very useful in joining clusters with a small number of observations and is very accurate though sensitive to outliers.46
PCA was used to confirm the hierarchical clustering analysis results. This type of multivariate analysis deals with the x-factors (descriptors) to reduce their dimensionality by projecting the data into new orthogonal axes that display the directions (vectors) of the highest variation. These results confirmed the HCA results and correlate the x-factors (drug descriptors) with the y-outputs (mass of drug loaded per 100 mg gelatin), where clustered points (especially in the same quadrants) represents high similarity between them regarding their projected descriptors.19
Accordingly, a supervised learning tool (PLS) was used to generate an accurate and sensitive model that would correlate the x-factors with the y-outputs quantitatively. The techniques implemented in the PLS platform work by extracting successive linear combinations of the predictors, called factors (also called components or latent vectors), which optimally address the combined goals of explaining both response and predictor variation. In particular, the method of PLS balances the two objectives and maximizes their correlation.20
The obtained results can be explained by the fact that gelatin is a protein carrier with a relatively balanced hydrophilic/hydrophobic character displaying several hydrogen bond donor and acceptor groups with a repetitive sequence of amino acids -Ala-Gly-Pro-Arg-Gly-Glu-4Hyp-Gly-Pro- along its backbone.51 This structure can be transformed to some numerical values that are generated of each amino acid. Among which are the highly condensed variables “z-scale descriptors”52 that are derived from PCA analysis of several experimental and physicochemical properties of the 20 natural amino acids: z1, z2, and z3, which represent the amino acids hydrophobicity, steric properties, and polarity, respectively. Additionally, they are useful in QSAR analysis of peptides where they have proven effective in predicting different physiological activities.53−55 Herein, we used an extended scale (including 67 more artificial and derivatized amino acids)56 due to the presence of 4-hydroxyproline in the gelatin structure.
In this study, we expand the use of the first descriptor (z1) to predict the drug loading properties of nanoparticles. The first scale (z1) was chosen as it represents a lipophilicity scale that encompasses several variables (amino acid descriptors) such as the thin layer chromatography (TLC) variables, log P, nonpolar surface area (Snp), and polar surface area (Spol) in combination with the number of proton-accepting electrons in the side chain (HACCR).57 In this scale, a large negative value of z1 corresponds to a lipophilic amino acid, while a large positive z1 value corresponds to a polar, hydrophilic amino acid. Therefore, the gelatin typical structure amino acids (-Ala-Gly-Pro-Arg-Gly-Glu-4Hyp-Gly-Pro-) can be represented by their z1 values as follows: (0.24), (2.05), (−1.66), (3.52), (2.05), (3.11), (−0.24), (2.05), and (−1.66). Furthermore, an overall topological description of the repetitive sequence was accounted for by encoding the z1 descriptors of each amino acid into one auto covariance variable47 that was first introduced by Wold et al.58 The autocovariance value (AC) was calculated as follows
| 2 |
where AC represents autocovariances of the same property (z-scale), i = 1, 2, 3,..., N is the number of amino acids, lag = 1, 2, 3, ... L (where L is the maximum lag, which is the longest sequence used) and V is the scale value.
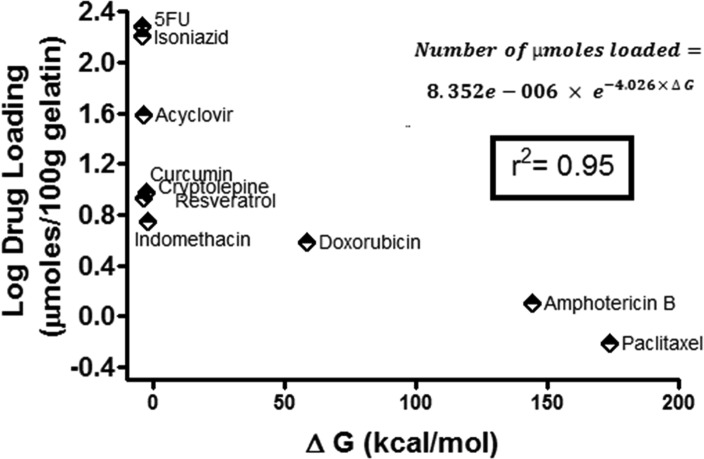
Therefore, the AC value for the gelatin typical structure sequence was calculated with lag 1 scoring a value approaching zero (0.028), indicating a balanced hydrophobicity/hydrophilicity structure. In light of the above, the high loading of 5FU and isoniazid can be ascribed to their amphiphilic nature with LogP values approaching 0 and to the presence of several hydrogen bond donors and acceptors groups relative to their low molecular weight that is favorable in both diffusion through and entrapment in a protein matrix like that of gelatin nanospheres. Since there was a recorded deviation between the actual and the predicted values regarding isoniazid and 5FU (may be attributed to their small molecular weight that helps their nonstoichiometric physical entrapment in the gelatin matrix), therefore, the results were further confirmed by molecular dynamics and docking experiments, where the drugs were docked on the gelatin matrix simulated structure. Figure 7 shows the molecular simulation of the gelatin nanosphere matrix. Interestingly, the best binding energy values ΔG (−4.19 and −4.16 kcal/mol) corresponded to the highest loaded drugs 5FU and isoniazid, respectively, followed by acyclovir (see Figure 8). In the same context, amphotericin B scored a highly positive ΔG value, which explains its low loading values. The confirmation of the docking results with their experimental counterparts can be attributed to the inclusive scoring function of the Arguslab software. This scoring function is based on the XScore calculated according to the following equation59
| 3 |
where ΔGbind is the total calculated binding energy, ΔGvdw is the binding energy due to van der Waals forces, ΔGhydrophobic is the binding energy due to hydrophobic forces, ΔGH-bond is the binding energy due to H-bonding, ΔGH-bond (chg) is the binding energy due to H-bonding due to charged molecules, ΔGdeformation is the energy due to rotational bonds and atoms involved in torsions (rotors) that were frozen due to binding, and finally, ΔG0 represents the regression-obtained binding energy. As can be inferred, the equation terms encompass nearly all the possible interactions that can occur between the drug and its carrier that may lead to drug entrapment, which explains the high correlation obtained between the real experimental values and the docking results.
Figure 7.
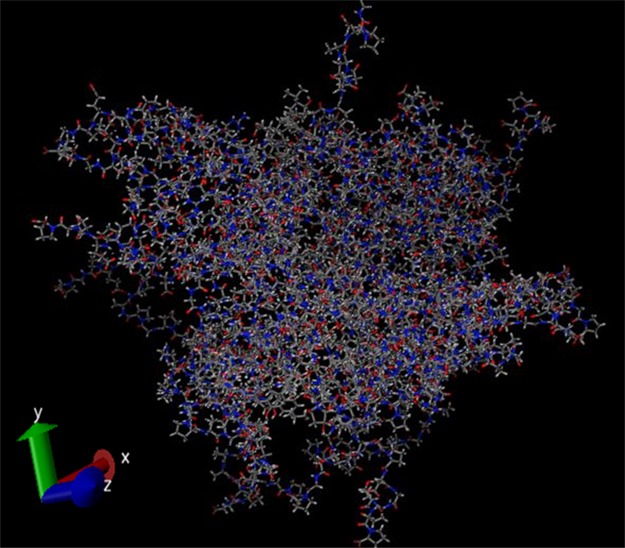
Molecular dynamics simulation of the gelatin nanosphere matrix.
Figure 8.
Drug loading versus the obtained binding energy plot of the investigated drugs after docking on a simulated gelatin matrix built up using molecular dynamics simulation displaying an exponential relationship.
An exponential model was generated correlating the actual experimental molar masses of the loaded drugs and their corresponding docking binding energies. This model was highly fitting with an obtained R-squared value of 0.95. This relationship can highly estimate the molar masses of physically loaded drugs through docking the investigated molecule on the simulated gelatin matrix. The only limitation of the model was the number of the experimental studies that are involved in it (10 studies), which we recommend to increase in further similar studies.
5. Conclusions
The current study introduces new approaches of interpreting and predicting drugs loading on protein carriers, such as gelatin nanospheres. These approaches comprise multivariate statistical methods such as hierarchical clustering analysis, principal component analysis, partial least squares regression, molecular dynamics, and docking. Moreover, the utilization of the amino acids z-scales descriptors represents a new and important asset in interpreting drug loading in protein-based carriers. We believe that this methodology has the potential to lead to significant change in drug formulation studies across the world.
The authors declare no competing financial interest.
References
- Bae Y. H.Stimuli-Sensitive Drug Delivery. In Controlled Drug Delivery: Challenge and Strategies; Park K., Ed.; American chemical Society: Washington, 1997; pp 147–160. [Google Scholar]
- Hoffman A. S.Intelligent Polymers. In Controlled Drug Delivery: Challenge and Strategies, Park K., Ed.; American chemical Society: Washington, 1997; pp 485–497. [Google Scholar]
- Kanjickal D. G.; Lopina S. T. Modeling of drug release from polymeric delivery systems--a review. Crit Rev. Ther. Drug Carrier Syst. 2004, 21, 345–386. 10.1615/critrevtherdrugcarriersyst.v21.i5.10. [DOI] [PubMed] [Google Scholar]
- Kumar M.; Curtis A.; Hoskins C. Application of Nanoparticle Technologies in the Combat against Anti-Microbial Resistance. Pharmaceutics 2018, 10, 11. 10.3390/pharmaceutics10010011. [DOI] [PMC free article] [PubMed] [Google Scholar]
- Liechty W. B.; Kryscio D. R.; Slaughter B. V.; Peppas N. A. Polymers for drug delivery systems. Annu. Rev. Chem. Biomol. Eng. 2010, 1, 149–173. 10.1146/annurev-chembioeng-073009-100847. [DOI] [PMC free article] [PubMed] [Google Scholar]
- Manzur A.; Oluwasanmi A.; Moss D.; Curtis A.; Hoskins C. Nanotechnologies in Pancreatic Cancer Therapy. Pharmaceutics 2017, 9, 39. 10.3390/pharmaceutics9040039. [DOI] [PMC free article] [PubMed] [Google Scholar]
- Patel S.; Bhirde A. A.; Rusling J. F.; Chen X.; Gutkind J. S.; Patel V. Nano delivers big: designing molecular missiles for cancer therapeutics. Pharmaceutics 2011, 3, 34–52. 10.3390/pharmaceutics3010034. [DOI] [PMC free article] [PubMed] [Google Scholar]
- Spizzirri U.; Curcio M.; Cirillo G.; Spataro T.; Vittorio O.; Picci N.; Hampel S.; Iemma F.; Nicoletta F. Recent Advances in the Synthesis and Biomedical Applications of Nanocomposite Hydrogels. Pharmaceutics 2015, 7, 413–437. 10.3390/pharmaceutics7040413. [DOI] [PMC free article] [PubMed] [Google Scholar]
- Zhang N.; Wardwell P.; Bader R. Polysaccharide-based micelles for drug delivery. Pharmaceutics 2013, 5, 329–352. 10.3390/pharmaceutics5020329. [DOI] [PMC free article] [PubMed] [Google Scholar]
- Farid M. M.; Hathout R. M.; Fawzy M.; Abou-Aisha K. Silencing of the scavenger receptor (Class B - Type 1) gene using siRNA-loaded chitosan nanaoparticles in a HepG2 cell model. Colloids Surf., B 2014, 123, 930–937. 10.1016/j.colsurfb.2014.10.045. [DOI] [PubMed] [Google Scholar]
- Mehanny M.; Hathout R. M.; Geneidi A. S.; Mansour S. Exploring the use of nanocarrier systems to deliver the magical molecule; Curcumin and its derivatives. J. Controlled Release 2016, 225, 1–30. 10.1016/j.jconrel.2016.01.018. [DOI] [PubMed] [Google Scholar]
- Mehanny M.; Hathout R. M.; Geneidi A. S.; Mansour S. Studying the effect of physically-adsorbed coating polymers on the cytotoxic activity of optimized bisdemethoxycurcumin loaded-PLGA nanoparticles. J. Biomed. Mater. Res., Part A 2017, 105, 1433–1445. 10.1002/jbm.a.36028. [DOI] [PubMed] [Google Scholar]
- Soltani S.; Sardari S. S.; Soror S. A. Computer simulation of a novel pharmaceutical silicon nanocarrier. Nanotechnol. Sci Appl. 2010, 3, 149–157. 10.2147/NSA.S8378. [DOI] [PMC free article] [PubMed] [Google Scholar]
- Fagir W.; Hathout R. M.; Sammour O. A.; ElShafeey A. H. Self-microemulsifying systems of Finasteride with enhanced oral bioavailability: multivariate statistical evaluation, characterization, spray-drying and in vivo studies in human volunteers. Nanomedicine 2015, 10, 3373–3389. 10.2217/nnm.15.123. [DOI] [PubMed] [Google Scholar]
- Hathout R. M.; Metwally A. A. Towards better modelling of drug-loading in solid lipid nanoparticles: Molecular dynamics, docking experiments and Gaussian Processes machine learning. Eur. J. Pharm. Biopharm. 2016, 108, 262–268. 10.1016/j.ejpb.2016.07.019. [DOI] [PubMed] [Google Scholar]
- Metwally A. A.; Hathout R. M. Computer-Assisted Drug Formulation Design: Novel Approach in Drug Delivery. Mol. Pharmaceutics 2015, 12, 2800–2810. 10.1021/mp500740d. [DOI] [PubMed] [Google Scholar]
- Metwally A. A.; El-Ahmady S. H.; Hathout R. M. Selecting optimum protein nano-carriers for natural polyphenols using chemoinformatics tools. Phytomedicine. 2016, 23, 1764–1770. 10.1016/j.phymed.2016.10.020. [DOI] [PubMed] [Google Scholar]
- Metwally A. A.; Hathout R. M. Replacing microemulsion formulations experimental solubility studies with in-silico methods comprising molecular dynamics and docking experiments. Chem. Eng. Res. Des. 2015, 104, 453–456. 10.1016/j.cherd.2015.09.003. [DOI] [Google Scholar]
- Hathout R. M.; El-Ahmady S. H.; Metwally A. A. Curcumin or bisdemethoxycurcumin for nose-to-brain treatment of Alzheimer disease? A bio/chemo-informatics case study. Nat. Prod. Res. 2017, 2873–2881. 10.1080/14786419.2017.1385017. [DOI] [PubMed] [Google Scholar]
- Gad H. A.; El-Ahmady S. H.; Abou-Shoer M. I.; Al-Azizi M. M. Application of chemometrics in authentication of herbal medicines: a review. Phytochem. Anal. 2013, 24, 1–24. 10.1002/pca.2378. [DOI] [PubMed] [Google Scholar]
- Ronowicz J.; Thommes M.; Kleinebudde P.; Krysiński J. A data mining approach to optimize pellets manufacturing process based on a decision tree algorithm. Eur. J. Pharm. Sci. 2015, 73, 44–48. 10.1016/j.ejps.2015.03.013. [DOI] [PubMed] [Google Scholar]
- Hathout R. M. Using principal component analysis in studying the transdermal delivery of a lipophilic drug from soft nano-colloidal carriers to develop a quantitative composition effect permeability relationship. Pharm. Dev. Technol. 2014, 19, 598–604. 10.3109/10837450.2013.813544. [DOI] [PubMed] [Google Scholar]
- Singh S. K.; Verma P. R. P.; Razdan B. Development and characterization of a lovastatin-loaded self-microemulsifying drug delivery system. Pharm. Dev. Technol. 2010, 15, 469–483. 10.3109/10837450903286537. [DOI] [PubMed] [Google Scholar]
- Singh S. K.; Verma P. R. P.; Razdan B. Glibenclamide-loaded self-nanoemulsifying drug delivery system: development and characterization. Drug Dev. Ind. Pharm. 2010, 36, 933–945. 10.3109/03639040903585143. [DOI] [PubMed] [Google Scholar]
- Martins S.; Tho I.; Souto E.; Ferreira D.; Brandl M. Multivariate design for the evaluation of lipid and surfactant composition effect for optimisation of lipid nanoparticles. Eur. J. Pharm. Sci. 2012, 45, 613–623. 10.1016/j.ejps.2011.12.015. [DOI] [PubMed] [Google Scholar]
- Malzert-Fréon A.; Hennequin D.; Rault S. Partial least squares analysis and mixture design for the study of the influence of composition variables on lipidic nanoparticle characteristics. J. Pharm. Sci. 2010, 99, 4603–4615. 10.1002/jps.22177. [DOI] [PubMed] [Google Scholar]
- Ossama M.; Hathout R. M.; Attia D. A.; Mortada N. D. Enhanced Allicin Cytotoxicity on HEPG-2 Cells Using Glycyrrhetinic Acid Surface-Decorated Gelatin Nanoparticles. ACS Omega 2019, 4, 11293–11300. 10.1021/acsomega.9b01580. [DOI] [PMC free article] [PubMed] [Google Scholar]
- Elzoghby A. O.; Samy W. M.; Elgindy N. A. Protein-based nanocarriers as promising drug and gene delivery systems. J. Controlled Release 2012, 161, 38–49. 10.1016/j.jconrel.2012.04.036. [DOI] [PubMed] [Google Scholar]
- Elzoghby A. O. Gelatin-based nanoparticles as drug and gene delivery systems: reviewing three decades of research. J. Controlled Release 2013, 172, 1075–1091. 10.1016/j.jconrel.2013.09.019. [DOI] [PubMed] [Google Scholar]
- Abozeid S. M.; Hathout R. M.; Abou-Aisha K. Silencing of the metastasis-linked gene, AEG-1, using siRNA-loaded cholamine surface-modified gelatin nanoparticles in the breast carcinoma cell line MCF-7. Colloids Surf., B 2016, 145, 607–616. 10.1016/j.colsurfb.2016.05.066. [DOI] [PubMed] [Google Scholar]
- Hathout R. M.; Omran M. K. Gelatin-based particulate systems in ocular drug delivery. Pharm. Dev. Technol. 2016, 21, 379–386. 10.3109/10837450.2014.999786. [DOI] [PubMed] [Google Scholar]
- Jones R. J.; Rajabi-Siahboomi A.; Levina M.; Perrie Y.; Mohammed A. R. The influence of formulation and manufacturing process parameters on the characteristics of lyophilized orally disintegrating tablets. Pharmaceutics 2011, 3, 440–457. 10.3390/pharmaceutics3030440. [DOI] [PMC free article] [PubMed] [Google Scholar]
- Kanth V.; Kajjari P.; Madalageri P.; Ravindra S.; Manjeshwar L.; Aminabhavi T. Blend Hydrogel Microspheres of Carboxymethyl Chitosan and Gelatin for the Controlled Release of 5-Fluorouracil. Pharmaceutics 2017, 9, 13. 10.3390/pharmaceutics9020013. [DOI] [PMC free article] [PubMed] [Google Scholar]
- Panizzon G.; Bueno F.; Ueda-Nakamura T.; Nakamura C.; Dias Filho B. Preparation of Spray-Dried Soy Isoflavone-Loaded Gelatin Microspheres for Enhancement of Dissolution: Formulation, Characterization and in Vitro Evaluation. Pharmaceutics 2014, 6, 599–615. 10.3390/pharmaceutics6040599. [DOI] [PMC free article] [PubMed] [Google Scholar]
- Taguchi K.; Yamasaki K.; Seo H.; Otagiri M. Potential Use of Biological Proteins for Liver Failure Therapy. Pharmaceutics 2015, 7, 255–274. 10.3390/pharmaceutics7030255. [DOI] [PMC free article] [PubMed] [Google Scholar]
- Xuan X. Y.; Cheng Y. L.; Acosta E. Lecithin-linker microemulsion gelatin gels for extended drug delivery. Pharmaceutics 2012, 4, 104–129. 10.3390/pharmaceutics4010104. [DOI] [PMC free article] [PubMed] [Google Scholar]
- Kharia A. A.; Singhai A. K.; Verma R. Formulation and evaluation of polymeric nanoparticles of an antiviral drug for gastroretention. Int. J. Pharm. Sci. Nanotechnol. 2012, 4, 1557–1562. [Google Scholar]
- Khatik R.; Dwivedi P.; Khare P.; Kansal S.; Dube A.; Mishra P. R.; Dwivedi A. K. Development of targeted 1,2-diacyl-sn-glycero-3-phospho-L-serine-coated gelatin nanoparticles loaded with amphotericin B for improved in vitro and in vivo effect in leishmaniasis. Expert Opin. Drug Delivery 2014, 11, 633–646. 10.1517/17425247.2014.889678. [DOI] [PubMed] [Google Scholar]
- Kuntworbe N.; Al-Kassas R. Design and in vitro haemolytic evaluation of cryptolepine hydrochloride-loaded gelatine nanoparticles as a novel approach for the treatment of malaria. AAPS PharmSciTech 2012, 13, 568–581. 10.1208/s12249-012-9775-6. [DOI] [PMC free article] [PubMed] [Google Scholar]
- Leo E.; Vandelli M. A.; Cameroni R.; Forni F. Doxorubicin-loaded gelatin nanoparticles stabilized by glutaraldehyde: Involvement of the drug in the cross-linking process. Int. J. Pharm. 1997, 155, 75–82. 10.1016/S0378-5173(97)00149-X. [DOI] [Google Scholar]
- Naidu B. V. K.; Paulson A. T. A new method for the preparation of gelatin nanoparticles: Encapsulation and drug release characteristics. J. Appl. Polym. Sci. 2011, 121, 3495–3500. 10.1002/app.34171. [DOI] [Google Scholar]
- Saraogi G. K.; Sharma B.; Joshi B.; Gupta P.; Gupta U. D.; Jain N. K.; Agrawal G. P. Mannosylated gelatin nanoparticles bearing isoniazid for effective management of tuberculosis. J. Drug Targeting 2010, 19, 219–227. 10.3109/1061186X.2010.492522. [DOI] [PubMed] [Google Scholar]
- Karthikeyan S.; Rajendra Prasad N.; Ganamani A.; Balamurugan E. Anticancer activity of resveratrol-loaded gelatin nanoparticles on NCI-H460 non-small cell lung cancer cells. Biomed. Prev. Nutr. 2013, 3, 64–73. 10.1016/j.bionut.2012.10.009. [DOI] [Google Scholar]
- Lu Z.; Yeh T. K.; Wang J.; Chen L.; Lyness G.; Xin Y.; Wientjes M. G.; Bergdall V.; Couto G.; Alvarez-Berger F.; Kosarek C. E.; Au J. L.-S. Paclitaxel gelatin nanoparticles for intravesical bladder cancer therapy. J. Urol. 2011, 185, 1478–1483. 10.1016/j.juro.2010.11.091. [DOI] [PMC free article] [PubMed] [Google Scholar]
- Kumar R.; Nagarwal R. C.; Dhanawat M.; Pandit J. K. In-vitro and in-vivo study of indomethacin loaded gelatin nanoparticles. J. Biomed. Nanotechnol. 2011, 7, 325–333. 10.1166/jbn.2011.1290. [DOI] [PubMed] [Google Scholar]
- Spjuth O.; Helmus T.; Willighagen E. L.; Kuhn S.; Eklund M.; Wagener J.; Murray-Rust P.; Steinbeck C.; Wikberg J. E. Bioclipse: an open source workbench for chemo- and bioinformatics. BMC Bioinformatics 2007, 8, 59. 10.1186/1471-2105-8-59. [DOI] [PMC free article] [PubMed] [Google Scholar]
- Milligan G. W. An examination of the effect of six types of error perturbation on fifteen clustering algorithms. Psychometrika 1980, 45, 325–342. 10.1007/BF02293907. [DOI] [Google Scholar]
- Pronk S.; Páll S.; Schulz R.; Larsson P.; Bjelkmar P.; Apostolov R.; Shirts M. R.; Smith J. C.; Kasson P. M.; van der Spoel D.; Hess B.; Lindahl E. GROMACS 4.5: a high-throughput and highly parallel open source molecular simulation toolkit. Bioinformatics 2013, 29, 845–854. 10.1093/bioinformatics/btt055. [DOI] [PMC free article] [PubMed] [Google Scholar]
- Vanommeslaeghe K.; Hatcher E.; Acharya C.; Kundu S.; Zhong S.; Shim J.; Darian E.; Guvench O.; Lopes P.; Vorobyov I.; Mackerell A. D. Jr. CHARMM general force field: A force field for drug-like molecules compatible with the CHARMM all-atom additive biological force fields. J. Comput. Chem. 2010, 31, 671–690. 10.1002/jcc.21367. [DOI] [PMC free article] [PubMed] [Google Scholar]
- Abdel-Hafez S. M.; Hathout R. M.; Sammour O. A. Tracking the transdermal penetration pathways of optimized curcumin-loaded chitosan nanoparticles via confocal laser scanning microscopy. Int. J. Biol. Macromol. 2018, 108, 753–764. 10.1016/j.ijbiomac.2017.10.170. [DOI] [PubMed] [Google Scholar]
- Hathout R. M.; Metwally A. A. Gelatin Nanoparticles. Methods Mol. Biol. 2019, 2000, 71–78. 10.1007/978-1-4939-9516-5_6. [DOI] [PubMed] [Google Scholar]
- Hellberg S.; Sjoestroem M.; Skagerberg B.; Wold S. Peptide quantitative structure-activity relationships, a multivariate approach. J. Med. Chem. 1987, 30, 1126–1135. 10.1021/jm00390a003. [DOI] [PubMed] [Google Scholar]
- Junaid M.; Lapins M.; Eklund M.; Spjuth O.; Wikberg J. E. S. Proteochemometric modeling of the susceptibility of mutated variants of the HIV-1 virus to reverse transcriptase inhibitors. PLoS One 2010, 5, e14353 10.1371/journal.pone.0014353. [DOI] [PMC free article] [PubMed] [Google Scholar]
- Lapins M.; Wikberg J. E. Kinome-wide interaction modelling using alignment-based and alignment-independent approaches for kinase description and linear and non-linear data analysis techniques. BMC Bioinformatics 2010, 11, 339. 10.1186/1471-2105-11-339. [DOI] [PMC free article] [PubMed] [Google Scholar]
- Strömbergsson H.; Lapins M.; Kleywegt G. J.; Wikberg J. E. S. Towards Proteome-Wide Interaction Models Using the Proteochemometrics Approach. Mol Inform. 2010, 29, 499–508. 10.1002/minf.201000052. [DOI] [PubMed] [Google Scholar]
- Sandberg M.; Eriksson L.; Jonsson J.; Sjöström M.; Wold S. New chemical descriptors relevant for the design of biologically active peptides. A multivariate characterization of 87 amino acids. J. Med. Chem. 1998, 41, 2481–2491. 10.1021/jm9700575. [DOI] [PubMed] [Google Scholar]
- Maccari G.; Di Luca M.; Nifosí R.; Cardarelli F.; Signore G.; Boccardi C.; Bifone A. Antimicrobial peptides design by evolutionary multiobjective optimization. PLoS Comput. Biol. 2013, 9, e1003212 10.1371/journal.pcbi.1003212. [DOI] [PMC free article] [PubMed] [Google Scholar]
- Wold S.; Jonsson J.; Sjörström M.; Sandberg M.; Rännar S. DNA and peptide sequences and chemical processes multivariately modelled by principal component analysis and partial least-squares projections to latent structures. Anal. Chim. Acta 1993, 277, 239–253. 10.1016/0003-2670(93)80437-P. [DOI] [Google Scholar]
- Wang R.; Lai L.; Wang S. Further development and validation of empirical scoring functions for structure-based binding affinity prediction. J. Comput.-Aided Mol. Des. 2002, 16, 11–26. 10.1023/A:1016357811882. [DOI] [PubMed] [Google Scholar]


