

Abstract
The zebrafish (Danio rerio) is an emerging model for cardiovascular research. The zebrafish heart regenerates after 20% ventricular amputation. However, assessment of the physiological responses during heart regeneration has been hampered by the small size of the heart and the necessity of conducting experiments in an aqueous environment. We developed a methodology to monitor a real-time surface electrocardiogram (ECG) by the use of micro-electrodes, signal amplification, and a low pass-filter at a sampling rate of 1 kHz. Wavelet transform was used to further remove ambient noises. Rather than paralyzing the fish, we performed mild sedation by placing the fish in a water bath mixed with MS-222 (tricane methanesulfonate). We recorded distinct P waves for atrial contraction, QRS complexes for ventricular depolarization, and QT intervals for ventricular repolarization prior to, and 2 and 4 days post-amputation (dpa). Sedation reduced the mean fish heart rate from 149 ± 18 to 90 ± 17 beats/min. The PR and QRS intervals remained unchanged in response to ventricular apical amputation (n = 6, p > 0.05). Corrected QT intervals (QTc) were shortened 4 dpa (n = 6, p < 0.05). In a parallel study, histology revealed that apical thrombi were replaced with fibrin clots and collagen fibers. Atrial arrhythmia was noted in response to prolonged sedation. Unlike the human counterpart, ventricular tachycardia or fibrillation was not observed in response to ventricular amputation 2 and 4 dpa. Taken together, we demonstrated a minimally invasive methodology to monitor zebrafish heart function, electrical activities, and regeneration in real-time.
Keywords: ECG, Wavelet transform, Zebrafish, Heart amputation, Heart regeneration
INTRODUCTION
The zebrafish (Danio rerio) has emerged as an excellent cardiovascular model, yet assessing physiological functions of the adult zebrafish heart has been hampered by its small size and the difficulty of performing studies in an aqueous environment. The majority of biological research concerning the zebrafish has focused on its developmental stages; the transparency of the embryo has made the zebrafish a viable model for angiogenesis and organogenesis. However, limited efforts have been developed to monitor the structures and electric activities of the adult zebrafish heart in real-time.
Humans lack the regenerative capacity of organisms such as newts and hydra.2,16 Injured human hearts can scar and remodel, predisposing the individuals to cardiac arrhythmia and sudden death.3 However, zebrafish fully regenerate their myocardium after up to 20% ventricular resection within 2 months without evidence of scar tissues.17 In response to amputation, thrombosis immediately develops to achieve hemeostasis in the ventricle. The thrombus is replaced by a fibrin clot 2–4 days post-amputation (dpa). Nascent cardiomyocytes replace the vast majority of the lost ventricular tissue by 30 dpa, and the structure of the ventricle is fully restored on 60 dpa without scar tissue.17 Molecular and histological methods have been performed to assess heart regeneration. However, research tools to study zebrafish cardiac conduction system and mechanics during the regeneration process have remained under-developed.
Despite a two-chambered heart and a lack of pulmonary vasculature,15 the zebrafish heart parallels that of humans in terms of QT interval and heart rate.13 The atrium is medially dorsal and posterior to the ventricle. Similar to humans, the zebrafish heart is encased by a pericardial sac in the thoracic cavity, and is situated below the pectoral bone of the pectoral fins. The bulbous arteriosus is analogous to the human aortic arch with thick contractile smooth muscle. Blood returns into the sinus venosus, which is analogous to the vena cava.15 The fundamental electrical properties are remarkably similar to those of humans,20 and the critical pathways in cardiovascular development parallel higher vertebrates.8,12,21 Hence, the zebrafish is also an emerging model for studying human inherited cardiac arrhythmia, specifically, long QT syndromes.1
In 2004, Forouhar et al. reported an electrocardiogram (ECG) of an embryonic zebrafish, revealing similar atrial and ventricular electrical signals as found in a human ECG, while encountering challenges in detecting ventricular repolarization (the T wave).9 Through the use of oral perfusion and muscle paralytics, MacRae et al. obtained a consistent ECG of an adult zebrafish with distinct P waves and QRS complexes resembling those of humans.14 For the recording, adult fish were paralyzed while perfusion needles were inserted into the oral cavity.14 In our study, the surface ECG was we acquired in the mildly sedated fish. We applied signal processing and wavelet transform to enhance signal-to-noise ratios.
We performed a short-term follow-up of zebrafish ECG signals prior to ventricular amputation and 2 and 4 dpa. We demonstrated distinct atrial contraction (P), ventricular depolarization (QRS) and repolarization (QT). PR and QRS intervals remained unchanged in response to ventricular amputation (n = 6, p > 0.05). Corrected QT intervals (QTc) shortened on 4 dpa (n = 6, p < 0.05). In parallel, histological findings revealed replacement of thrombus with fibrin clots. While the specific intervals from the individual fish remained identical, the voltage (amplitudes) ratios between P waves and QRS complexes were sensitive to the positioning of electrodes. Ventricular tachycardia or fibrillation was not observed on 2 and 4 dpa. Overall, these studies have provided a basis to monitor zebrafish heart function, electrical activities, regeneration, and QT intervals in real-time.
MATERIALS AND METHODS
Animals
The animal experiments were performed according to protocol approved by the Institutional Animal Care and Use Committee (IACUC) at the University of Southern California. Adult zebrafish, 3–4 cm in length, were acquired from Aquatica Tropical (Florida) and maintained under standard laboratory conditions at 24 °C. The individual fish were fed with brime shrimp (hatched from eggs in 10 mL in 2 L salt water) daily, kept in constantly circulating water, and isolated from other fish for ECG follow-up post-amputation. The range of the fish size was from 31 to 38 mm.
Heart Resection
Zebrafish were sedated in 5% Tricane methanesulfonate (4 g Tricane, 979 mL H2O, 21 mL Tris–HCl) until they floated ventral side up and ceased to move for 5 s. Tweezers were used to remove 3–4 scale layers above the thoracic cavity. A midline incision of 0.25 cm in length was created posterior to the ventricle. The pericardial sac was isolated and punctured to expose the ventricle. The ventricle was gently raised to expose the apex, and approximately 20% of the ventricle was excised by scissors. Thrombosis developed immediately,17 and the zebrafish were returned to freshwater with continuous oxygenator.
ECG Recording
Baseline ECG signals were recorded 1 day prior to ventricular amputation, and repeated ECG interrogations were performed on 2 and 4 days post-amputation. In parallel, ECG signals were recorded from the control fish without heart resection. All of the studies were performed in triplicates at 26 °C. The exact length of the fish was recorded prior to ECG measurement each time. Fish were sedated as described above and placed in a damp sponge with the ventral side exposed for electrode placement. Two 29-gauge micro-electrodes (AD Instrument, Colorado Springs, CO) were positioned at 90° to the animal’s ventral epidermis adjusted by positional walkers (AMI-USC Machine Shop). The positive electrode was positioned directly above the ventricle, or 2–3 mm below the end of the gills along the midline where the chest excursion in response to myocardial contraction could be observed (approximately one-fifth of the body length from the head). The negative or reference electrode was positioned along the midline immediately in front to the anal fin. The relative distance of the two electrodes was about 10–11 mm, or one-third of the total length such that the negative electrode was sufficiently away from the heart and could be safely regarded as ground. The precise placement of both electrodes was established using calipers to measure the relative distance along the ventral line from mouth to tail. The scales were removed to facilitate sufficient contact pressure and increase signal to noise ratio. Both electrodes were inserted into the skin to approximately 1 mm in depth for stabilizing the electrode perpendicular to ventral epidermis (Fig. 1a). The exact position of the positive electrode may be adjusted slightly using the micromanipulator to obtain maximum voltage signals. The individual fish remained stationary in the sponge for less than 3 min, with a mean ECG recording of 1 min. Next, the fish was allowed to recover from sedation within 5 min in an oxygenated water bath free of Tricane.
FIGURE 1.
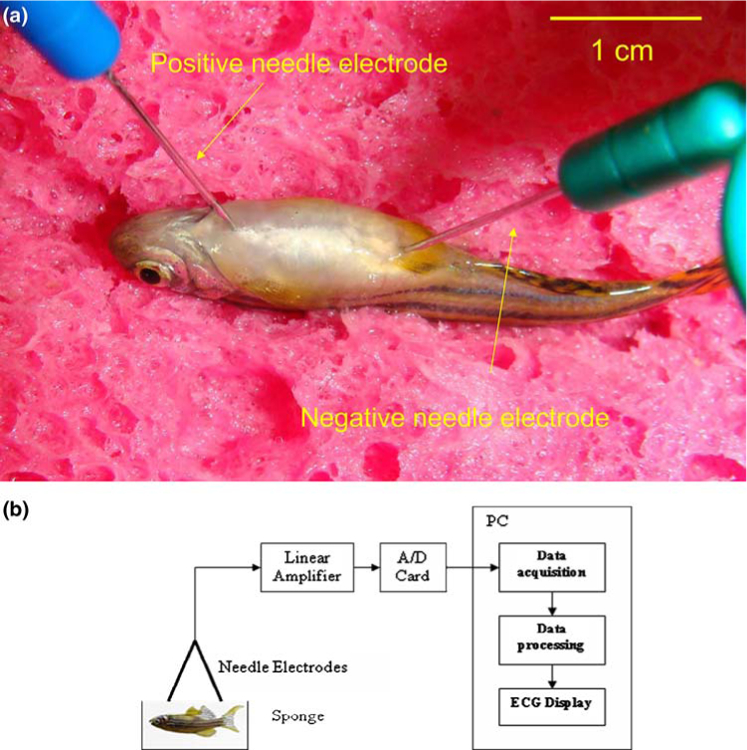
Zebrafish ECG acquisition and processing. (a) Electrode placement. Anesthetized zebrafish were placed in a damp sponge, the positive electrode was inserted in the ventral midline about 2 mm posterior to the gill, and the negative electrode was introduced along the midline immediately in front of the anal fin. (b) Block diagram illustrates the experiment setup for signal processing and wavelet amplification.
Data Acquisition and Processing
The two electrodes were connected to a high-gain differential amplifier (A-M Systems Inc. 1700 Differential Amplifier, Carlsborg, WA) and the ECG signals were amplified by 1000-fold and filtered at a cut-off frequency between 1 and 500 Hz as well as at 60 Hz (notch). The signals were acquired and digitized at a sampling rate of 1000 Hz (National Instruments USB-6251 DAQ Device, Austin TX, and LabVIEW 8.2). The recorded signals were digitally processed using the wavelet transform and threshold with a Matlab 7.5 software (Mathworks Inc, Natick, MA) (Fig. 1b).
Majority of energy of the Zebrafish ECG signals fell within the range of 2–45 Hz frequency. Within this frequency range, QRS intervals fell in the range of 10–45 Hz while T- and P-waves were in the range of 3–10 Hz. The ambient power supply and wiring generated high frequency harmonic interference at 60 Hz. The baseline drifting was below 2 Hz, and the noise from fish gill motion and experimental environment may range from 2 Hz to 1 kHz. In addition to signal processing, wavelet transform allowed for filtering various sources of noise.
A wavelet is a mathematical function used to divide a given function or continuous-time signal into different frequency components. Wavelet transform represents a function by scaled wavelets in the time domain.22 After ECG signals were digitized at 1000 Hz, the digital signals were divided into 10 frequency components or scales by using the ‘‘coif5’’ wavelet, a 5th order coiflet (a discrete wavelet) function designed by Ingrid Daubechies.5,6 Coif5 wavelet is symmetrical, useful in preventing de-phasing image processing. Coif wavelet also allows for a high speed of convergence to reduce computation.7 ‘‘Adaptive Thresholding’’, a process to eliminate with subthreshold value noises while retaining the superthreshold signals within different frequency range, was used to suppress noise from various sources. Finally, the remaining signals were recomposed by inverse wavelet transform to the final de-noised ECG signals.
Heart Histology
After ECG recording, the fish were sacrificed at 4 dpa and the hearts were processed for paraffin section (10 μm). The sections were de-paraffined, and processed for acid fuchsin-orange G (AFOG) staining, staining the fibrin and collagen red and blue, respectively.
Statistical Analysis
ECG recordings were identified for PR, QRS, QT, and RR intervals using the MATLAB® program. ECG signals were selected from rhythm strips containing a minimum of 20 sec of distinct P waves, QRS complexes, and T waves. QT intervals were corrected for heart rate variability by using the following equation4:
| (1) |
All values are expressed as means ± SD. For statistical comparisons of wave intervals, we used a paired t-test with values of p < 0.05 considered to be statistically significant. We compared multiple mean values of ECG signals by the non-parametric one-way Kruskal–Wallis tests10 and assessed the statistical significance of change in PR, QRS and QTc among different measurements.
RESULTS
Signal Processing and Filtering
Power supply, wiring, and motion artifacts constituted the main sources of noise in the recorded ECG signals. Different threshold values were used to de-noise the ECG signals in various frequency ranges. The main zebrafish ECG signals were excluded from scales 1, 2, 9, and 10 as indicated by the individual frequency components or scales (Fig. 2). While high threshold values used in these scales allowed for complete elimination of high frequency noise and the wondering baseline, low threshold values allowed for elimination of the low amplitude noise (Figs. 2a and 2b). The P waves, QRS complexes, and T waves were not affected by the wavelet transform. The zebrafish ECG signals in scales 3, 4, 5, 6 were stronger than those of power supply, wiring, and ambient noise. The signals of low frequency noise were comparable to those of scales 8 and 9, and were selected for conversation to ECG signals, particularly the T waves.
FIGURE 2.
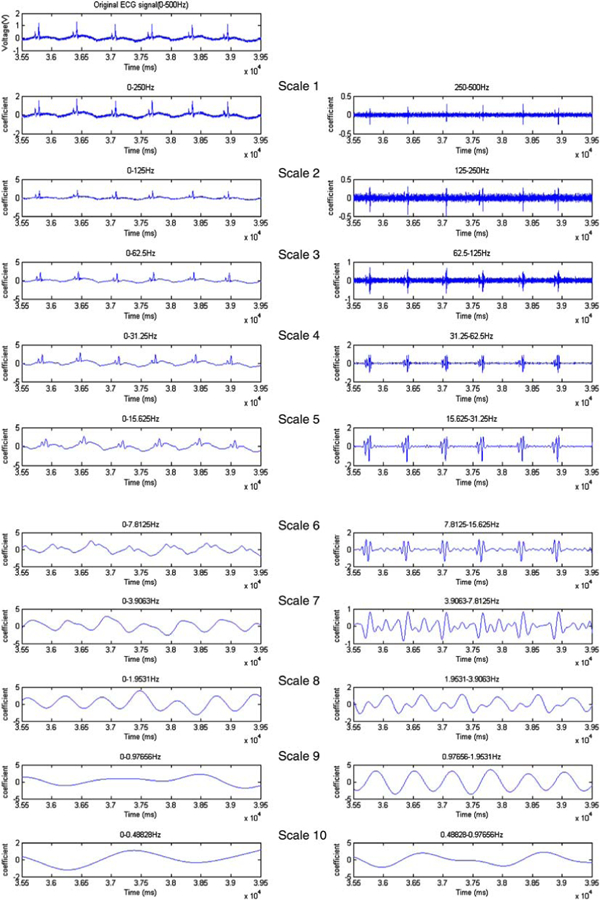
Wavelet transform. The ECG signals were sampled at a rate of 1000 Hz and were divided into 10 scales by using coif5 wavelets. In the individual scales, the signals were composed of a general component (left column), and detailed components (right column). The original ECG signals can be reconstructed by recomposing the last general component (left bottom) and the entire detailed components (right column).
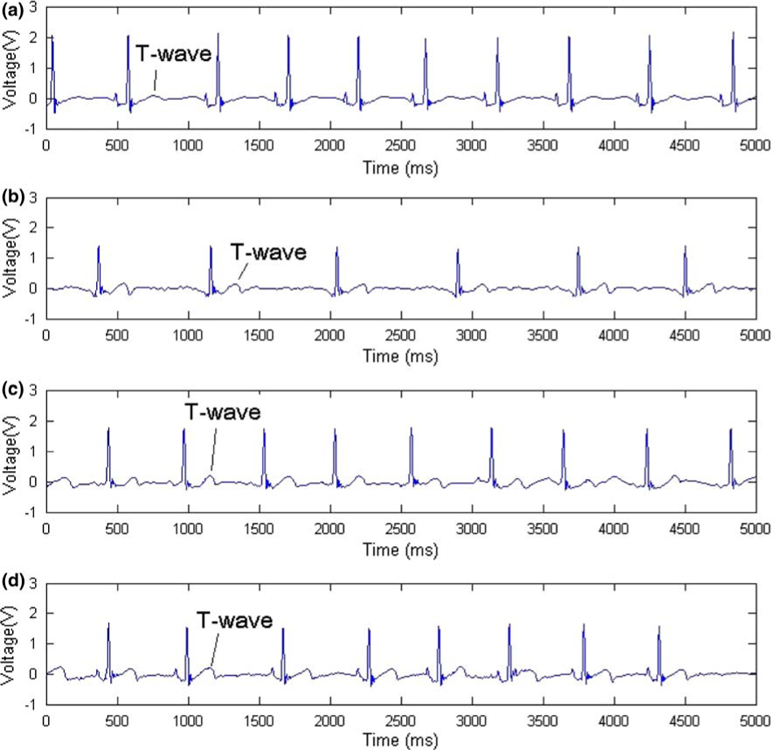
After data processing and filtering, ECG signals were obtained (Fig. 3). The wondering baseline was noticeable prior to wavelet transform (Fig. 3a). The de-noised ECG signals were obtained by using the appropriate threshold values in the individual frequency components (scales). Application of wavelet transform at threshold values between 1.9 and 62.5 Hz generated the distinct P waves, QRS complexes, and ventricular repolarization patterns or T waves (Fig. 3b). However, filtering frequency at 1.9–7.8 Hz resulted in removal of the T wave pattern (Fig. 3c).
FIGURE 3.

Wavelet transform. (a) ECG signals prior to wavelet transform. (b) Application of wavelet transform at threshold values between 1.9 and 62.5 Hz resulted in distinct P waves, QRS complexes, and ventricular repolarization patterns consistent with T waves (c) Excluding frequency between 1.9 and 7.8 Hz resulted in an elimination of ECG signals for T waves after wavelet transform.
Similar to the human ECG, electrode positions from the heart influenced the amplitude of the voltage signals. We noted that minute changes in positioning the positive electrode affected the amplitudes of P waves, QRS complexes, and T waves. Three independent trials of ECG readings were performed on each zebrafish on the same day post-amputation (Fig. 4). A moderate displacement between the positive and negative electrodes, the lateral distance from the ventral line of fish, the position of the positive electrode with respect to the heart, and the angle of the electrode needles to the surface of the zebrafish, influenced the amplitudes of P waves, QRS complexes, and T waves. The P and peaked T waves are prominent in Fig. 4a, whereas the QRS complexes are prominent in Figs. 4b and 4c. However, the position of the negative electrode did not significantly affect the ECG signals. A displacement of the negative electrode at 0.5 mm from the midline produced nearly identical results, indicating that the placement of negative electrode was not an issue affecting ECG recording. Despite the variations in P, R, and T waves, the PR, QRS, and QT intervals remained unchanged, indicating that signal processing and wavelet transform provided a reliable means to monitor for changes in ventricular repolarization intervals in zebrafish heart regeneration.
FIGURE 4.

Three ECG signals of an amputated zebrafish. Changes in positive electrode placement resulted in different ECG waveforms, the relative magnitude and polarity of P, QRS, and T waves. Determination of PR, QRS, and QT intervals were not affected by the variability in magnitudes.
Zebrafish ECG Signals Following Ventricular Amputation
Ventricular amputation was performed for repeated ECG recordings. The mean heart rate was 149 ± 18 beats/min prior to Tricane sedation, and was reduced to 90 ± 17 beats/min after sedation (n = 9 and 22, respectively) (Table 1). Prior to ventricular amputation, QTc was used to account for heart rate variability. Representative ECG signals on day 0 (prior to amputation), 1, 4, 9, and 13 dpa are shown (Fig. 5). The T waves were more prominent after ventricular amputation, reflecting changes in ventricular repolarization. Repeated ECG signals were obtained from 4 different zebrafish, 4 dpa (Fig. 6). Distinct P waves, QRS complexes, and T waves were present among the four individual fish. The histology of an uncut zebrafish heart revealed an intact ventricle and atrium with prominent ventricular trabeculae. The amputated ventricles revealed the presence of fibrin and collagen as evidenced by red and blue staining.
TABLE 1.
Heart rates in the presence and absence of tricane.
| Sample (n) | R–R interval (ms) | Heart rate (beat/min) | |
|---|---|---|---|
| No tricane | 9 | 403 ± 49.4 | 149 ± 18 |
| With tricane | 22 | 667 ± 131 | 90 ± 17 |
FIGURE 5.
Representative ECG signals prior to and post-amputation (a) prior to amputation, (b) 4 dpa, (c) 9 dpa, (d) 13 dpa. T waves became gradually prominent, suggesting changes in ventricular repolarization after ventricular amputation.
FIGURE 6.

ECG signals from 4 different zebrafish 4 dpa. (a) The histology of an uncut zebrafish heart revealed an intact ventricle and atrium. Ventricular trabeculae were more prominent in the zebrafish heart than those of humans. (b)–(e) Comparison of ECG signals from 4 individual fish with the corresponding histology at 4 dpa. Distinct P waves, QRS complexes, and T waves were present among the four individual fish. The paraffin sections were stained with acid fuchsin-orange G (ADOG), revealing the fibrin in red and collagen in blue. Both fibrin and collagen were absent in the intact ventricle. BA denoted bulbus arteriosus; A, atrium; and V, ventricle.
Analysis of PR, QRS and QTc Intervals
Analyses of the mean PR, QRS, QT and QTc intervals were performed on 6 zebrafish prior to and post-amputation (Fig. 7). The mean values of these intervals and their corresponding standard deviations were obtained in triplicates for the individual fish. Variations in intervals existed among different fish. The mean PR and QRS intervals remained unchanged prior to and post-amputation (n = 6 fish, p > 0.5). However, the QT intervals were shortened on 4 dpa (n = 6, p = 0.07), and correction for the heart rate variability supported that the QTc intervals were significantly shortened on 4 dpa (n = 6, p < 0.05). The PR and QRS intervals reflected the intact atrial and ventricular conduction, and the shortened QTc implicated changes in ventricular repolarization in response to myocardial injury. Thus, monitoring ECG signals in zebrafish provided a means to study cardiac conduction during zebrafish heart generation.
FIGURE 7.
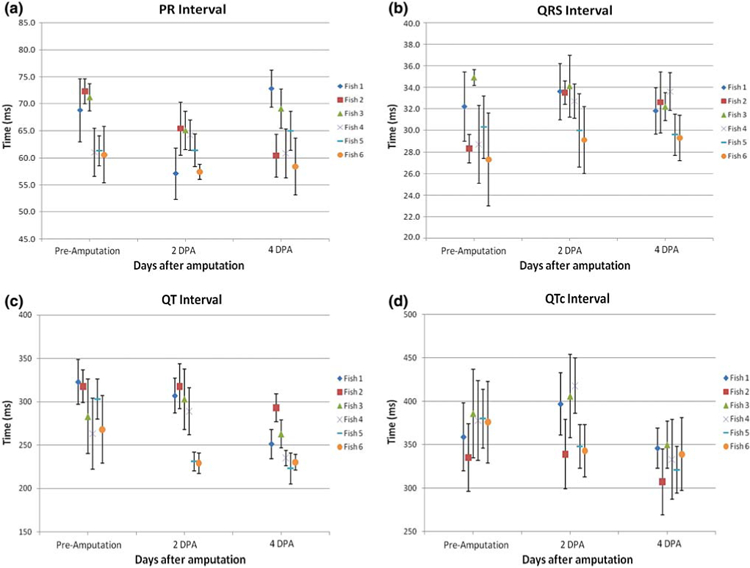
Statistical analyses of the mean PR, QRS, QT, and QTc intervals from 6 zebrafish prior to and post-amputation. (a) PR intervals remained unchanged prior to and post-amputation (n = 6, p > 0.05). (b) QRS intervals also remained unchanged (n = 6, p > 0.05). (c) QT intervals appeared to shorten 4 dpa (n = 6, p = 0.07). (d) QTc intervals were significantly shortened 4 dpa (n = 6, p < 0.05). The body lengths of fish #1–6 at ECG recording were measured to be 35, 31, 32, 34, 38, and 34 mm, respectively.
DISCUSSION
The zebrafish heart is an emergent vertebrate model for myocardial regeneration and drug screening. We demonstrated that real-time zebrafish cardiac function is visible by distinct P waves for atrial contraction, QRS complexes for ventricular depolarization, and QT intervals for ventricular repolarization prior to, and 2 and 4 days post-amputation. Despite a two-chamber heart, zebrafish demonstrate heart conduction patterns that mirror those of humans. In response to ventricular amputation, PR and QRS intervals remained intact and unchanged in 6 fish that were analyzed. Corrected QT intervals (QTc) shortened on 4 dpa, suggesting that ventricular resection alters myocardial repolarization. In parallel, histology revealed that apical thrombi were replaced with fibrin clots and collagen fibers in response to amputation. While atrial arrhythmia was recorded after prolonged sedation, ventricular tachycardia or fibrillation was not observed in this study. Human myocardium scars and remodels in response to acute coronary syndromes; zebrafish heart muscle regenerates in the absence of scar formation and ventricular remodeling.17 Thus, we have developed a reliable technique to assess changes in QT intervals for a longitudinal study.
We reported that ventricular amputation led to a shortened QTc interval without affecting the PR and QRS intervals from non-anesthetized and non-paralyzed adult zebrafish. In vivo recording of an adult zebrafish electrocardiogram and assessment of drug-induced QT prolongation were first made possible by eliminating the motion artifacts with a paralytic dose of μ-conotoxin GIIIB.13 In our study, ECG signals were recorded from the mildly sedated fish without oral perfusion and muscle paralysis. Despite gill motion, reproducible ECG signals were generated by signal processing and wavelet transform. Milan et al. reported that agents known to induce QT prolongation in humans led to QT prolongation in zebrafish.13 Using the zebrafish model for long QT syndromes in humans, Arnaout et al. demonstrated that mutation in the kcnh2 gene, which encodes the channel responsible for the rapidly activating delayed rectifier current (IKr) and accounts for 45% of long QT syndrome,1 resulted in the inability of zebrafish to generate action potentials and disruption of calcium release. While kcnh2 mutation was lethal in homozygous embryonic zebrafish, heterozygous kcnh2 mutation manifested delayed ventricular repolarization and prolonged QTc intervals in anesthetized, paralyzed adult zebrafish.1 While normal function of channels, receptors, and cytoskeletal proteins contributed to repolarization of the cardiac myocytes, the shortened QTc interval suggests an alteration in repolarization in response to ventricular resection.
Zebrafish hearts share common structures with mammalian hearts, serving as a model for vertebrate animal studies. Histological studies show that the ventricle of an adult zebrafish heart is composed of trabecular and compact myocardium, and surrounded by epicardium and endocardium (ref-textbook). Sedmera et al. reported that the spread of excitation wave that occurred through the atrium was uniform. Furthermore, the apex-to-base ventricular activation pattern was also observed in higher vertebrates in the apparent absence of conduction fascicles or a functional equivalent of the His-Purkinje system.20 Thus, our ECG signals support the notion of atrial excitation, followed by ventricular contraction and repolarization.
Unlike mammals, zebrafish hearts have remarkable regenerative abilities. Zebrafish heart regeneration occurs over a period of 2 months.17 In response to amputation, thrombosis immediately develops and nascent cardiomyocytes replace the vast majority of the lost ventricular tissue by 30 dpa and the structure of the ventricle is fully restored at 60 dpa without scar tissue.17 Activation of the regenerative potential of human heart tissue implicates a novel therapeutic approach to supplement or replace conventional pharmacotherapy and mechanical intervention. Despite the lack of scar tissue, whether ventricular arrhythmia occurs during the regeneration process has posed an interesting question. In this context, investigating the cardiac electrophysiology and mechanics of the regenerating zebrafish heart by the use of micro-electrodes (ECG) translates our tools to the zebrafish research community and small animal research.
Adult zebrafish are typically one inch in length. In comparison to other vertebrate models such as mice, the small size of zebrafish has both advantages and disadvantages. One of the advantages is that large numbers of fish can be housed in limited space for high throughput experiments. However, the relatively small size of zebrafish renders it challenging to perform physiological studies. Our micro-ECG approach aims to assist the zebrafish communities in academics, national labs or pharmaceutical industry. The equipment can be applied to physiological studies of adult hearts as well as genetic/molecular characterization and drug screening. We believe that the cost-to-benefit ratio will favor the application of user-friendly micro-ECG to study a large number of zebrafish hearts.
Understanding heart regeneration in a vertebrate model system is highly relevant to public health concern. Coronary heart disease is among the leading causes of morbidity and mortality in United States and worldwide. Myocardial infarction (MI) results in irreversible loss of cardiomyocytes in the heart.19 Injured human hearts heal by scarring, which leads to remodeling and heart failure.11 In contrast to mammals, zebrafish fully regenerate myocardium after 20% ventricular resection without scarring,17,18 thereby providing a genetically tractable model system to investigate molecular mechanisms of heart regeneration.
Encouraging results from our labs and others14 have demonstrated the feasibility of monitoring the zebrafish heart by the use of micro-ECG. Despite variations in amplitudes, PR, QRS, and QT intervals remain unchanged in each individual fish. In addition to zebrafish regeneration, our methodology provides an essential tool to assess the electrophysiological outcome of genetic, mechanical, or pharmacological perturbation to the heart. In fact, our ultimate goal is to disseminate the use of micro-ECG technology to the zebrafish research community and small animal research laboratories.
ACKNOWLEDGMENTS
The authors would like to express gratitude to Calum MacRae from Massachusetts General Hospital, Harvard Medical School for his advice on zebrafish ECG measurement. This project was supported by USC Zumberge Interdisciplinary Research Award (TKH), and NHLB 083015 (TKA), NHLBI 068689 (TKH), and AHA GIA 0655051Y (TKH), AHA Science Development Award (CLL).
REFERENCES
- 1.Arnaout R, Ferrer T, Huisken J, Spitzer K, Stainier DY, Tristani-Firouzi M, and Chi NC Zebrafish model for human long QT syndrome. Proc. Natl. Acad. Sci. U.S.A 104:11316–11321, 2007. doi: 10.1073/pnas.0702724104. [DOI] [PMC free article] [PubMed] [Google Scholar]
- 2.Becker RO, Chapin S, and Sherry R Regeneration of the ventricular myocardium in amphibians. Nature 248: 145–147, 1974. doi: 10.1038/248145a0. [DOI] [PubMed] [Google Scholar]
- 3.Braunwald E, Zipes DP, Libby P, and Bonow R Braunwald’s Heart Disease: A Textbook of Cardiovascular Medicine. 7th ed. Philadelphia: Saunders Company, 2004. [Google Scholar]
- 4.Braunwald EE, Zipes DPE, Libby PE, and Bonow RE Braunwald’s Heart Disease: A Textbook of Cardiovascular Medicine. 5th ed. Philadelphia: Saunders Company, p. 114, 2004. [Google Scholar]
- 5.Burrus CS, Gopinath RA, and Guo H Introduction to Wavelets and Wavelet Transforms: A Primer. Upper Saddle River, NJ: Prentice-Hall, 1997. [Google Scholar]
- 6.Daubechies I Ten Lectures on Wavelets. Philadelphia, PA: Soc. Indus. Appl. Math., 1992. [Google Scholar]
- 7.Donoho DL De-noising by soft-thresholding. IEEE Trans. Inform. Theory 41:613–627, 1995. doi: 10.1109/18.382009. [DOI] [Google Scholar]
- 8.Forouhar AS, Hickerson A, Liebling M, Moghaddam A, Lu J, Tsai H-J, Hove JR, Fraser SE, Dickinson M, and Gharib M The embryonic vertebrate heart tube is a dynamic suction pump. Science 312:751–753, 2006. doi: 10.1126/science.1123775. [DOI] [PubMed] [Google Scholar]
- 9.Forouhar AS, Hove JR, Calvert C, Flores J, Jadvar H, and Gharib M Electrocardiographic characterization of embryonic zebrafish. Conf. Proc. IEEE Eng. Med. Biol. Soc 5:3615–3617, 2004. [DOI] [PubMed] [Google Scholar]
- 10.Glantz SA Primer of Biostatistics, 6th ed. McGraw-Hill, pp. 386–388, 2005. [Google Scholar]
- 11.Hahn C, and Schuwartz MA The role of cellular adaptation to mechanical forces in atherosclerosis. Arterioscler. Thromb. Vasc. Biol 28:2101–2107, 2008. doi: 10.1161/ATVBAHA.108.165951. [DOI] [PMC free article] [PubMed] [Google Scholar]
- 12.Hove JR, Köster RW, Forouhar AS, Acevedo-Bolton G, Fraser SE, and Gharib M Intracardiac fluidforces are an essential epigenetic factor for embryonic cardiogenesis. Nature 421:172–177, 2003. doi: 10.1038/nature01282. [DOI] [PubMed] [Google Scholar]
- 13.Milan DJ, Jones IL, Ellinor PT, and MacRae CA In vivo recording of adult zebrafish electrocardiogram and assessment of drug-induced QT prolongation. Am. J. Physiol. Heart Circ. Physiol 291:H269–H273, 2006. doi: 10.1152/ajpheart.00960.2005. [DOI] [PubMed] [Google Scholar]
- 14.Milan DJ, and MacRae CA Animal models for arrhythmias. Cardiovasc. Res 67:426–437, 2005. doi: 10.1016/j.cardiores.2005.06.012. [DOI] [PubMed] [Google Scholar]
- 15.Nusslein-Volhard C, and Dahm R (Editors), Zebrafish. New York: Oxford University Press, 2002. [Google Scholar]
- 16.Oberpriller JO, and Oberpriller JC Response of the adult newt ventricle to injury. J. Exp. Zool 187:249–253, 1974. doi: 10.1002/jez.1401870208. [DOI] [PubMed] [Google Scholar]
- 17.Poss KD, Wilson LG, and Keating MT Heart regeneration in zebrafish. Science 298:2188–2190, 2002. doi: 10.1126/science.1077857. [DOI] [PubMed] [Google Scholar]
- 18.Raya A, Consiglio A, Kawakami Y, Rodriguez-Esteban C, and Izpisua-Belmonte JC The zebrafish as a model of heart regeneration. Cloning Stem Cells 6:345–351, 2004. doi: 10.1089/clo.2004.6.345. [DOI] [PubMed] [Google Scholar]
- 19.Reeve JL, Duffy AM, O’Brien T, and Samali A Don’t lose heart—therapeutic value of apoptosis prevention in the treatment of cardiovascular disease. J. Cell Mol. Med 9:609–622, 2005. doi: 10.1111/j.1582-4934.2005.tb00492.x. [DOI] [PMC free article] [PubMed] [Google Scholar]
- 20.Sedmera D, Reckova M, deAlmeida A, Sedmerova M, Biermann M, Volejnik J, Sarre A, Raddatz E, McCarthy RA, Gourdie RG, and Thompson RP Functional and morphological evidence for a ventricular conduction system in zebrafish and Xenopus hearts. Am. J. Physiol. Heart Circ. Physiol 284:H1152–H1160, 2003. [DOI] [PubMed] [Google Scholar]
- 21.Stainier DY Zebrafish genetics and vertebrate heart formation. Nat. Rev. Genet 2:39–48, 2001. doi: 10.1038/35047564. [DOI] [PubMed] [Google Scholar]
- 22.Szilagyi SM, and Szilagyi L Wavelet transform and neural-network-based adaptive filtering for QRS detection. In: Proceedings of the 22nd Annual International Conference of the IEEE, Vol. 2, 2000, pp. 1267–1270. [Google Scholar]