

Abstract
The purpose of this study was to measure the heterogeneity in human umbilical cord–derived mesenchymal stem cells (hUC‐MSCs) and human synovial fluid–derived mesenchymal stem cells (hSF‐MSCs) by single‐cell RNA‐sequencing (scRNA‐seq). Using Chromium™ technology, scRNA‐seq was performed on hUC‐MSCs and hSF‐MSCs from samples that passed our quality control checks. In order to identify subgroups and activated pathways, several bioinformatics tools were used to analyse the transcriptomic profiles, including clustering, principle components analysis (PCA), t‐Distributed Stochastic Neighbor Embedding (t‐SNE), gene set enrichment analysis, as well as Gene Ontology (GO) and Kyoto Encyclopedia of Genes and Genomes (KEGG) analyses. scRNA‐seq was performed on the two sample sets. In total, there were 104 761 163 reads for the hUC‐MSCs and 6 577 715 for the hSF‐MSCs, with >60% mapping rate. Based on PCA and t‐SNE analyses, we identified 11 subsets within hUC‐MSCs and seven subsets within hSF‐MSCs. Gene set enrichment analysis determined that there were 533, 57, 32, 44, 10, 319, 731, 1037, 90, 25 and 230 differentially expressed genes (DEGs) in the 11 subsets of hUC‐MSCs and 204, 577, 30, 577, 16, 57 and 35 DEGs in the seven subsets of hSF‐MSCs. scRNA‐seq was not only able to identify subpopulations of hUC‐MSCs and hSF‐MSCs within the sample sets, but also provided a digital transcript count of hUC‐MSCs and hSF‐MSCs within a single patient. scRNA‐seq analysis may elucidate some of the biological characteristics of MSCs and allow for a better understanding of the multi‐directional differentiation, immunomodulatory properties and tissue repair capabilities of MSCs.
Keywords: DEGs, hSF‐MSCs, hUC‐MSCs, ScRNA‐seq, subpopulations
1. INTRODUCTION
Mesenchymal stem cells (MSCs) can differentiate into bone, cartilage and fat cells, which play important roles in development, homeostasis, post‐natal growth, repair and regeneration.1, 2 Because of their ability to self‐renew with a high proliferation rate, MSCs are a common source of stem cells in clinical applications to regenerate damaged organs and tissues.3, 4 Numerous studies indicate that the major sources for MSCs in the clinical setting are adipose tissue and bone marrow; however, these resources are limited because there are strict donor requirements.5, 6, 7 Therefore, alternative sources obtained from neonatal or primitive tissues, such as the amnion, placenta, synovial fluid and umbilical cord, have been explored.2, 8, 9, 10
The umbilical cord (UC) is an attractive source of MSCs as it can be obtained by non‐invasive methods without harm to mothers or their children.11 The UC possesses immunosuppressive activity and produces an abundance of MSCs.12, 13 UC‐derived MSCs (UC‐MSC) are one type of multipotent adult stem cell, which has the potential to differentiate into various cell types, thereby making these cells a possible resource for cell‐based therapies. Human umbilical cord‐derived mesenchymal stem cells have some characteristics in common with MSCs obtained from adipose tissue and bone marrow, including a fibroblastoid morphology and a similar set of surface proteins, as well the ability to differentiate into different cell types.14, 15
Previous studies have shown that MSCs also exist in synovial fluid (SF).16, 17 In the presence of an injury or osteoarthritis, the number of MSCs from SF increases significantly in order to help recruit mesenchymal progenitor cells to promote spontaneous healing and restore homeostasis.17 SF‐derived MSCs (SF‐MSCs) are a viable option for syngeneic transplantation for cartilage regeneration.18, 19 SF‐MSCs are ideal for clinical applications because SF can be obtained arthroscopically without the donor undergoing invasive surgery.
In recent years, single‐cell genomics has become an incredibly powerful tool to help uncover the genetic structure and population dynamics of unicellular organisms,20, 21, 22, 23 as well as cancer cells,24 and has provided insight into the developmental lineages25 in multicellular organisms. Single‐cell RNA‐sequencing (scRNA‐seq) can be used to analyse differences in the transcriptome of various cells,26, 27 discover novel cell types and provide insights into the regulatory networks that function in ontogenetic development.28 scRNA‐seq is an efficient method for analysing changes in gene expression, and it has been performed successfully in many different tissue types.29, 30, 31 In order to uncover information about the subpopulations that exist in MSCs and analyse the differentially expressed genes (DEGs) of these subgroups, we used scRNA‐seq to perform transcriptomic profiling in hUC‐MSCs and hSF‐MSCs. Furthermore, using clustering, principle components analysis (PCA), t‐Distributed Stochastic Neighbor Embedding (t‐SNE), gene set enrichment analysis, Gene Ontology (GO) and Kyoto Encyclopedia of Genes and Genomes (KEGG) analyses, we were able to identify subgroups and activated pathways within these populations of MSCs.
2. MATERIALS AND METHODS
2.1. Ethics statement
This study was conducted using protocols approved by the Ethical Committee of the Shenzhen People's Hospital. Informed consents were obtained from all participants.
2.2. Isolation and culture of hUC‐MSCs
Under sterile conditions, UC units (8‐10 cm) were collected from the puerpera of full‐term deliveries and were immediately saved in cold saline (0°C). The blood vessels and outer membrane were removed by surgical blades, and the Wharton jelly (WJ) tissue was cut using eye scissors. The minced tissues were then placed in a 10‐cm culture dish at 1‐cm intervals and were maintained in culture medium (MesenGro Medium supplemented with 10% FBS, 1% penicillin‐streptomycin and 10% MesenGro Supplement) at 37°C with 5% CO2 and 90% RH. After 48 hours, the medium was removed to eliminate non‐adherent cells and replaced with fresh medium. The complete culture medium was changed every 3 days. We selected distinct cell subpopulations, and we assumed that these subpopulations were efficient and sustainable. Colonies smaller than 2 mm in diameter were ignored. The clustered hUC‐MSCs were digested with trypsin and resuspended with complete culture medium at a density of 2.0 × 10⁴ cells/cm2 into a 25‐mm2 vented culture bottle. The CD90+ hUC‐MSCs were collected by immunomagnetic beads and were identified under more stringent measures. After approximately three generations, the hUC‐MSCs were sterilely obtained to prepare a monoplast suspension of more than 6.0 × 10⁵ cells, with a survival rate >90% and cell diameter <30 μm. The hUC‐MSCs samples were then sent to GENERGY BIO (Shanghai, China) for scRNA‐seq analysis.
2.3. Isolation and culture of hSF‐MSCs
The samples were collected during arthroscopic procedures from patients suffering from an intra‐articular ligament injury of the knee joint. Isotonic saline solution was injected into the joint, the knee was moved several times, and then, SF (50‐100 mL) mixed with saline solution was collected in γ‐sterilized centrifuge tubes. Within 1‐4 hours, the fluid was filtered with a cell strainer (40 μm nylon) to remove debris. The filtered fluid was gathered in γ‐sterilized centrifuge tubes and centrifuged at 405 g for 10 minutes at room temperature. The cell pellet was resuspended in culture medium (MesenGro Medium supplemented with 10% FBS, 1% penicillin‐streptomycin and 10% MesenGro Supplement) and plated in 100‐mm dishes after centrifugation. After 48 hours, the medium was withdrawn to remove non‐adherent cells and replaced with fresh medium. The complete culture medium was changed every 3 days. We selected distinct cell subpopulations and assumed that these units were efficient and sustainable. The colonies smaller than 2 mm in diameter were discarded using a cell scraper (Corning Inc). Then, the distinct cell subpopulation was digested in cloning cylinders (Sigma‐Aldrich) and used to inoculate a new dish as passage 1. Passage 3 (P3) cells were used for the scRNA‐seq analysis.
2.4. The scRNA‐seq analysis
The hUC‐MSCs and hSF‐MSCs samples were sent to GENERGY BIO for scRNA‐seq analysis (Figure 1) by following previously published protocols.29, 31 Briefly, cell counting was performed using a Countess® II Automated Cell Counter and cell concentration was adjusted to 1.0 × 10⁶ cells/mL. Cellular suspensions were placed on a Chromium™ Single‐Cell Instrument (10 × Genomics) to obtain single‐cell Gel bead in EMulsion (GEM). ScRNA‐seq libraries were prepared using the Chromium™ Single‐Cell Bead and Library Kit. cDNA was sheared to 200 bp using a Covaris M220 (Covaris). Sequencing libraries were constructed using the Chromium™ Single‐Cell Library Kit, following these steps: end repair and A‐tailing, adapter ligation, post‐ligation cleanup with SPRIselect, and sample index PCR and cleanup. The barcode sequencing libraries were quantified using qPCR.
Figure 1.
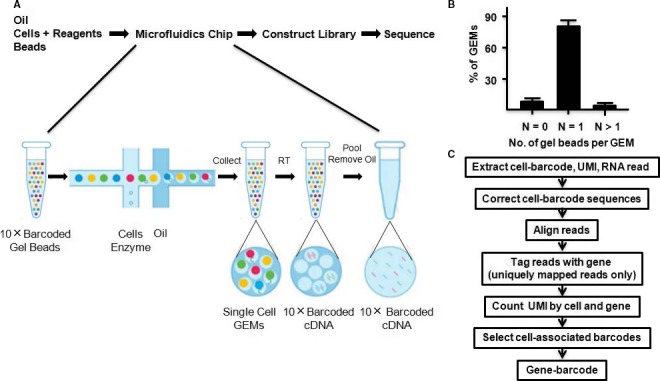
10 × Genomics single‐cell technology enables the profiling of RNAs from thousands of single cells simultaneously. Cells were combined with reagents in one channel of a chip. Reverse transcription took place inside each GEM, after which cDNAs were pooled to perform amplification and library construction in bulk. Gel beads loaded with primers and barcoded oligonucleotides were first mixed with cells and reagents, and subsequently mixed with oil‐surfactant solution at a microfluidic junction. Single‐cell GEMs were collected in the GEM outlet. Finished library molecules consisted of Illumina adapters and sample indices, which allowed for pooling and sequencing of multiple libraries on a next‐generation short read sequencer
The Cell Ranger Single‐Cell Software Suite was used to perform sample demultiplexing, barcode processing and single‐cell gene counting. First, sample demultiplexing was performed to generate FASTQs for the paired‐end Read1 and Read2. Second, Chromium™ barcodes and unique molecular identifiers (UMIs) were filtered. Third, PCR was marked if read pairs matched with a barcode sequence, a UMI tag and a gene ID. Cell barcodes were determined based on the distribution of UMI counts. The number of reads that provided valid information was determined based on whether the reads had the following four characteristics: valid barcodes, a valid UMI, a cell barcode and the ability to be confidently mapped to exons. Sequencing data could be combined by counting non‐duplicated reads and subsampled to obtain a given number of UMI counts per cell.
The gene‐cell‐barcode matrix was concatenated. Only genes with at least one UMI count detected in at least one cell were used. Unique molecular identifier normalization was performed by first dividing UMI counts, followed by multiplication by the median total UMI counts across all cells. Each gene was normalized such that its mean signal was 0, and standard deviation was 1. Principle components analysis was run on the normalized gene‐barcode matrix. The normalized UMI counts of each gene were used to show expression of a marker in a t‐SNE plot.
To identify genes that were enriched in a specific cluster, the mean expression of each gene was calculated across all cells in the cluster. Each gene from the cluster was then compared to the median expression of the same gene in all other cell clusters. Genes were ranked based on their expression difference, and the top 10 enriched genes from each cluster were selected. For hierarchical clustering, pair‐wise correlation between each cluster was calculated, and centred expression of each gene was used to generate a heat map. Gene Ontology and KEGG term information was downloaded from the UniProtKB database. Both GO and KEGG terms with a P‐value < .05 were considered to be significantly enriched.
2.5. Statistical analysis
Data are available at http://support.10%D7genomics.com/single-cell/datasets, and the analysis code is available at https://github.com/10%D7Genomics/single-cell-3prime-paper.
3. RESULTS
3.1. The scRNA‐seq profiles of hUC‐MSCs and hSF‐MSCs by 10 × Genomics
For our scRNA analysis, we obtained 1597 cells and 1259 cells from hUC‐MSCs and hSF‐MSCs samples, respectively (Table 1). The sequencing saturation for hUC‐MSCs and hSF‐MSCs samples was 43.4% and 18.1%, respectively (Table 1). In hUC‐MSCs, 17 317 genes were detected, with a median of 18 304 UMI Counts per cell, and an average of 65 598 reads per cell (Table 1). There were 104 761 163 reads from hUC‐MSCs, of which, 86.2% had valid barcodes (Table 1). After mapping to the human genome, 78.2% of the reads mapped confidently to the transcriptome, with 81.8% of those reads mapping to exonic regions, 5.9% to intronic regions and 2.1% to intergenic regions (Table 1). In hSF‐MSCs, 16 996 genes were detected, with a median of 12 609 UMI Counts per cell, and an average of 52 245 reads per cell (Table 1). There were 6 577 715 reads from hSF‐MSCs, with 70.4% of those reads containing valid barcodes (Table 1). After mapping to the human genome, 60.4% of those reads mapped confidently to transcriptome, with 63.1% of those reads mapping to exonic regions, 8.1% to intronic regions and 2.6% to intergenic regions (Table 1).
Table 1.
Summary of single cells sequencing by 10 × Genomics
| hUC‐MSCs | hSF‐MSCs | |
|---|---|---|
| Cells | ||
| Estimated number of cells | 1597 | 1259 |
| Fraction reads in cells | 81.2% | 77.8% |
| Mean reads per cell | 65 598 | 52 245 |
| Median genes per cell | 3333 | 2954 |
| Total genes detected | 17 317 | 16 996 |
| Median UMI counts per cell | 18 304 | 12 609 |
| Sequencing | ||
| Number of reads | 104 761 163 | 65 777 15 |
| Valid barcodes | 86.2% | 70.4% |
| Reads mapped confidently to transcriptome | 78.2% | 60.4% |
| Reads mapped confidently to exonic regions | 81.8% | 63.1% |
| Reads mapped confidently to intronic regions | 5.9% | 8.1% |
| Reads mapped confidently to intergenic regions | 2.1% | 2.6% |
| Sequencing saturation | 43.4% | 18.1% |
| Q30 bases in barcode | 47.2% | 29.6% |
| Q30 bases in RNA read | 89.2% | 62.2% |
| Q30 bases in sample index | 89.0% | 70.9% |
| Q30 bases in UMI | 92.6% | 67.5% |
| Sample | ||
| Transcriptome | GRCh38 | |
| Chemistry | Single Cell 3' v1 | |
| Cell ranger version | 1.2.0 | |
3.2. Subpopulation discovery in hUC‐MSCs and hSF‐MSCs samples
The Chromium™ single‐cell technology can also be used for scRNA‐seq of primary cells. We isolated more than 1000 cells from hUC‐MSCs and hSF‐MSCs. Gene‐cell matrices from hUC‐MSCs and hSF‐MSCs were concatenated, and PCA was performed to reduce dimensionality before performing clustering and t‐SNE analysis. Based on our PCA and t‐SNE results, there were 11 clusters present in hUC‐MSCs and 7 in hSF‐MSCs (Figures 2 and 3).
Figure 2.
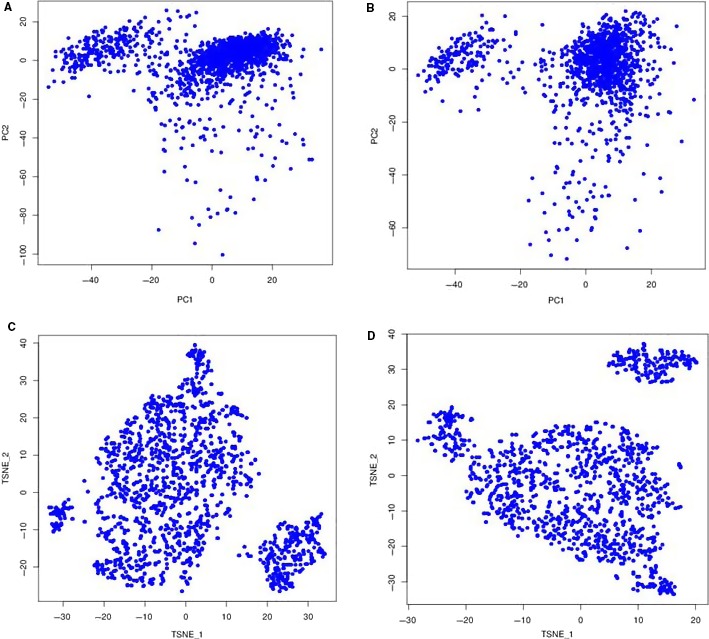
The principle components analysis (PCA) and t‐Distributed Stochastic Neighbor Embedding (t‐SNE) for hUC‐MSCs and hSF‐MSCs. A, PCA for hUC‐MSCs, B, PCA for hSF‐MSCs, C, t‐SNE for hUC‐MSCs, D, t‐SNE for hSF‐MSCs
Figure 3.
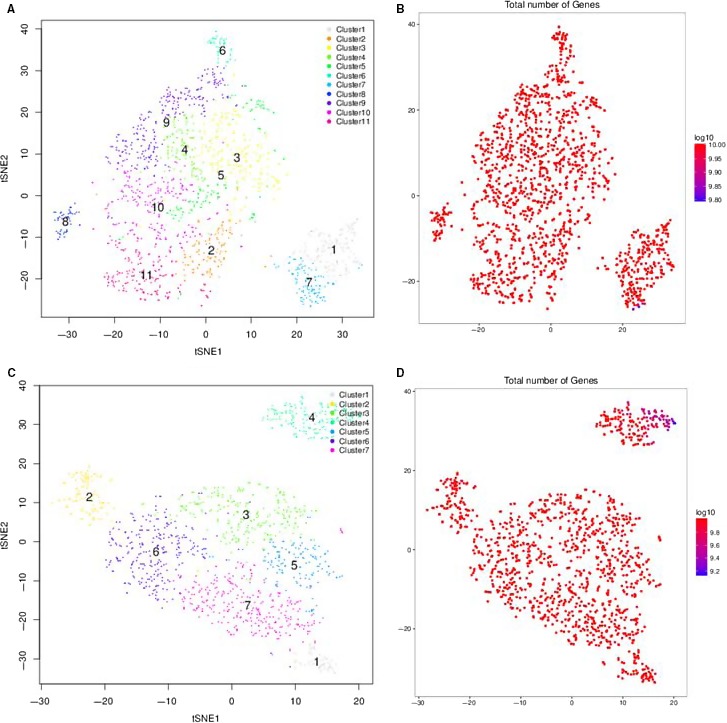
Subpopulation discovery in hUC‐MSCs (A‐B) and hSF‐MSCs (C‐D) by t‐SNE analysis. Based on our PCA and t‐SNE results, there were 11 clusters present in hUC‐MSCs and 7 in hSF‐MSCs
3.3. The DEG profile of hUC‐MSCs and hSF‐MSCs samples
By comparing gene expression profiles between subpopulations in hUC‐MSCs, we identified 533 DEGs in cluster 1 (76 up‐regulated and 457 down‐regulated), 57 in cluster 2 (12 up‐regulated and 45 down‐regulated), 32 in cluster 3 (28 up‐regulated and four down‐regulated), 44 in cluster 4 (41 up‐regulated and three down‐regulated), 10 in cluster 5 (seven up‐regulated and three down‐regulated), 319 in cluster 6 (286 up‐regulated and 31 down‐regulated), 731 in cluster 7 (53 up‐regulated and 678 down‐regulated), 1037 in cluster 8 (424 up‐regulated and 613 down‐regulated), 90 in cluster 9 (89 up‐regulated and one down‐regulated), 25 in cluster 10 (24 up‐regulated and one down‐regulated) and 230 in cluster 11 (31 up‐regulated and 199 down‐regulated) (Tables 2 and 3). In hSF‐MSCs, there were 204 DEGs in cluster 1 (185 up‐regulated and 19 down‐regulated), 577 in cluster 2 (129 up‐regulated and 448 down‐regulated), 30 in cluster 3 (20 up‐regulated and 10 down‐regulated), 577 in cluster 4 (43 up‐regulated and 534 down‐regulated), 16 in cluster 5 (14 up‐regulated and two down‐regulated), 57 in cluster 6 (51 up‐regulated and down down‐regulated) and 35 in cluster 7 (32 up‐regulated and three down‐regulated) (Tables 2 and 4).
Table 2.
Differentially expressed genes in each cluster of hUC‐MSCs and hSF‐MSCs
| hUC‐MSCs | Differentially expressed genes | hSF‐MSCs | Differentially expressed genes | ||||
|---|---|---|---|---|---|---|---|
| Up‐regulated | Down‐regulated | Total | Up‐regulated | Down‐regulated | Total | ||
| Cluster 1 | 76 | 457 | 533 | Cluster 1 | 185 | 19 | 204 |
| Cluster 2 | 12 | 45 | 57 | Cluster 2 | 129 | 448 | 577 |
| Cluster 3 | 28 | 4 | 32 | Cluster 3 | 20 | 10 | 30 |
| Cluster 4 | 41 | 3 | 44 | Cluster 4 | 43 | 534 | 577 |
| Cluster 5 | 7 | 3 | 10 | Cluster 5 | 14 | 2 | 16 |
| Cluster 6 | 286 | 31 | 319 | Cluster 6 | 51 | 6 | 57 |
| Cluster 7 | 53 | 678 | 731 | Cluster 7 | 32 | 3 | 35 |
| Cluster 8 | 424 | 613 | 1037 | ||||
| Cluster 9 | 89 | 1 | 90 | ||||
| Cluster 10 | 24 | 1 | 25 | ||||
| Cluster 11 | 31 | 199 | 230 | ||||
Table 3.
Differentially expressed genes in each cluster of hUC‐MSCs
| hUC‐MSCs | Up‐regulated | Down‐regulated |
|---|---|---|
| Cluster 1 | COTL1; PRDX1; CAPN2; ATP5B; VIM; ACTB; ACTG1; VDAC1; PGK1; ANXA1 | HERPUD1; CYR61; MALAT1; NEAT1; ATP2B1; H3F3B; THBS1; COL1A2; COL1A1; FN1 |
| Cluster 2 | TUBA1B; CCT8; ATP5A1; LDHB; VIM; TUFM; C4orf3; TAGLN | FDPS; ATP5B; HSPA5; PDIA3; COL6A1; SAT1; BRI3; CDKN1A; NEAT1; GADD45A; ANKRD1; LINC00152 |
| Cluster 3 | CDKN1A; FHL2; ADM; MALAT1; H3F3B; RPL22L1; TNFRSF12A; TGFBI; NUPR1; MEST | MGLL; PPP1R14B; SNA12; IER3 |
| Cluster 4 | S100A16; POSTN; TGFBI; SAA1; PELO; BDNF; CTGF; ANKRD1; ACAT2; CTHRC1 | PPME1; CITED2; PDLIM1 |
| Cluster 5 | DDIT4; INSIG1; HERPUD1; ATP2B1; MALAT1; TGFBI; TAGLN |
PTMA; H3F3B; MGST3 |
| Cluster 6 | H2AFZ; HMGB1; PTTG1; STMN1; KIAA0101; H;IST1H4C; TUBB4B; HMGB2; SMC4; CCNB1 | CDKN2A; IFITM3; C4orf3; TAGLN; GLRX; SAT1; S100A13; SELM; FTL; FTH1 |
| Cluster 7 | EEF1A1; COTL1; RPL31; RPL21; VIM; PDIA3; TGFBI; POSTN; TFPI2; CD59 | CYR61; MALAT1; NEAT1; NNMT; HERPUD1; TUBA1A; TUBA1B; KRT10; H3F3B |
| Cluster 8 | PDIA3; MALAT1; NEAT1; FN1; COL1A1; COL3A1; MT‐ATP6; MT‐CO2; MT‐CO3; MT‐CO1 | TPT1; RPS20; RPL12; RPL29; RPL37; RPS12; RPS15A; RPS8; RPL32; RPL18A |
| Cluster 9 | RPL21; HERPUD1; CYR61; UBC; HSPA5; PCOLCE; MSMO1; ACAT2; TUBA1B; TUBA1A | MALAT1 |
| Cluster 10 | S100A16; HMGA1; ANKRD1; COL4A2; COL1A1; NEAT1; MALAT1; NUPR1; DCN; IGFBP7 | COL8A1 |
| Cluster 11 | GHITM; ARF4; VDAC1; ANXA1; YWHAQ; HSP90AA1; ITM2B; RTN4; CNN3 | MEG3; MALAT1; NEAT1; COL6A2; COL6A1; MT‐ATP6; MT‐CO3; FLNA; COL1A1; FN1; STRAP |
Table 4.
Differentially expressed genes in each cluster of hSF‐MSCs
| hSF‐MSCs | Up‐regulated | Down‐regulated |
|---|---|---|
| Cluster 1 | HMGB1; STMN1; H2AFZ; KIAA0101; PTTG1; CKS2; HIST1H4C; TYMS; HMGB2; UBE2C | CDKN2A; FTH1; NUPR1; TGFBI; PAPPA; PSAP; NEAT1; FN1; GAS6; POSTN |
| Cluster 2 | MALAT1; NEAT1; MT‐ND3; MT‐ND2; MT‐ATP6; MT‐CYB; MT‐CO2; MT‐ND4; MT‐CO3; MT‐CO1 | TPT1; FTL; FTH1; TMSB4X; RPL29; RPL23A; RPS12; RPL32; RPL12; RPL18A |
| Cluster 3 | FTH1; MGLL; SRPX; CD59; ANXA2; S100A4; PGLDA2; C12orf75 | CXCL1; SOX4; NEAT1; MALAT1; FN1; COL1A1; DCN; GJA1; PTGDS; SERPINE1; TUBA1B; CAV1 |
| Cluster 4 | FKBP1A; POLR2L; TXN; S100A11; S100A6; YBX1; RPL31; RPLP0; CD59; ACTB | MALAT1; NEAT1; FN1; COL1A1; COL1A2; EMP1; H3F3B; KRT10; CYR61; TUBA1A |
| Cluster 5 | POSTN; GAS6; NDUFA4L2; SCG5; RPL22L1; CXCL3; CXCL1; CXCL8; INSIG1; H3F3B | LMO4; TUBA1B |
| Cluster 6 | DCBLD2; FRMD6; HIF1A; NEAT1; TGFBI; GREM1; ADAMTS1; CCDC80; SERPINE1; PLOD2 | LGALS3; B2M; PCOLCE; PPIB; TIMP1; CD63 |
| Cluster 7 | NDUFA4L2; TGFBI; PAPPA; S100A4; CAPG; TNFRSF12A; MGLL; LDHA; LGALS3; S100A16 | H3F3B; CALM2; TUBA1B |
3.4. GO function analysis of hUC‐MSCs and hSF‐MSCs samples
The three main categories for GO function analysis are biological process, cellular component and molecular function. As shown in Figure 4, the DEGs found in hUC‐MSCs were significantly enriched in the following biological processes and molecular functions: cholesterol biosynthesis, calcium‐transporting ATPase activity, corticosterone response, cholesterol biosynthesis, collagen trimer, cyclin‐dependent protein kinase, DNA metabolism, double‐stranded RNA binding, glutathione peroxidase activity, growth factor activity, heparin binding, integrin binding, macromolecular complex binding, MHC class I protein binding, negative regulation of cargo loading, PCNA‐p21 complex, platelet‐derived growth factor binding, protein binding, protein folding, peptide biosynthetic process, protein complex binding, protein targeting to ER, post‐transcriptional regulation of gene expression, regulation of apoptotic process, regulation of cell death, regulation of cellular amino acid metabolism, RNA binding, RNA splicing, ribonucleoprotein complex, secondary alcohol biosynthetic process, SREBP‐SCAP‐Insig complex, SRP‐dependent cotranslational protein, translation, structural molecule activity, transcription factor activity, transcription corepressor activity and unfolded protein binding. Additionally, GO term analysis showed that many of the DEGs function in the extracellular exosome, extracellular matrix, extracellular vesicles, membrane‐bounded vesicles, Lewy bodies, myelin sheath and nucleus, and as structural components in the ribosome and cytoskeleton.
Figure 4.
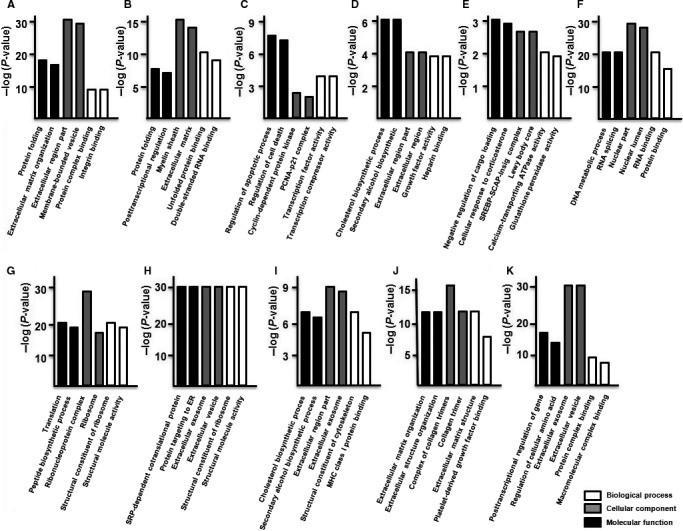
GO function analysis of the DEGs of hUC‐MSCs. GO classification of differentially regulated genes in cluster 1 (A), cluster 2 (B), cluster 3 (C), cluster 4 (D), cluster 5 (E), cluster 6 (F), cluster 7 (G), cluster 8 (H), cluster 9 (I), cluster 10 (J) and cluster 11 (K). The results were separated into three main categories: biological process, cellular component and molecular function
In hSF‐MSCs, the cluster 1 DEGs were primarily associated with mitotic cell cycle control and processes, protein binding and RNA binding, and were enriched in membrane‐enclosed lumen and organelle lumen (Figure 5A). The DEGs of cluster 2 were primarily related to SRP‐dependent cotranslational protein targeting, protein targeting to ER and structural molecule activity, and a significant amount is found in cytosolic ribosomes and ribosomal structures (Figure 5B). The DEGs of cluster 3 function in wound healing, vasculature development, platelet‐derived growth factor binding, formation of collagen trimers and extracellular matrix structure (Figure 5C). The DEGs of cluster 4 were related to responding to organic substances, anatomical structure morphogenesis and protein binding and RNA binding, and many of them are found in adherens junctions and anchoring junctions (Figure 5D). The DEGs of cluster 5 were associated with the regulation of cell migration, SREBP‐SCAP‐Insig complex, CXCR chemokine receptor binding and chemokine activity, with many of the DEGs localizing to the extracellular space (Figure 5E). The DEGs of cluster 6 were primarily related to extracellular matrix organization, extracellular structure organization, growth factor binding and glycosaminoglycan binding (Figure 5F). The DEGs of cluster 7 were primarily associated with the negative regulation of ryanodine, regulation of cellular amino acid, glutathione disulphide oxidoreductase and peptide disulphide oxidoreductase and a significant number of the DEGs localized to extracellular exosome, extracellular vesicle (Figure 5G).
Figure 5.
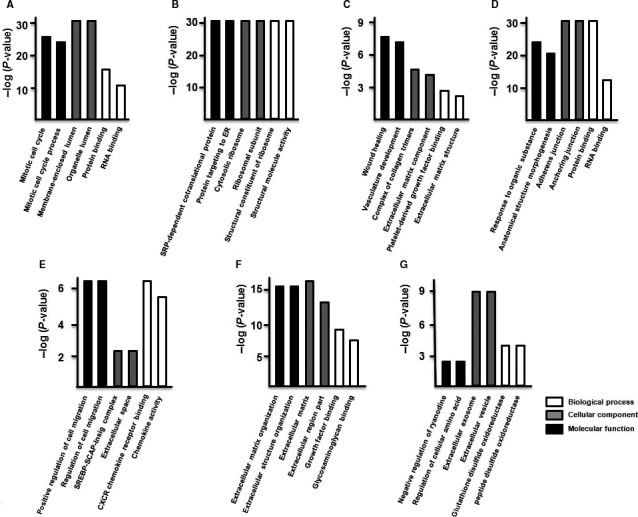
GO function analysis of the DEGs of hSF‐MSCs. GO classification of differentially regulated genes in cluster 1 (A), cluster 2 (B), cluster 3 (C), cluster 4 (D), cluster 5 (E), cluster 6 (F) and cluster 7 (G). The results were separated into three main categories: biological process, cellular component and molecular function
3.5. KEGG analysis of hUC‐MSCs and hSF‐MSCs samples
According to KEGG analysis, the DEGs in hUC‐MSC were mainly enriched in Alzheimer's disease, amoebiasis, antigen process and presentation, bladder cancer, cell cycle, chemical carcinogenesis, DNA replication, ECM‐receptor interactions, factor‐regulated calcium absorption, focal adhesions, gap junctions, glioma, glutathione metabolism, Hippo signalling pathway, Hunting's disease, Huntington's disease, xenobiotics metabolism, mineral absorption, nicotinate metabolism, oocyte meiosis, oxidative phosphorylation, p53 signalling pathway, Parkinson's disease, pathogenic Escherichia infection, PI3K‐Akt signalling pathway, progesterone oocyte maturation, protein digestion and absorption, protein processing, pyruvate metabolism, and terpenoid backbone biosynthesis, and function in the phagosome, proteasome, ribosome and spliceosome (Figure 6).
Figure 6.
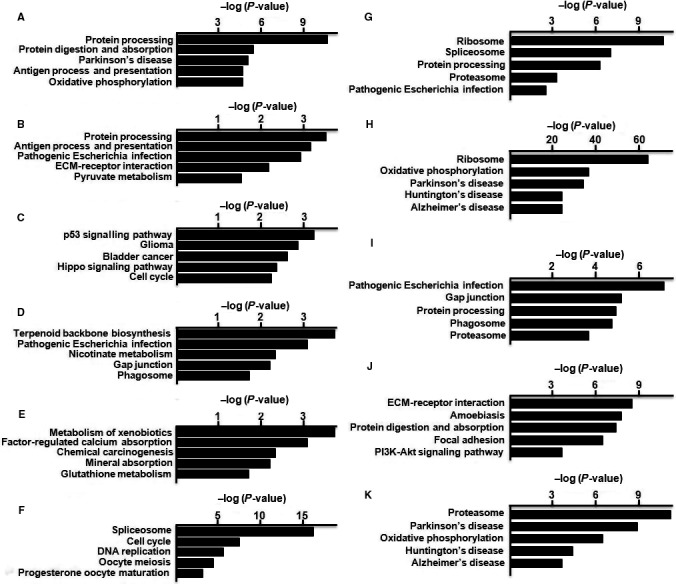
KEGG analysis of the DEGs of hUC‐MSCs. KEGG classification of differentially regulated genes in cluster 1 (A), cluster 2 (B), cluster 3 (C), cluster 4 (D), cluster 5 (E), cluster 6 (F), cluster 7 (G), cluster 8 (H), cluster 9 (I), cluster 10 (J) and cluster 11 (K)
In hSF‐MSCs, the DEGs in cluster 1 were primarily involved in the spliceosome, cell cycle, p53 signalling pathway, RNA degradation and pathogenic Escherichia infection (Figure 7A). The DEGs of cluster 2 were associated with the ribosome, Parkinson's disease, oxidative phosphorylation, Huntington's disease and Alzheimer's disease (Figure 7B). The cluster 3 DEGs were primarily related to amoebiasis, ECM‐receptor interactions, focal adhesions, bacterial invasion of epithelial cells and protein digestion and absorption (Figure 7C). Differentially expressed genes from cluster 4 were primarily associated with the spliceosome, ribosome and focal adhesions, as well as regulation of actin cytoskeleton, and PI3K‐Akt signalling (Figure 7D). In cluster 5, the DEGs were primarily connected to chemokine signalling, Legionellosis, Salmonella infection, TNF signalling and cytokine‐cytokine receptor interactions (Figure 7E). The DEGs of cluster 6 were primarily associated with Hippo signalling, proteoglycans expressed in cancer cells, focal adhesions, ECM‐receptor interactions and p53 signalling (Figure 7F). The DEGs of cluster 7 were primarily related to the proteasome and phagosome, as well as pathogenic Escherichia infection, gap junction formation and ubiquinone biosynthesis (Figure 7G).
Figure 7.
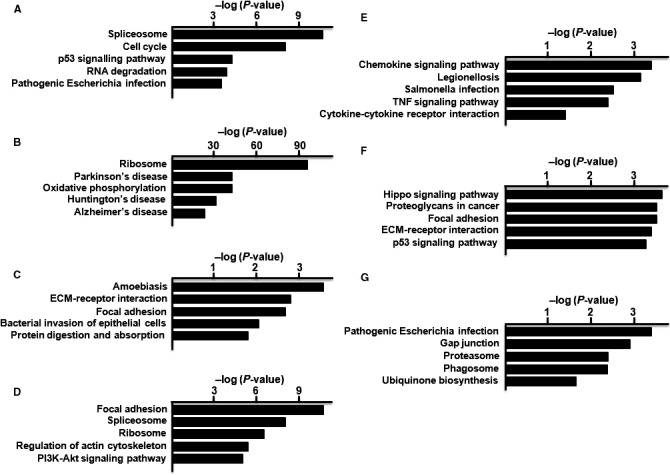
KEGG analysis of the DEGs of hSF‐MSCs. KEGG classification of differentially regulated genes in cluster 1 (A), cluster 2 (B), cluster 3 (C), cluster 4 (D), cluster 5 (E), cluster 6 (F) and cluster 7 (G)
4. DISCUSSION
In general, MSCs are increasingly being used as a resource for cell‐based therapies in cartilage repair and regenerative medicine.32, 33 The most effective cell dosages for clinical applications are still unclear; however, it is likely that a large number of MSCs would be needed for both cartilage repair and regenerative medicine. Over the last few years, adipose tissue, bone marrow, synovial fluid and umbilical cord blood have become accessible sources of cells for tissue engineering therapies. Adipose tissue contains MSCs at the highest concentration, and umbilical cord blood can be easily expanded to obtain higher numbers of MSCs.34 Many different laboratories have studied the cell morphology, surface markers and differentiation capacity of stem cells from these sources in order to gain a better understanding of the basic biology of various MSCs.4, 15 In this study, we were able to shed some light on the subgroups present in MSCs and the DEGs within those groups using scRNA‐seq.
Since UC‐MSCs are easily accessible and present fewer ethical problems, they are advantageous as potential resource for cell therapies and clinical applications. Tumorigenesis in UC‐MSCs and UC‐MSC‐derived transplant cells is rarely reported,34, 35 and UC‐MSCs have the potential to differentiate into a variety of different cell types.36, 37, 38, 39 SF‐MSCs provide another source for cell‐based therapies,16 although the success rates for SF‐MSCs are varied and the frequency of SF‐MSCs colony development is low.40 In this study, all cells isolated from the umbilical cord and synovial fluid exhibited typical MSC characteristics with a fibroblastoid morphology, a multipotential differentiation capability and a typical set of surface proteins.
With scRNA‐seq, we obtained 1597 cells and 1259 cells from hUC‐MSCs and hSF‐MSCs samples, respectively. The sequencing saturation for hUC‐MSCs and hSF‐MSCs samples was 43.4% and 18.1%, respectively. After mapping to the human genome, a majority of the reads could be confidently mapped to exonic regions (81.8% for hUC‐MSC and 63.1% for hSF‐MSC). As shown in Figures 2 and 3, PCA and t‐SNE analysis unveiled 11 clusters in hUC‐MSCs and 7 in hSF‐MSCs. In hUC‐MSC and hSF‐MSC, the total number of genes detected was 17 317 and 16 996, respectively. By comparing gene expression profiles between subpopulations, we identified 533 DEGs in cluster 1 of hUC‐MCSs, 57 in cluster 2, 32 in cluster 3, 44 in cluster 4, 10 in cluster 5, 319 in cluster 6, 731 in cluster 7, 1037 in cluster 8, 90 in cluster 9, 25 in cluster 10 and 230 in cluster 11 (Table 2). In hSF‐MSCs, there were 204 DEGs in cluster 1, 577 in cluster 2, 30 in cluster 3, 577 in cluster 4, 16 in cluster 5, 57 in cluster 6 and 35 in cluster 7 (Table 2).
The DEGs of hUC‐MSCs and hSF‐MSCs were mainly enriched in several biological processes and molecular functions, including cellular response to corticosterone, cholesterol biosynthetic process, cyclin‐dependent protein kinase, DNA metabolic process, extracellular matrix organization, growth factor activity, macromolecular complex binding, negative regulation of cargo loading, protein binding, protein folding, protein complex binding, protein targeting to ER, post‐transcriptional regulation of gene expression, regulation of apoptotic process, regulation of cell death, regulation of amino acid metabolism, RNA binding, RNA splicing, secondary alcohol biosynthetic process, translation, structural molecule activity, transcription factor activity, transcription corepressor activity and unfolded protein binding. The DEGs were localized to particular cellular components including the extracellular exosome, extracellular matrix, extracellular region, extracellular vesicle, membrane‐bounded vesicle, nucleus, nuclear lumen, ribosome and cytoskeleton.
The DEGs of hUC‐MSCs and hSF‐MSCs were mainly enriched in several signalling pathways, including Alzheimer's disease, amoebiasis, antigen processing and presentation, cell cycle, chemical carcinogenesis, DNA replication, ECM‐receptor interactions, factor‐regulated calcium absorption, focal adhesion signalling, gap junction signalling, glioma, glutathione metabolism, Hippo signalling pathway, Huntington's disease, mineral absorption, nicotinate metabolism, oocyte meiosis, oxidative phosphorylation, p53 signalling pathway, Parkinson's disease, pathogenic Escherichia infection, PI3K‐Akt signalling pathway, progesterone oocyte maturation, protein digestion and absorption, protein processing, proteasome signalling, pyruvate metabolism, ribosome, phagosome, spliceosome and terpenoid backbone biosynthesis.
In summary, our work provides information about the subpopulations and DEGs in hUC‐MSCs and hSF‐MSCs, as identified via scRNA‐seq. In addition, our results show that these DEGs are involved in many pathways, such as p53 signalling, gap junction signalling and PI3K‐Akt signalling, that function in regenerating damaged organs and tissues. Though our results are promising and provide important information about MSCs, the characteristics of hUC‐MSCs and hSF‐MSCs, and the functions of the differentially expressed genes in these subpopulations, need to be studied further.
CONFLICT OF INTEREST
The authors confirm that there are no conflicts of interest.
AUTHOR CONTRIBUTIONS
The following people designed, performed research and analysed data: Zhaofeng Jia, Shijin Wang, Qisong Liu; Zhaofeng Jia wrote the paper.
ACKNOWLEDGEMENTS
This study was supported financially by the Natural Science Foundation of China (No. 81572198; 81902196), the Fund of the Young and Middle‐aged Scientific Research Backbone Cultivation project of Shenzhen People's Hospital (No. SYKYPY201903). We thank the members of our research group. All authors have approved the final version of the manuscript and read the journal's authorship agreement.
Jia Z, Wang S, Liu Q. Identification of differentially expressed genes by single‐cell transcriptional profiling of umbilical cord and synovial fluid mesenchymal stem cells. J Cell Mol Med. 2020;24:1945–1957. 10.1111/jcmm.14891
DATA AVAILABILITY STATEMENT
The raw data used for the analyses in this paper have been deposited in the Genome Sequence Archive in BIG Data Center, Beijing Institute of Genomics (BIG), Chinese Academy of Sciences, under accession numbers CRA002294, CRA002294 that are publicly accessible at https://bigd.big.ac.cn/gsa.
REFERENCES
- 1. Prockop DJ. Marrow stromal cells as stem cells for nonhematopoietic tissues. Science. 1997;276:71‐74. [DOI] [PubMed] [Google Scholar]
- 2. Isobe Y, Koyama N, Nakao K, et al. Comparison of human mesenchymal stem cells derived from bone marrow, synovial fluid, adult dental pulp, and exfoliated deciduous tooth pulp. Int J Oral Maxillofac Surg. 2016;45:124‐131. [DOI] [PubMed] [Google Scholar]
- 3. Pittenger MF, Mackay AM, Beck SC, et al. Multilineage potential of adult human mesenchymal stem cells. Science. 1999;284:143‐147. [DOI] [PubMed] [Google Scholar]
- 4. Kern S, Eichler H, Stoeve J, Klüter H, Bieback K. Comparative analysis of mesenchymal stem cells from bone marrow, umbilical cord blood, or adipose tissue. Stem Cells. 2006;24:1294‐1301. [DOI] [PubMed] [Google Scholar]
- 5. Mosna F, Sensebe L, Krampera M. Human bone marrow and adipose tissue mesenchymal stem cells: a user's guide. Stem Cells Dev. 2010;19:1449‐1470. [DOI] [PubMed] [Google Scholar]
- 6. Alves H, van Ginkel J, Groen N, et al. A mesenchymal stromal cell gene signature for donor age. PLoS ONE. 2012;7:e42908. [DOI] [PMC free article] [PubMed] [Google Scholar]
- 7. Jin HJ, Bae YK, Kim M, et al. Comparative Analysis of human mesenchymal stem cells from bone marrow, adipose tissue, and umbilical cord blood as sources of cell therapy. Int J Mol Sci. 2013;14:17986‐18001. [DOI] [PMC free article] [PubMed] [Google Scholar]
- 8. Karamzadeh R, Eslaminejad MB, Aflatoonian R. Isolation, characterization and comparative differentiation of human dental pulp stem cells derived from permanent teeth by using two different methods. J Vis Exp. 2012;69:e4372. [DOI] [PMC free article] [PubMed] [Google Scholar]
- 9. Lu LL, Liu YJ, Yang SG, et al. Isolation and characterization of human umbilical cord mesenchymal stem cells with hematopoiesis‐supportive function and other potentials. Haematologica. 2006;91:1017‐1026. [PubMed] [Google Scholar]
- 10. Han K, Lee JE, Kwon SJ, et al. Human amnion‐derived mesenchymal stem cells are a potential source for uterine stem cell therapy. Cell Prolif. 2008;41:709‐725. [DOI] [PMC free article] [PubMed] [Google Scholar]
- 11. Rubinstein P, Rosenfield RE, Adamson JW, Stevens CE. Stored placental blood for unrelated bone marrow reconstitution. Blood. 1993;81:1679‐1690. [PubMed] [Google Scholar]
- 12. Oh W, Kim DS, Yang YS, Lee JK. Immunological properties of umbilical cord blood‐derived mesenchymal stromal cells. Cell Immunol. 2008;251:116‐123. [DOI] [PubMed] [Google Scholar]
- 13. Reinisch A, Bartmann C, Rohde E, et al. Humanized system to propagate cord blood‐derived multipotent mesenchymal stromal cells for clinical application. Regen Med. 2007;2:371‐382. [DOI] [PubMed] [Google Scholar]
- 14. Dominici M, Le Blanc K, Mueller I, et al. Minimal criteria for defining multipotent mesenchymal stromal cells. The International Society for Cellular Therapy position statement. Cytotherapy. 2006;8:315‐317. [DOI] [PubMed] [Google Scholar]
- 15. Bosch J, Houben AP, Radke TF, et al. Distinct differentiation potential of “MSC” derived from cord blood and umbilical cord: are cord‐derived cells true mesenchymal stromal cells? Stem Cells Dev. 2012;21:1977‐1988. [DOI] [PubMed] [Google Scholar]
- 16. Jones EA, English A, Henshaw K, et al. Enumeration and phenotypic characterization of synovial fluid multipotential mesenchymal progenitor cells in inflammatory and degenerative arthritis. Arthritis Res Ther. 2004;50:817‐827. [DOI] [PubMed] [Google Scholar]
- 17. Jones EA, Crawford A, English A, et al. Synovial fluid mesenchymal stem cells in health and early osteoarthritis: detection and functional evaluation at the single‐cell level. Arthritis Rheum. 2008;58:1731‐1740. [DOI] [PubMed] [Google Scholar]
- 18. Sakaguchi Y, Sekiya I, Yagishita K, Muneta T. Comparison of human stem cells derived from various mesenchymal tissues: superiority of synovium as a cell source. Arthritis Rheumatol. 2005;52:2521‐2529. [DOI] [PubMed] [Google Scholar]
- 19. Chiang CW, Chen WC, Liu HW, Chen CH. Application of synovial fluid mesenchymal stem cells: platelet‐rich plasma hydrogel for focal cartilage defect. J Exp Clin Med. 2014;6:118‐124. [Google Scholar]
- 20. Wang J, Song Y. Single cell sequencing: a distinct new field. Clin Transl Med. 2017;6:10. [DOI] [PMC free article] [PubMed] [Google Scholar]
- 21. Gawad C, Koh W, Quake SR. Single‐cell genome sequencing: current state of the science. Nat Rev Genet. 2016;17:175‐188. [DOI] [PubMed] [Google Scholar]
- 22. Nair S, Nkhoma SC, Serre D, et al. Single‐cell genomics for dissection of complex malaria infections. Genome Res. 2014;24:1028‐1038. [DOI] [PMC free article] [PubMed] [Google Scholar]
- 23. Blake DP, Clark EL, Macdonald SE, et al. Population, genetic, and antigenic diversity of the apicomplexan Eimeria tenella and their relevance to vaccine development. Proc Natl Acad Sci USA. 2015;112:E5343‐E5350. [DOI] [PMC free article] [PubMed] [Google Scholar]
- 24. Navin N, Kendall J, Troge J, et al. Tumour evolution inferred by single‐cell sequencing. Nature. 2011;472:90‐94. [DOI] [PMC free article] [PubMed] [Google Scholar]
- 25. Lodato MA, Woodworth MB, Lee S, et al. Somatic mutation in single human neurons tracks developmental and transcriptional history. Science. 2015;350:94‐98. [DOI] [PMC free article] [PubMed] [Google Scholar]
- 26. Shalek AK, Satija R, Adiconis X, et al. Single‐cell transcriptomics reveals bimodality in expression and splicing in immune cells. Nature. 2013;498:236‐240. [DOI] [PMC free article] [PubMed] [Google Scholar]
- 27. Wills QF, Livak KJ, Tipping AJ, et al. Single‐cell gene expression analysis reveals genetic associations masked in whole‐tissue experiments. Nat Biotechnol. 2013;31:748‐752. [DOI] [PubMed] [Google Scholar]
- 28. Liu S, Trapnell C. Single‐cell transcriptome sequencing: recent advances and remaining challenges. F1000Research. 2016;5:182. [DOI] [PMC free article] [PubMed] [Google Scholar]
- 29. Zheng GX, Terry JM, Belgrader P, et al. Massively parallel digital transcriptional profiling of single cells. Nat Commun. 2017;8:14049. [DOI] [PMC free article] [PubMed] [Google Scholar]
- 30. Farmer DT, Nathan S, Finley JK, et al. Defining epithelial cell dynamics and lineage relationships in the developing lacrimal gland. Development. 2017;144:2517‐2528. [DOI] [PMC free article] [PubMed] [Google Scholar]
- 31. Yan KS, Gevaert O, Zheng GXY, et al. Intestinal enteroendocrine lineage cells possess homeostatic and injury‐inducible stem cell activity. Cell Stem Cell. 2017;21(1):78‐90.e6. [DOI] [PMC free article] [PubMed] [Google Scholar]
- 32. Wakitani S, Goto T, Pineda SJ, et al. Mesenchymal cell‐based repair of large, full‐thickness defects of articular cartilage. J Bone Joint Surg Am. 1994;76:579‐592. [DOI] [PubMed] [Google Scholar]
- 33. Donaldson J, Tudor F, Mcdermott ID. Treatment options for articular cartilage damage in the knee. Orthop Trauma. 2015;29:24‐30. [Google Scholar]
- 34. Bongso A, Fong CY, Gauthaman K. Taking stem cells to the clinic: major challenges. J Cell Biochem. 2008;105:1352‐1360. [DOI] [PubMed] [Google Scholar]
- 35. Can A, Karahuseyinoglu S. Concise review: human umbilical cord stroma with regard to the source of fetus‐derived stem cells. Stem Cells. 2007;25:2886‐2895. [DOI] [PubMed] [Google Scholar]
- 36. Wu KH, Zhou B, Lu SH, et al. In vitro and in vivo differentiation of human umbilical cord derived stem cells into endothelial cells. J Cell Biochem. 2007;100:608‐616. [DOI] [PubMed] [Google Scholar]
- 37. Conconi MT, Burra P, Di Liddo R, et al. CD105 (+) cells from Wharton's jelly show in vitro and in vivo myogenic differentiative potential. Int J Mol Med. 2006;18:1089‐1096. [PubMed] [Google Scholar]
- 38. Fu YS, Shih YT, Cheng YC, Min MY. Transformation of human umbilical mesenchymal cells into neurons in vitro . J Biomed Sci. 2004;11:652‐660. [DOI] [PubMed] [Google Scholar]
- 39. Nishiyama N, Miyoshi S, Hida N, et al. The significant cardiomyogenic potential of human umbilical cord blood‐derived mesenchymal stem cells in vitro . Stem Cells. 2007;25:2017‐2024. [DOI] [PubMed] [Google Scholar]
- 40. Matsukura Y, Muneta T, Tsuji K, Koga H, Sekija I. Mesenchymal stem cells in synovial fluid increase after meniscus injury. Clin Orthop Rel Res. 2014;472:1357‐1364. [DOI] [PMC free article] [PubMed] [Google Scholar]
Associated Data
This section collects any data citations, data availability statements, or supplementary materials included in this article.
Data Availability Statement
The raw data used for the analyses in this paper have been deposited in the Genome Sequence Archive in BIG Data Center, Beijing Institute of Genomics (BIG), Chinese Academy of Sciences, under accession numbers CRA002294, CRA002294 that are publicly accessible at https://bigd.big.ac.cn/gsa.