Abstract
Intestinal microbiota performed numerous important functions during digestion. The first filial generation (F1) hybrids of Hainan black goats and Saanen goats had different traits, black goats (BG) and white goats (WG), which also brought different production performance. We explored the difference of gut microbiota between black goats and white goats that both belonged to the first filial generation (F1) hybrids. In general, the alpha diversity of the black goat group was significantly higher than the white goat group. The species richness had no significant difference, while the species evenness of BG was higher than WG. Bacteroides, Oscillospira, Alistipes, Ruminococcus, Clostridium and Oscillibacter, as the core gut microbial genera, all had high abundance in BG and WG group. Only the Bacteroides and Bacteroidaceae 5-7N15 were the different genera between the BG and WG group, of which Bacteroides overlapped with the core genera and enriched in the WG group. Besides, PICRUSt analysis showed that there was a high abundance in the secondary metabolic pathways including membrane transport, replication and repair, carbohydrate metabolism and amino acid metabolism. We found the intestinal microbial species of black goats and white goats were very similar for living in the identical growing environment and feeding conditions, but there was still a slight difference in the content. On the one hand, it was proved that the small effect of genotype and the great effect of diet affected the intestinal microbiota together. On the other hand, it was also proved that these different traits of first filial generation (F1) hybrids may not related to gut microbiota and only because of different genotype. Moreover, characterization of the gut microbiota in BG and WG will be useful in goats gut microbiota research.
Introduction
Microorganisms are mainly distributed in the oral cavity, alimentary canal, skin epidermis and intestines in animals [1]. There are hundreds of millions microbes in the gut and the total number of intestinal microbial genes is about 100 times more than the total host organism genes [2]. Therefore, the gut microbiota was also known as the second genome of the body [3]. The interactions between microbiota and host including nutrient absorption and immune response, which maintain the stability and host’s health [4]. In some animal species, microbial activity in the cecum may provide 25–35% of animal nutritional needs [5]. Carbohydrates are hydrolyzed and utilized by intestinal microbiota to produce intermediate products, such as monosaccharides, oligosaccharides and organic acids. These intermediates continue to be fermented to produce short-chain fatty acids, mainly including acetic acid, propionic acid and butyric acid [6, 7], which are the main energy source of colon cells, and offer about 10% energy in the food for the host. Besides, proteins are decomposed to produce peptides and amino acids, which are further metabolized by intestinal microbiota to produce short-chain fatty acids [8]. On the contrary, gut microbiota can also use nitrogen sources to synthesize amino acids and proteins as the energy for their growth [9, 10]. For ruminants, different parts of the intestine also have distinct digestive functions. The small intestine is the most vital organ to digest and absorb food and nutrients, including water, inorganic salts, carbohydrate, protein, and fat [11]. The colon and jejunum mainly absorb water and the ileum digests fiber [12]. Large intestine absorbs salt and residual water. The digestion and absorption of food by intestinal microbiota in different individuals is not the same, and it even determines the absorption of nutrients of the host. Turnbaugh et al. found that germ-free mice transplanted with intestinal microbiota from obesity mice gained more weight and greater fat than from lean mice [13]. Thus, the difference in the metabolic ability of intestinal microbiota can affect the absorption and utilization of food, which leads to the fat or thin of the host [14, 15].
There are at least 24 indigenous breeds of goats (Capra hirus) recorded in China [16]. Hainan black goat, which is peculiar to Hainan province, is a local breed formed by long-term natural selection under the distinct climatic conditions of high temperature and high humidity. It is well known not only for its rough feeding tolerance, strong disease resistance and well adaptability to the tropical maritime climate in Hainan province [17], but also for its delicious meat with no smell of mutton, rich nutrition, and tender meat [18, 19]. Saneng goat is the representative of dairy goat, and Saanen goats have been imported into Hainan province to improve the body size of black goats in the local [20]. The first filial generation (F1) hybrids of Hainan black goats and Saanen goats had different traits, black goats (BG) and white goats (WG), which also brought different production performance including the milk yield was significantly higher in WG, BG gained weight more slowly in the same period. The BG and WG both belong to a first filial generation, while showing different appearance and performance. As we all know, the intestinal microbiota performed numerous activities important during digestion, even influenced phenotype. We supposed these special traits were not only related to their own genetic genes but also related to intestinal microbiota, so we explored the difference of gut microbiota between BG and WG.
With advances in high-throughput sequencing technology, metagenomic sequencing has been used to analyze the diverse species composition of microbiota in different samples [21, 22]. Xu et al. revealed the composition and function of cecal microbiota in Dagu chicken using high-throughput sequencing technology in 2016 [23]. The dynamic structure and distribution of small-tail Han sheep microbiota across different intestinal segments also have been studied by high-throughput sequencing technology [3]. As we all know, the gene, environment and proportion of various nutrients in diet affect the stability and balance of intestinal microbiota. In this study, the differences of the gut microbiota and metabolic pathways between the two color types of the hybrids of Hainan black goats and Saanen goats grazing in Hainan province were analyzed by comparing targeted V3-V4 regions using 16S rRNA gene sequencing with the Illumina Miseq platform.
Materials and methods
The goats and fecal sampling
The first filial generation (F1) hybrids of Hainan black goats and Saanen goats and were divided into black goats (BG) and white goats (WG), ten each. All the goats were aged from 7–12 months with the body weights ranged from 45 to 67 kg. There was no significant difference in the composition of the feeds which mainly including hay, straw, corn, bran and bean pulp. Faecal samples from 10 black goats (BG) and 10 white goats (WG) were collected and the faecal samples was numbered (BG1-10 or WG1-10). Faecal samples were weighed, mixed with protector (Takara, Japan) in sterile tubes at the ratio of 1:5 (w/w) until homogenous. The mixture was placed in an ice box and transported to the laboratory, and then the metagenomic DNA was extracted immediately. The sampling method and all subsequent methods described in this section were conducted in accordance with the approved guidelines and were approved by the Ethical Committee of the Hainan University (Haikou, China).
Metagenomic DNA extraction
The commercial metagenomic DNA extraction kit of QIAamp® DNA Stool Mini Kit (Qiagen, Hilden, Germany) coupled with bead-beating was used for DNA extraction from the faecal samples to guarantee the integrity, purity, and concentration of the DNA [24]. The quality of metagenomic DNA was evaluated using 0.8% agarose gel electrophoresis. Metagenomic DNA of the gut microbiota was stored at -20°C prior to further evaluation.
Amplification V3-V4 regions of 16S rRNA Gene and high-throughput sequencing
The V3-V4 regions of the 16S rRNA genes were amplified using PCR assays [25, 26]. A set of 6-nucleotide barcodes was added to the universal forward primer 338F (5′-ACTCCTACGGGAGGCAGCA-3′) and the reverse primer 806R (5′-GGACTACHVGGGTWTCTAAT-3′), which was targeted at domain bacteria [24]. PCR amplification was achieved following the methods of Wu et al. [27]. The PCR products were then purified and quantified using the Agilent DNA 1000 Kit and the Agilent 2100 Bioanalyzer (Agilent Technologies, Palo Alto, USA). Purified PCR products were pooled together in equimolar ratios with a final concentration of 100 nmol/L each and sequenced using an Illumina Miseq PE300 platform.
Bioinformatics and statistical analysis
Low-quality sequences were removed using the protocols of Zhang et al. [28]. After removal of the primers and barcodes, the remaining high-quality sequences were analyzed using the QIIME (v1.7.0) suite of software tools [29]. Approach of phylogenetic investigation of communities by reconstruction of unobserved states (PICRUSt, v1.0) was used to predict the 16S rRNA gene based high-throughput sequencing data for functional features [30]. R program (v3.3.0) was used for statistical analyses. Based on the rarefied OTU subset, the relative abundance of taxa was compared using the Wilcoxon rank-sum test [31]. False discovery rate (FDR) values were estimated using the Benjamini-Yekutieli method to control for multiple testing [32]. PCoA analysis was done in R using the ‘ade4’ package. Major metabolic pathways were visualized with a heatmap made in R using the ‘pheatmap’ package. The sequence data reported in this paper have been deposited in the NCBI database (Metagenomic data: PRJNA347413).
Results
The gut microbial diversity of 10 black goats (BG) and 10 white goats (WG) was evaluated using 16S rRNA gene high-throughput sequencing. There was a total of 212,177 sequences. From this total 96.48% (204,809 sequences) were high-quality 16S rRNA gene sequences, with an average of 10,240 sequences for each sample (ranging from 8,512 to 11,775). The number of OTUs was analyzed with a confidence coefficient of 97% for each sample ranging from 714 to 1,739, with an average of 1,314 (Table 1). These results indicated that most of the microbial diversity had already been captured.
Table 1. Metagenomic sequencing coverage.
| Sample | Qualified | OTU Number | Barcode | Observed species |
|---|---|---|---|---|
| BG1 | 11195 | 1608 | CCTCTA | 2834.97 |
| BG2 | 11104 | 1226 | TTCACG | 2412.93 |
| BG3 | 11674 | 1463 | ATTCCT | 1897.8 |
| BG4 | 10413 | 1406 | GTCGTA | 2479.62 |
| BG5 | 11045 | 1663 | CCTCTA | 2428.05 |
| BG6 | 9018 | 1605 | CGGATT | 1764.45 |
| BG7 | 10339 | 1502 | GAGTTA | 2226.91 |
| BG8 | 11775 | 1565 | GGTGAA | 2194.36 |
| BG9 | 9057 | 1283 | GGTGCA | 1929.41 |
| BG10 | 10683 | 1332 | GAGTGC | 1486.61 |
| WG1 | 9284 | 1590 | TCTTCA | 2509.76 |
| WG2 | 10254 | 1739 | AGCATC | 1882.82 |
| WG3 | 10333 | 1144 | GTCGGA | 1819.93 |
| WG4 | 10012 | 1137 | AATGTC | 2039.96 |
| WG5 | 11025 | 1202 | TCTACA | 1766.72 |
| WG6 | 9390 | 1020 | AATGGC | 1174.14 |
| WG7 | 8512 | 714 | TTCGCA | 1440.54 |
| WG8 | 9353 | 845 | TTCACA | 2066.19 |
| WG9 | 10698 | 1142 | GATATC | 1316.81 |
| WG10 | 9645 | 1096 | GTCAGA | 2407.52 |
Alpha diversity and beta diversity between BG and WG
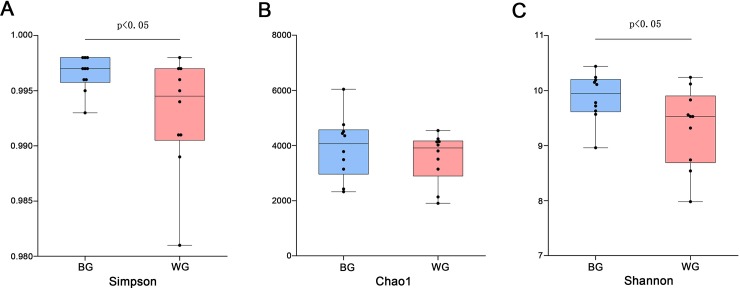
We evaluated the alpha diversity between BG and WG using Simpson, Chao1 and Shannon index (Fig 1). The Chao1 indices were measured to estimate community richness, which indicated that the species richness had not significantly difference between BG and WG. Simpson and Shannon indexes in the BG were significantly higher than those in WG, which showed the species evenness of BG was higher than WG.
Fig 1. The alpha diversity between black goat (BG) and white goat (WG).
P value was calculated using one-tailed unpaired t test.
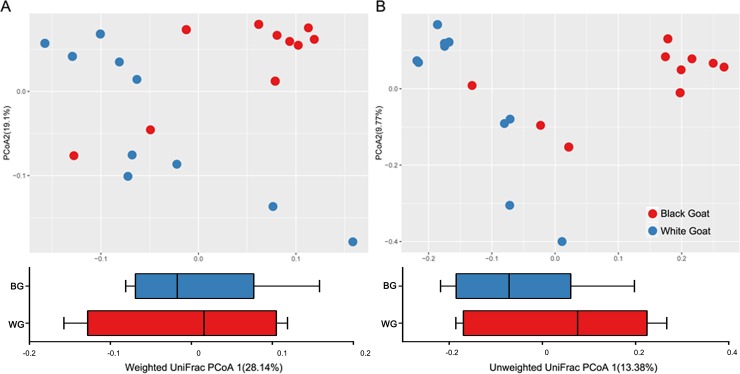
Beta diversity was calculated to compare the differences in gut microbiota amongst the faecal samples from BG and WG. Principal co-ordinates analysis (PCoA) was performed based on the weighted and unweighted UniFrac distances of 16S rRNA sequence profiles (Fig 2). This identified an apparent clustering pattern for gut microbiota data from the BG (red) and WG (blue), respectively (Fig 2). Data of BG was clustered in the right side of the coordinate axis, while the data of WG was clustered in the left side of the coordinate axis. There was significant separation between samples from BG and WG (P<0.001), which showed that the structure of gut microbiota was different between BG and WG.
Fig 2.
PCoA score plot based on weighted (A) and unweighted (B) UniFrac metrics for all samples. Each point represents the composition of the intestinal microbiota of one sample.
Core gut microbiota at the level of genus and species
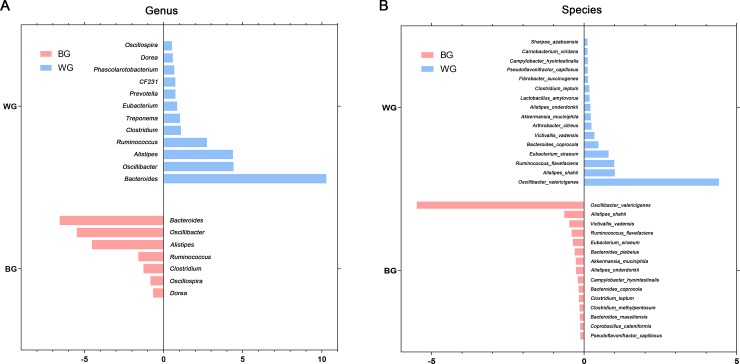
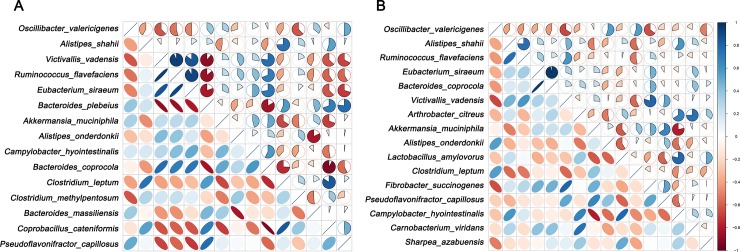
The composition of core gut microbiota was identified at the level of genus and species (Fig 3). The microbiota at the genus level that existed in each sample with an average relative content of more than 0.5% was listed in the figure (Fig 3A), and those at the species level were list in Fig 3B. All genera of Bacteroides, Oscillospira, Alistipes, Ruminococcus, Clostridium and Oscillibacter had high abundance in BG and WG group, and Bacteroides was the dominant genus. We also found the core gut microbiota had similarity between BG and WG at genus and species level. But interestingly, the dominant species belong to genus Oscillibacter, not genus Bacteroides. Furthermore, the correlation between core gut microbiota at the species level was analyzed using Spearman's test (Fig 4). Core microbiota of BG was in Fig 4A and WG’s was in Fig 4B. The darker the blue, the positive correlation was stronger. In the same way, the darker the red, the negative correlation was stronger. Bacteroides_coprocola had the strong negative correlation with Coprobacillus_cateniformis in BG, while had strong positive correlation with Eubacterium_siraeum.
Fig 3.
Composition of core gut microbiota of BG and WG at the genus (A) and species (B) level.
Fig 4.
Correlation of core microbiota in BG (A) and WG (B).
Different genera between BG and WG
The genera with significant differences were listed using the two-tailed t test (Table 2). Only genera of Bacteroides and 5-7N15 (belong to Bacteroidaceae family) were the different genera between BG and WG. While at the species level, there was no significant difference between BG and WG. We also found that only Bacteroides overlapped with the core gut microbiota and enriched in the WG group.
Table 2. The different genera between BG and WG.
| Genus taxonomy | p value | BG (%) | WG (%) | ||||
|---|---|---|---|---|---|---|---|
| Median | Min-Max | Average | Median | Min-Max | Average | ||
| Bacteroides | 0.0290 | 5.850 | 4.424–9.839 | 6.566 | 9.894 | 5.901–19.430 | 10.286 |
| Bacteroidaceae 5-7N15 | 0.0428 | 0.044 | 0.000–0.113 | 0.045 | 0.107 | 0.000–0.276 | 0.119 |
The comparison of major metabolic pathways between samples
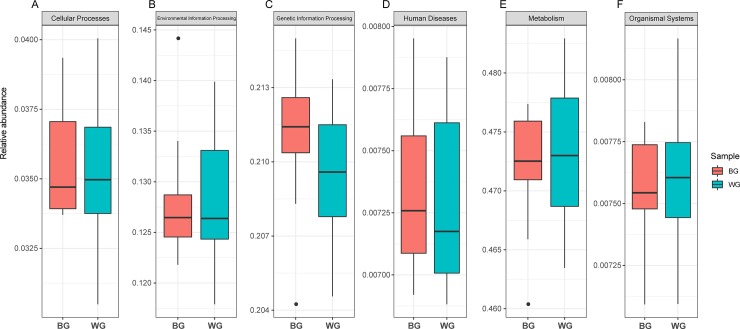
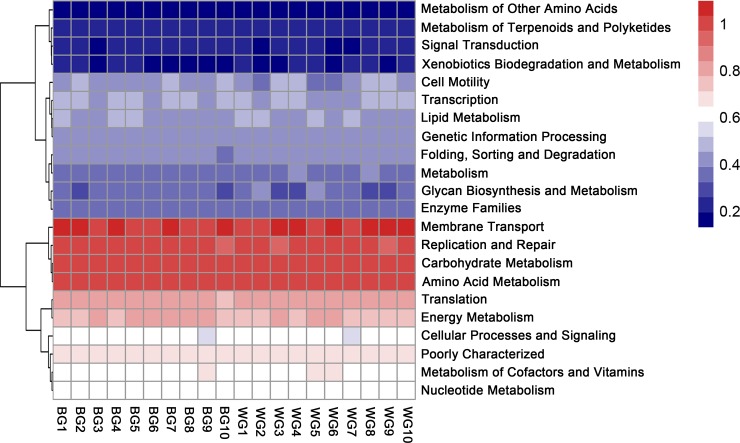
PICRUSt (v 1.0) was used to predict functional features based on the V3-V4 regions of 16S rRNA gene sequencing data to determine the potential role of the gut microbiota present in goats. In the primary metabolic pathways, there were no significant differences between BG and WG (Fig 5) and the metabolism pathway had a high abundance above all. The metabolic secondary pathways with relative content greater than 0.01% were listed (Fig 6). Membrane transport, carbohydrate metabolism, replication and repair and amino acid metabolism were the major metabolic secondary pathways and had high abundance in the BG and WG. The two-tailed t test showed that the microbial pathways of metabolism, enzyme families and poorly characterized had significant differences between the BG and WG groups, but due to the low content, it is not obvious in the figure. Furthermore, the tertiary metabolic pathways were predicted, in which pyruvate metabolism pathway had higher abundance in the BG group, to the contrary, peptidases pathway had higher abundance in the WG (S1 Table).
Fig 5. The primary metabolic pathways between BG and WG.
Fig 6. The main secondary metabolic pathways between BG and WG.
Correlation between microbiota and microbial pathways
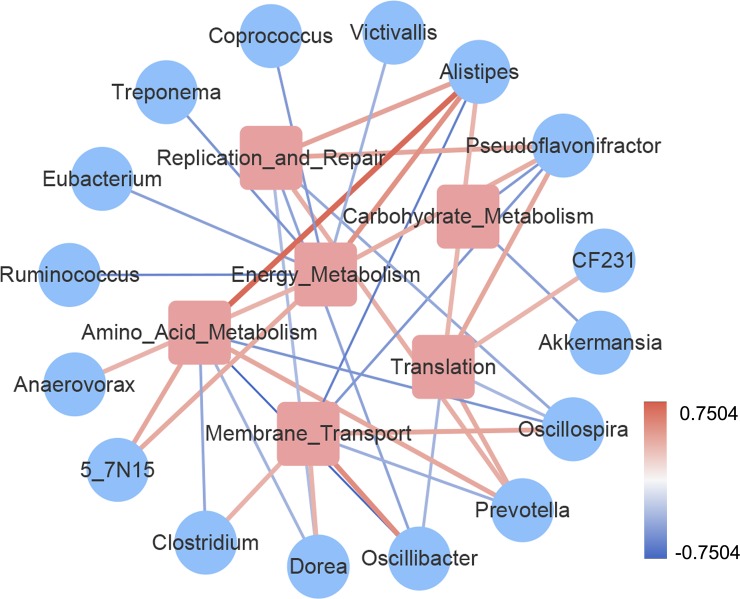
We calculated the correlation between the core microbiota and the core metabolic pathways and drew the network (Fig 7), in which the blue circle represented the genera and the pink square represented the core metabolic pathways. If there was a correlation, the genera were connected with the pathways. The thickness of the line indicated the size of the absolute value of the correlation. Additionally, red represented positive correlation, and blue represented negative correlation. We could find that there was a strong correlation between Alistipes and amino acid metabolism pathway, indicating that Alistipes may play an important role in amino acid metabolism. Bacteroidaceae 5-7N15 was positively correlated with amino acid metabolism and membrane transport.
Fig 7. Correlation between genera and metabolic secondary pathways.
Discussion
It used to be believed that the gut was merely an organ to recycle water and some nutrients and store undigested food residues as excrement. In the recent years, sequencing-based assessment of microbial communities in animal faeces had uncovered a large quantity and types of microbial species colonizing in the host gut. A growing body of research had indicated that the microbial communities were associated with the digestion of dietary macronutrients, production of nutrients and vitamins. Thus, the gastrointestinal microbiota can be considered a highly active metabolic organ to complement the host metabolic activities, and the diet can have a major influence on the gut microbial community.
In this research, we used next-generation sequencing of the V3-V4 regions of 16S rRNA genes of metagenomic DNA to understand the full composition of the microbiota in the gut. We compared the alpha and beta diversity between BG and WG and abundant microbiota and major metabolic pathways also had been showed here. Though the goats had different traits, the gut microbiota had high similarity. In general, the alpha diversity of the black goat group was significantly higher than the white goat group. The richness had no significant difference, while the species evenness of BG was higher than WG. Bacteroides, Oscillospira, Alistipes, Ruminococcus, Clostridium and Oscillibacter, as the core gut microbial genus, all had high abundance in BG and WG group. Only the Bacteroides and Bacteroidaceae 5-7N15 were the different genera between the BG and WG group, of which Bacteroides overlapped with the core genera and enriched in the WG group. Besides, there was a slight difference in the secondary metabolic pathways including metabolism, enzyme families and poorly characterized.
Goats as ruminant animals, numerous microbes habited in the rumen and gut, which were associated with the digestion of dietary macronutrients (including crude protein, non-fibre carbohydrates, non-digestible fibre, and lignin), production of nutrients and vitamins. Studies of the gut microbiota of vegetarian humans found increased levels of Bacteroides and Prevotella [33]. That revealed that Bacteroides had the ability to digest dietary fiber and could explain why both BG and WG had the high abundance of genus Bacteroides. High levels of Firmicutes have been reported from the faeces of humans consuming plant-based diets (cereal, vegetables and fruit) where it is thought that they could contribute to the metabolism of the plant-based diet [34]. No matter at the genus level or at the species level, Oscillibacter and Oscillibacter_valericigenes both had high abundance. And Oscillibacter, Ruminococcus, Eubacterium, Clostridium, Dorea and Oscillospira all belonged to Firmicutes. Furthermore, an important member of the Ruminococcus can metabolize dietary plant polysaccharides including cellulose, xylan and amylase [33].
Conclusions
This study proved the huge impact of diet on the intestinal tract. We found the intestinal microbial species of black goats and white goats were very similar in the identical environment and feeding conditions, but there was still a slight difference in the content. On the one hand, it proved that the small effect of genotype and the great effect of diet affected the intestinal microbiota together. On the other hand, it also confirmed that these different traits of first filial generation (F1) hybrids may not be related to gut microbiota and only because of different genotype. Moreover, characterization of the gut microbiota in BG and WG will be useful in another gut microbiota-based goat research.
Supporting information
(XLSX)
Abbreviations
- BG
Black goat group
- WG
White goat group
- PCoA
Principal co-ordinates analysis
- 16S rRNA
16 Svedberg ribosomal ribonucleic acid
- UniFrac
Unique fraction
- OTU
Operational taxonomic unit
- DNA
Deoxyribonucleic acid
- PCR
Polymerase chain reaction
Data Availability
The datasets generated during and/or analysed during the current study are available in the NCBI repository (Metagenomic data: PRJNA347413).
Funding Statement
This research was supported by the Key Research and Development Project of Hainan Province (No. ZDYF2018111). This award was granted to JZ. The funder had no role in study design, data collection and analysis, decision to publish, or preparation of the manuscript.
References
- 1.Qin JJ, Li RQ, Raes J, Arumugam M, Burgdorf KS, Manichanh C, et al. A human gut microbial gene catalogue established by metagenomic sequencing. Nature. 2010;464(7285):59–70. 10.1038/nature08821 [DOI] [PMC free article] [PubMed] [Google Scholar]
- 2.Ken K, Takehiko I, Tomomi K, Kenshiro O, Hidehiro T, Atsushi T, et al. Comparative metagenomics revealed commonly enriched gene sets in human gut microbiomes. DNA Research. 2007;14(4):169–181. 10.1093/dnares/dsm018 [DOI] [PMC free article] [PubMed] [Google Scholar]
- 3.Zhang H, Shao MX, Huang H, Wang SJ, Ma LL, Wang HN, et al. The dynamic distribution of small-tail han sheep microbiota across different intestinal segments. Front Microbiol. 2018;9 10.3389/fmicb.2018.00032 [DOI] [PMC free article] [PubMed] [Google Scholar]
- 4.Wang ZX, Jiang SM, Ma CC, Huo DX, Peng QN, Shao Y, et al. Evaluation of the nutrition and function of cow and goat milk based on intestinal microbiota by metagenomic analysis. Food Funct. 2018;9(4):2320–2327. 10.1039/c7fo01780d [DOI] [PubMed] [Google Scholar]
- 5.Savage DC. Microbial ecology of the gastrointestinal tract. Annu Rev Microbiol. 1977;31:107–133. 10.1146/annurev.mi.31.100177.000543 [DOI] [PubMed] [Google Scholar]
- 6.Cummings JH, Beatty ER, Kingman SM, Bingham SA, Englyst HN. Digestion and physiological properties of resistant starch in the human large bowel. Brit J Nutr. 1996;75(5):733–747. 10.1079/bjn19960177 [DOI] [PubMed] [Google Scholar]
- 7.Cummings JH, Pomare EW, Branch WJ, Naylor CPE, Macfarlane GT. Short chain fatty-acids in human large-intestine, portal, hepatic and venous-blood. Gut. 1987;28(10):1221–1227. 10.1136/gut.28.10.1221 [DOI] [PMC free article] [PubMed] [Google Scholar]
- 8.Macfarlane GT, Cummings JH, Allison C. Protein degradation by human intestinal bacteria. J Gen Microbiol. 1986;132(6):1647–1656. 10.1099/00221287-132-6-1647 [DOI] [PubMed] [Google Scholar]
- 9.Mcneil NI. The contribution of the large-intestine to energy supplies in man. Am J Clin Nutr. 1984;39(2):338–342. 10.1093/ajcn/39.2.338 [DOI] [PubMed] [Google Scholar]
- 10.Portune KJ, Beaumont M, Davila AM, Tome D, Blachier F, Sanz Y. Gut microbiota role in dietary protein metabolism and health-related outcomes: the two sides of the coin. Trends Food Sci Tech. 2016;57:213–232. 10.1016/j.tifs.2016.08.011 [DOI] [Google Scholar]
- 11.Flachowsky G. Rumen microbiology. Anim Feed Sci Technol. 2004;113(1–4):253–254. 10.1016/j.anifeedsci.2003.09.002 [DOI] [Google Scholar]
- 12.Jiao JZ, Wang PP, He ZX, Tang SX, Zhou CS, Han XF, et al. In vitro evaluation on neutral detergent fiber and cellulose digestion by post-ruminal microorganisms in goats. J Sci Food Agr. 2014;94(9):1745–1752. 10.1002/jsfa.6485 [DOI] [PubMed] [Google Scholar]
- 13.Turnbaugh PJ, Baeckhed F, Fulton L, Gordon JI. Diet-induced obesity is linked to marked but reversible alterations in the mouse distal gut microbiome. Cell Host Microbe. 2008;3(4):213–223. 10.1016/j.chom.2008.02.015 [DOI] [PMC free article] [PubMed] [Google Scholar]
- 14.Turnbaugh PJ, Gordon JI. The core gut microbiome, energy balance and obesity. J Physiol-London. 2009;587(17):4153–4158. 10.1113/jphysiol.2009.174136 [DOI] [PMC free article] [PubMed] [Google Scholar]
- 15.Moreno-Indias I, Cardona F, Tinahones FJ, Queipo-Ortuno MI. Impact of the gut microbiota on the development of obesity and type 2 diabetes mellitus. Front Microbiol. 2014;5 10.3389/fmicb.2014.00190 [DOI] [PMC free article] [PubMed] [Google Scholar]
- 16.Tang YX, Liu F, Tang HX, Yang SK, Zhang XY. The complete mitochondrial genome of Yunnan black goat (Capra hircus). Mitochondrial DNA A. 2016;27(1):224–225. 10.3109/19401736.2014.880900 [DOI] [PubMed] [Google Scholar]
- 17.Wang D, Zhou L, Zhou H, Hou G, Shi L. Effects of dietary α-lipoic acid on carcass characteristics, antioxidant capability and meat quality in Hainan black goats. Ital J Anim Sci. 2016;16(1):1–7. 10.1080/1828051X.2016.1263546 [DOI] [Google Scholar]
- 18.Wang DF, Zhou LL, Zhou HL, Hou GY, Li M, Shi LG, et al. Effects of nutrition level of concentrate-based diets on growth performance and carcass characteristics of Hainan black goats. Trop Anim Health Pro. 2014;46(5):783–788. 10.1007/s11250-014-0565-x [DOI] [PubMed] [Google Scholar]
- 19.Hu JT, Zhao W, Niu LL, Wang LJ, Li L, Zhang HP, et al. Gene organization and characterization of the complete mitochondrial genome of Hainan black goat (Capra hircus). Mitochondrial DNA A. 2016;27(3):1656–1657. 10.3109/19401736.2014.958715 [DOI] [PubMed] [Google Scholar]
- 20.Wu XF, Jia WC, Zhang JJ, Li XC, Pan CY, Lei CZ, et al. Determination of the novel genetic variants of goat STAT5A gene and their effects on body measurement traits in two Chinese native breeds. Small Ruminant Res. 2014;121(2–3):232–243. 10.1016/j.smallrumres.2014.09.002 [DOI] [Google Scholar]
- 21.Ranjan R, Rani A, Metwally A, McGee HS, Perkins DL. Analysis of the microbiome: Advantages of whole genome shotgun versus 16S amplicon sequencing. Biochem Biophys Res Commun. 2016;469(4):967–977. 10.1016/j.bbrc.2015.12.083 [DOI] [PMC free article] [PubMed] [Google Scholar]
- 22.Fouhy F, Clooney AG, Stanton C, Claesson MJ, Cotter PD. 16S rRNA gene sequencing of mock microbial populations-impact of DNA extraction method, primer choice and sequencing platform. BMC Microbiol. 2016;16:123 10.1186/s12866-016-0738-z [DOI] [PMC free article] [PubMed] [Google Scholar]
- 23.Xu YH, Yang HX, Zhang LL, Su YH, Shi DH, Xiao HD, et al. High-throughput sequencing technology to reveal the composition and function of cecal microbiota in Dagu chicken. BMC Microbiol. 2016;16:259 10.1186/s12866-016-0877-2 [DOI] [PMC free article] [PubMed] [Google Scholar]
- 24.Zhang JC, Wang XR, Huo DX, Li W, Hu QS, Xu CB, et al. Metagenomic approach reveals microbial diversity and predictive microbial metabolic pathways in Yucha, a traditional Li fermented food. Sci Rep. 2016;6 10.1038/srep32524 [DOI] [PMC free article] [PubMed] [Google Scholar]
- 25.Rintala A, Pietila S, Munukka E, Eerola E, Pursiheimo JP, Laiho A, et al. Gut microbiota analysis results are highly dependent on the 16S rRNA gene target region, whereas the impact of DNA extraction is minor. J Biomol Tech. 2017;28(1):19–30. 10.7171/jbt.17-2801-003 [DOI] [PMC free article] [PubMed] [Google Scholar]
- 26.Rausch P, Ruhlemann M, Hermes BM, Doms S, Dagan T, Dierking K, et al. Comparative analysis of amplicon and metagenomic sequencing methods reveals key features in the evolution of animal metaorganisms. Microbiome. 2019;7(1):133 10.1186/s40168-019-0743-1 [DOI] [PMC free article] [PubMed] [Google Scholar]
- 27.Wu XY, Zhang HH, Chen J, Shang S, Wei QG, Yan JK, et al. Comparison of the fecal microbiota of dholes high-throughput Illumina sequencing of the V3-V4 region of the 16S rRNA gene. Appl Microbiol Biotechnol. 2016;100(8):3577–3586. 10.1007/s00253-015-7257-y [DOI] [PubMed] [Google Scholar]
- 28.Zhang JC, Guo Z, Lim AAQ, Zheng Y, Koh EY, Ho DL, et al. Mongolians core gut microbiota and its correlation with seasonal dietary changes. Sci Rep. 2014;4 10.1038/srep05001 [DOI] [PMC free article] [PubMed] [Google Scholar]
- 29.Caporaso JG, Kuczynski J, Stombaugh J, Bittinger K, Bushman FD, Costello EK, et al. QIIME allows analysis of high-throughput community sequencing data. Nat Methods. 2010;7(5):335–336. 10.1038/nmeth.f.303 [DOI] [PMC free article] [PubMed] [Google Scholar]
- 30.Langille MGI, Zaneveld J, Caporaso JG, McDonald D, Knights D, Reyes JA, et al. Predictive functional profiling of microbial communities using 16S rRNA marker gene sequences. Nat Biotechnol. 2013;31(9):814–821. 10.1038/nbt.2676 [DOI] [PMC free article] [PubMed] [Google Scholar]
- 31.Zapala MA, Schork NJ. Multivariate regression analysis of distance matrices for testing associations between gene expression patterns and related variables. Proc Natl Acad Sci U S A. 2006;103(51):19430–19435. 10.1073/pnas.0609333103 [DOI] [PMC free article] [PubMed] [Google Scholar]
- 32.Asomaning N, Archer KJ. High-throughput DNA methylation datasets for evaluating false discovery rate methodologies. Comput Stat Data An. 2012;56(6):1748–1756. 10.1016/j.csda.2011.10.020 [DOI] [PMC free article] [PubMed] [Google Scholar]
- 33.do Rosario VA, Fernandes R, Trindade EB. Vegetarian diets and gut microbiota: important shifts in markers of metabolism and cardiovascular disease. Nutr Rev. 2016;74(7):444–454. 10.1093/nutrit/nuw012 [DOI] [PubMed] [Google Scholar]
- 34.David LA, Maurice CF, Carmody RN, Gootenberg DB, Button JE, Wolfe BE, et al. Diet rapidly and reproducibly alters the human gut microbiome. Nature. 2014;505(7484):559–563. 10.1038/nature12820 [DOI] [PMC free article] [PubMed] [Google Scholar]
Associated Data
This section collects any data citations, data availability statements, or supplementary materials included in this article.
Supplementary Materials
(XLSX)
Data Availability Statement
The datasets generated during and/or analysed during the current study are available in the NCBI repository (Metagenomic data: PRJNA347413).


